Abstract
Two-dimensional (2D) F1-1H-coupled HSQC experiments provide 3:1:1:3 and 1:0:1 multiplets for AX3 and AX2 spin systems, respectively. These multiplets occur because, in addition to the 2S+Hza → 2S+Hza process, the coherence transfers such as 2S+Hza → 2S+Hzb occurring in t1 period provide detectable magnetization during the t2 period. Here we present a 2D F1-1H-coupled 1H-15N heteronuclear correlation experiment that provides a 1:3:3:1 quartet for AX3 spin system and a 1:2:1 triplet for AX2. The experiment is a derivative of 2D HISQC experiment (Iwahara et al. [2007] J. Am. Chem. Soc. 129, 2971–2980) and contains a scheme that kills anti-phase single-quantum terms generated in the t1 period. The purge scheme is essential to observe in-phase single-quantum multiplets. Applications to the NH2 and NH3+ groups in proteins are demonstrated.
Keywords: Multiplets, AX3/AX2 spin systems, heteronuclear correlation, 15N
For heteronuclear AX3 and AX2 spin systems, one-dimensional NMR measurement on nucleus A that comprises a single excitation pulse immediately followed by detection without decoupling generally gives an in-phase 1:3:3:1 quartet and a 1:2:1 triplet, respectively, provided that relaxation rates for individual multiplet components are identical. It is because overall modulations of detected magnetizations due to J and chemical shift evolutions are
| (1) |
for an AX3 spin system, and
| (2) |
for AX2. For simplicity sake, we use terms such as ‘1:3:3:1’ and ‘1:2:1’ hereafter, although actual intensity ratios of multiplet components can deviate due to cross-correlations [1].
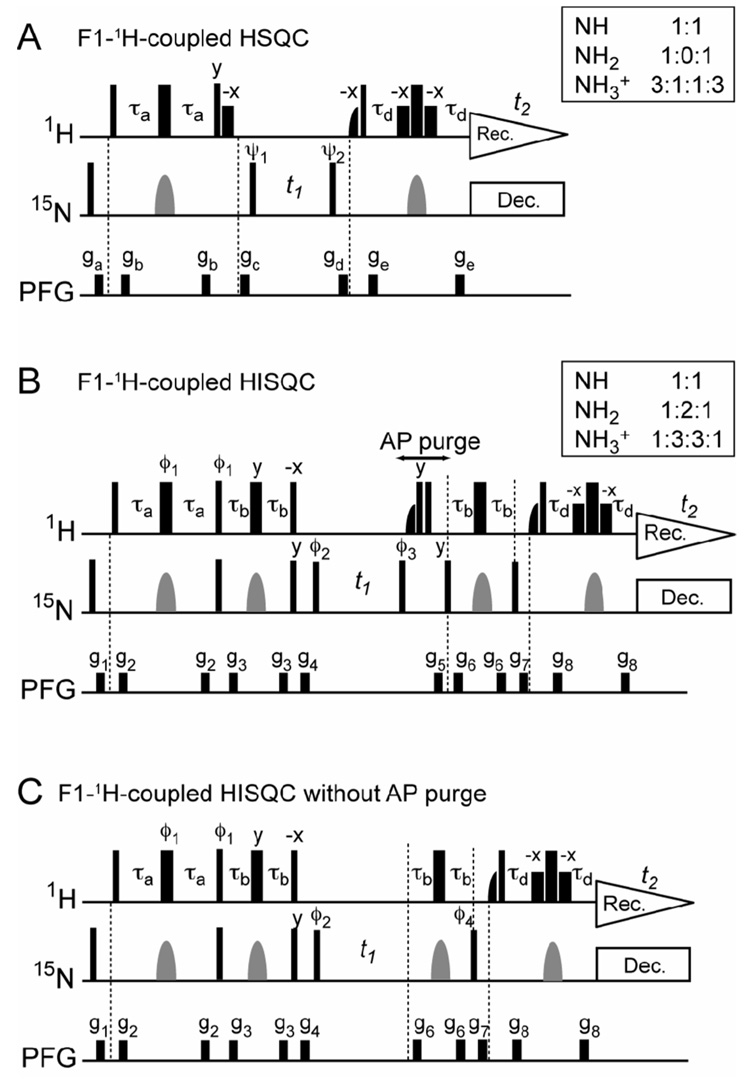
In the case of a two-dimensional heteronuclear correlation experiment, it is not trivial to obtain the in-phase 1:3:3:1 quartet and 1:2:1 triplet. In an F1-1H coupled HSQC experiment (such as one shown in Figure 1A), heteronuclear AX3 and AX2 spin systems exhibit 3:1:1:3 quartet and 1:0:1 triplet, respectively [2–4], because not only the process but also the coherence transfers such as occurring during the t1-evolution period generate magnetizations detectable in the t2-period. With the additional contributions, the real part of the overall modulation due to J and chemical shift evolutions in the t1-period for AX3 is given by:
| (3) |
resulting a 3:1:1:3 quartet. Likewise, the corresponding modulation for AX2 is:
| (4) |
which gives a 1:0:1 triplet. Since it appears to be a doublet, the multiplet itself does not indicate whether the spin system is of AX2 or AX unless the true J-coupling is known.
Figure 1.
Two-dimensional 1H-15N correlation experiments to observe in-phase 15N multiplets. (A) F1-1H-coupled 1H-15N HSQC (B) F1-1H-coupled 1H-15N HISQC (C) F1-1H-coupled HISQC without the AP purge scheme. Thin and thick bars represent 90° and 180° pulses, respectively. Unless indicated otherwise, pulse phases are along x. Water-selective half-Gaussian (2.0 ms) and soft-rectangular (1.2 ms) 90° pulses are represented by half-bell and short-bold shapes, respectively. A gray bell-shape represents a 15N 180° pulse (rectangular or shaped; See legends for Figure 2–4). The 1H carrier position was set at the water resonance. The delay τa, for which the optimal value is considerably shorter than (41JNH)−1 because of fast 1H relaxation caused by rapid water exchange for NH3+/NH2 groups, was set to 2.0–2.7 ms. The other delays: τb = 1.3 ms; τd = τa −1.2 ms. Phase cycles: ψ1 = {x, −x}, ψ2 = {2x, 2(−x)}, and rec. = {x, 2(−x), x} for A; ϕ1 = {y, −y},ϕ2 = {2y, 2(−y)}, ϕ3 = {4y, 4(−y)}, ϕ4 = {4x, 4(−x)}, and rec. = {x, 2(−x), x, −x, 2x, −x} for B and C. Quadrature detection in the t1-domain was achieved using States-TPPI, incrementing the phase ψ1 for A and ϕ2 for B and C. Field-gradients were optimized to minimize the water signal. For higher sensitivity, water-flip-back principle [13] is implemented in each experiment. The pulse sequence in panel C, which does not include the AP purge scheme, is just for comparison purpose and of no practical use (see Figure 2C, Figure 3C and Figure 4C).
In the present study, we have developed a new 2D 1H-15N correlation experiment to observe an in-phase 1:3:3:1 quartet for a NH3+ group and a 1:2:1 triplet for a NH2 group along F1 axis. Figure 1B shows the 2D 1H-15N F1-coupled 1H-15N heteronuclear correlation experiment to observe 1:3:3:1 and 1:2:1 multiplets for NH3 + and NH2, respectively. The experiment was derived from the water-flip-back 2D 1H-15N HISQC (heteronuclear in-phase single quantum coherence; Figure 1C) experiment for NH3+ groups [2], and therefore we refer to it as F1-1H-coupled HISQC. This pulse sequence starts with the 1H excitation, and the coherence transfer form Hy to Nx occurs before the t1 period. The length of delay τb (= 1.3 ms) is a compromise to simultaneously observe NH3+, NH2, and NH, and overall J-modulations for these groups through four τb periods are given by 3cos4 2πJτb sin2 2πJτb (=0.49 with J = 74 Hz), 2cos2 2πJτb sin2 2πJτb (=0.74 with J = 89 Hz), and sin2 2πJτb (=0.55 with J = 93 Hz), respectively. Due to these attenuations along with relaxation loss during the additional schemes, the sensitivity of the F1-1H-coupled HISQC experiment is roughly a half of that of the F1-1H-coupled HSQC. A similar experiment that starts with the 15N excitation instead of the 1H excitation could be more sensitive if the magnetization loss during the coherence transfer from Hy to Nx in the scheme of Figure 1B is over 90% (≈1-γN/γH), which is not the case in the present study; however, such an experiment that starts on 13C with NOE enhancement via 1H saturation should be with acceptable sensitivity for 1H-13C systems [5]. At the beginning of the t1 period, the observed magnetization is an in-phase single-quantum term Ny or Nx, depending on the phase ϕ2. Since there is no 1H- decoupling during the t1 period, anti-phase single-quantum terms such as 2N+Hz, 4N+HzHz, and 8N+HzHzHz are generated. The scheme right after the t1-period (hereafter, referred to as the AP purge scheme; indicated with an arrow in Figure 1B) kills the 2N+Hz and 8N+HzHzHz terms, so only N+ and 4N+HzHz terms can survive. The reason for the survival of 4N+HzHz is that 4NzHxHx generated by 1H 90° pulses in the AP purge scheme cannot be killed with the pulse field gradient because it is a homonuclear zero-quantum term [6–8]. However, the following scheme for coherence transfers does not allow such zero-quantum terms to become observable magnetizations in the t2 acquisition period. Therefore, only the in-phase single quantum term N+ at the end of the t1 period is detectable. Since the real part of the overall modulation for the N+ term in t1 is given by cosnπJt1cosΩt1 (n, number of hydrogens), the spectra obtained with this pulse sequence should show 1:3:3:1, 1:2:1, and 1:1 multiplets for NH3+, NH2, and NH, respectively.
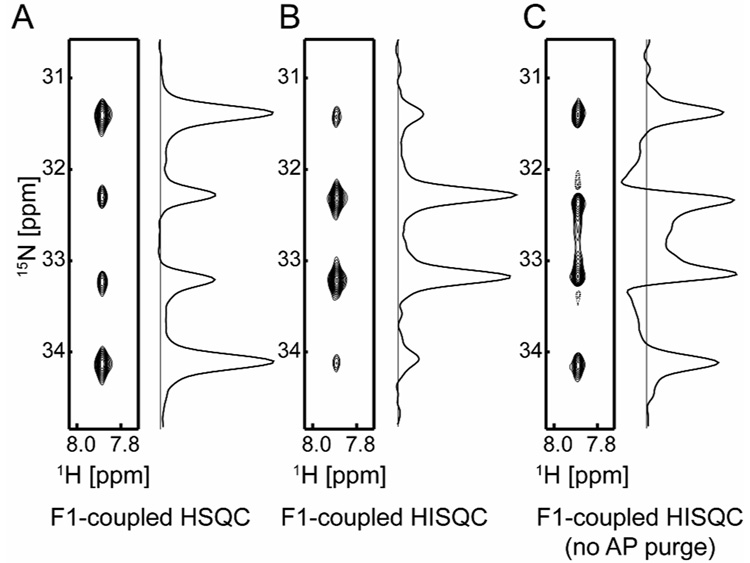
Using the pulse sequences shown in Figure 1, we recorded 2D 1H-15N heteronuclear correlation spectra on NH3+/NH2 groups in proteins (Figure 2 and Figure 3). Data were collected with Varian 800-MHz or 750-MHz NMR systems. Figure 2 displays spectra recorded on the Lys57 NH3+ group of the HoxD9 homeodomain bound to 24-bp DNA complex. Owing to formation of an ion-pair with a DNA phosphate group, this NH3+ group exhibits relatively slow hydrogen-exchange with water molecules and the 1H-15N cross peak from this group can clearly be observed [2]. Just as expected from considerations above, F1-1H-coupled HSQC (Figure 2A) and F1-1H-coupled HISQC (Figure 2B) exhibits in-phase quartets of 3:1:1:3 and 1:3:3:1 types, respectively. Actual intensity ratios deviate from these numbers because the relaxation rates for inner and outer components of the quartet are different due to cross-correlations [2,5,9].
Figure 2.
15N multiplets observed for the Lys57 NH3+ group of 2H/15N-labeled homeodomain bound to 24-bp DNA (Solid contours, positive; Dashed, negative). Spectra in panels A, B and C were recorded at 16 °C with the pulse sequences shown in Figures 1A, 1B, and 1C, respectively. The 15N carrier position was at 30 ppm and r-SNOB pulses[14] selective to lysine 15Nζ nuclei were employed for 15N 180° pulses. Acquisition times for 1H and 15N dimensions were 54 ms and 79 ms, respectively. For data processing, 60°-shifted sine-bell window functions were applied prior to Fourier transformations. The protein-DNA complex was prepared as described previously [15–18] and dissolved with a buffer of 20 mM sodium phosphate and 20 mM NaCl (pH 5.8, 100% 1H2O). The solution was sealed into the inner compartment of the co-axial NMR tube, and D2O for NMR lock was put in the outer compartment to avoid NH2D and NHD2 species[2]. Data were collected at 1H-frequency of 800 MHz and analyzed with the NMRPipe[19] and NMRView[20] programs. The J-coupling was measured to be 74 Hz.
Figure 3.
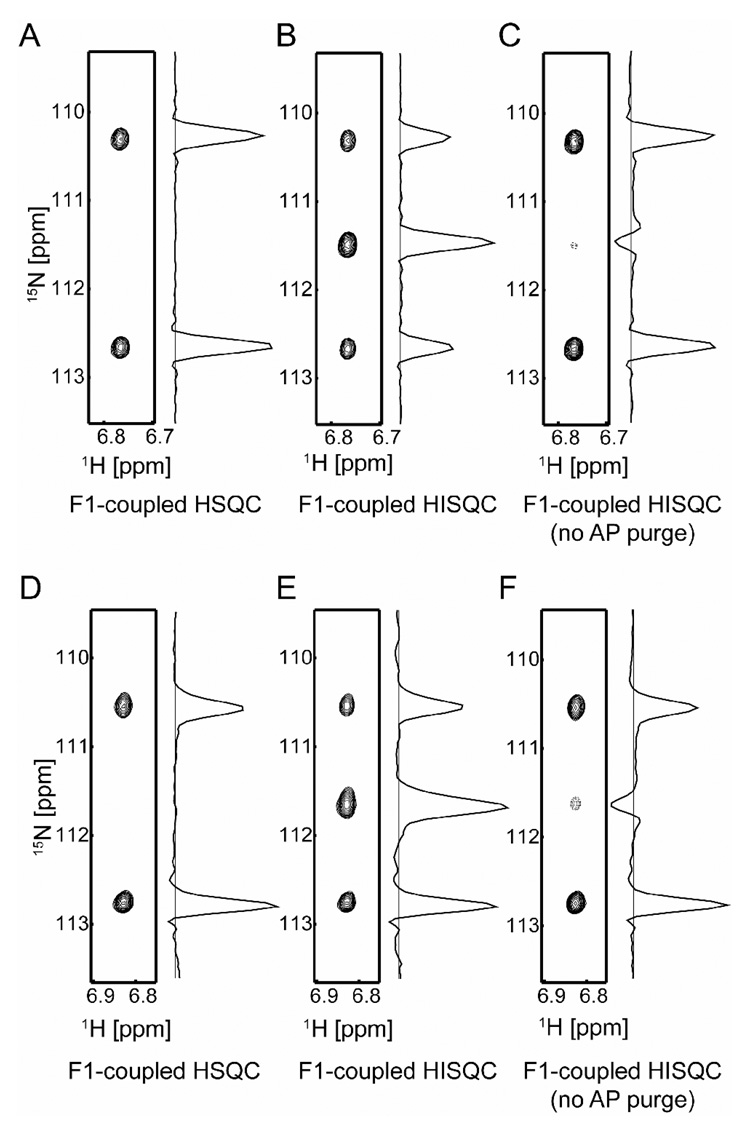
15N multiplets observed for NH2 groups. (A, B, C) Spectra recorded on Gln20 NH2 group in 15N-labeled HMGB1 A-domain. Data were collected at 25 °C with a 750-MHz spectrometer. Acquisition times for 1H and 15N dimensions were 60 ms and 66 ms, respectively. The protein was prepared according to previous literature [10,21] and dissolved with a buffer of 50 mM Tris•HCl and 100 mM KCl (pH 7.4, 100% 1H2O). The protein solution was sealed into the inner compartment of the co-axial tube, and D2O for NMR lock was put in the outer compartment to avoid NHD species. (D, E, F) Spectra recorded on the Gln12 NH2 group of 2H/15N-labeled HoxD9 homeodomain bound to 24-bp DNA. The sample is identical to that used for Figure 2. Spectra were recorded at 16 °C with a 800-MHz spectrometer. Acquisition times for 1H and 15N dimensions were 54 ms and 72 ms, respectively. All 15N 90° and 180° pulses were rectangular with the rf strength of 6 kHz and the carrier position at 116 ppm. For data processing, 60°-shifted sine-bell window functions were applied prior to Fourier transformations.
Figure 3 shows spectra recorded on side-chain NH2 groups of glutamine (Gln) residues in proteins. Panels A, B, and C display spectra recorded on Gln20 in the 15N-labeled HMGB1 A-domain. The rotational correlation time τr for this protein at 25 °C is 9 ns [10]. The NH2 group exhibited 1:0:1 triplets in the F1-1H-coupled HSQC spectrum (Figure 3A) and 1:2:1 triplets in the F1-1H-coupled HISQC spectrum (Figure 3B). The J-coupling was measured to be 89 Hz. For a system with a long τr, the relaxation rates of individual triplet components for a AX2 spin system can be quite different because of cross-correlations between distinct relaxation mechanisms [11]. Such a case is clearly seen in the spectra measured on the Gln12 NH2 groups in the 2H/15N-lableled HoxD9 homeodomain bound to 24-bp DNA at 16 °C (Figure 3D, 3E, and 3F). The value of τr is 15 ns for this system. In this case, the downfield components are substantially shaper than the other components in triplets.
Although one may think that removal of 1H-decoupling from the original HISQC experiment [2] would simply result in 1:3:3:1 and 1:2:1 multiplets, such a pulse sequence (Figure 1C) does not give the desired multiplets. This occurs because the anti-phase single-quantum terms generated in the t1-period also become 1H magnetizations detectable in the t2 acquisition period. In fact, the spectra measured with the simplistic pulse sequence on the same NH3+ and NH2 groups (Figure 2C, Figure 3C, and 3F) are very different from those measured with the AP purge scheme (Figure 2B, Figure 3B, and 3E). Intensity ratios are far from 1:3:3:1 for NH3+ and 1:2:1 for NH2; indeed, the multiplets in Figures 3C and 3F are more similar to 1:0:1 triplets. In addition, some contributions from the anti-phase terms occur with 90°-shifted phases that cause dispersive distortion of the multiplets, which is evident especially in Figure 2C. Thus, the AP purge scheme is essential to obtain 1:3:3:1 and 1:2:1 multiplets.
In conclusion, we have demonstrated the 2D F1-1H-coupled 1H-15N correlation experiment that permits observation of in-phase 1:3:3:1 quartets for NH3+ groups and 1:2:1 triplets for NH2 groups along the F1 axis. This experiment provides a means to distinguish AX, AX2, and AX3 spin systems in a straightforward manner. It is particularly useful when 1H chemical shifts are degenerated. For example, the deprotonated state of an alkyl amino group (NH2) shows a single 1H resonance because of rapid chiral inversion [12]. In such a case, it is hard to distinguish AX and AX2 spin systems with F1-1H-coupled HSQC unless J-coupling is already known, because a 1:0:1 triplet appears to be a doublet. A 1:2:1 triplet is easier to interpret. It should be noted that a rapid hydrogen exchange with a rate greater than 2πJ can cause the self-decoupling effect that results in a 15N singlet even in absence of 1H-decoupling. Considering the range of 1JNH coupling constants, however, it is likely that such a rapid hydrogen exchange simply broadens the signal beyond the detection limit in the present case, because the hydrogen exchange also increases 1H transverse relaxation rates. Finally, it should be pointed out that the principle presented here can readily be applied to 1H-13C systems.
Acknowledgments
This work was supported by grant H-1683 from Welch foundation (to J.I.) and grant ES006676 from the National Institute of Environmental Health Sciences.
Footnotes
Publisher's Disclaimer: This is a PDF file of an unedited manuscript that has been accepted for publication. As a service to our customers we are providing this early version of the manuscript. The manuscript will undergo copyediting, typesetting, and review of the resulting proof before it is published in its final citable form. Please note that during the production process errors may be discovered which could affect the content, and all legal disclaimers that apply to the journal pertain.
References
- 1.Kumar A, Rani Grace RC, Madhu PK. Cross-correlations in NMR. Prog. Nucl. Magn. Reson. Spec. 2000;37:191–319. [Google Scholar]
- 2.Iwahara J, Jung YS, Clore GM. Heteronuclear NMR spectroscopy for lysine NH3 groups in proteins: unique effect of water exchange on 15N transverse relaxation. J Am Chem Soc. 2007;129:2971–2980. doi: 10.1021/ja0683436. [DOI] [PubMed] [Google Scholar]
- 3.Poon DK, Schubert M, Au J, Okon M, Withers SG, McIntosh LP. Unambiguous determination of the ionization state of a glycoside hydrolase active site lysine by 1H-15N heteronuclear correlation spectroscopy. J Am Chem Soc. 2006;128:15388–15389. doi: 10.1021/ja065766z. [DOI] [PubMed] [Google Scholar]
- 4.Tugarinov V, Hwang PM, Ollerenshaw JE, Kay LE. Cross-correlated relaxation enhanced 1H-13C NMR spectroscopy of methyl groups in very high molecular weight proteins and protein complexes. J Am Chem Soc. 2003;125:10420–10428. doi: 10.1021/ja030153x. [DOI] [PubMed] [Google Scholar]
- 5.Kay LE, Bull TE, Nicholson LK, Griesinger C, Schwalbe H, Bax A, Torchia DA. The measurement of heteronuclear transverse relaxation-times in AX3 spin systems via polarization-transfer techniques. J Magn Reson. 1992;100:538–558. [Google Scholar]
- 6.Cano KE, Thrippleton MJ, Keeler J, Shaka AJ. Cascaded z-filters for efficient single-scan suppression of zero-quantum coherence. J Magn Reson. 2004;167:291–297. doi: 10.1016/j.jmr.2003.12.017. [DOI] [PubMed] [Google Scholar]
- 7.Davis AL, Estcourt G, Keeler J, Laue ED, Titman JJ. Improvement of z filters and purging pulses by the use of zero-quantum dephasing in inhomogeneous B1 or B0 fields. J Magn Reson Ser A. 1993;105:167–183. [Google Scholar]
- 8.Thrippleton MJ, Keeler J. Elimination of zero-quantum interference in two-dimensional NMR spectra. Angew Chem Int Ed Engl. 2003;42:3938–3941. doi: 10.1002/anie.200351947. [DOI] [PubMed] [Google Scholar]
- 9.Ollerenshaw JE, Tugarinov V, Kay LE. Methyl TROSY: explanation and experimental verification. Magn Reson Chem. 2003;41:843–852. [Google Scholar]
- 10.Broadhurst RW, Hardman CH, Thomas JO, Laue ED. Backbone dynamics of the A-domain of HMG1 as studied by 15N NMR spectroscopy. Biochemistry. 1995;34:16608–16617. doi: 10.1021/bi00051a008. [DOI] [PubMed] [Google Scholar]
- 11.Miclet E, Williams DC, Jr, Clore GM, Bryce DL, Boisbouvier J, Bax A. Relaxation-optimized NMR spectroscopy of methylene groups in proteins and nucleic acids. J Am Chem Soc. 2004;126:10560–10570. doi: 10.1021/ja047904v. [DOI] [PubMed] [Google Scholar]
- 12.Takayama Y, Castaneda CA, Chimenti M, Garcia-Moreno B, Iwahara J. Direct evidence for deprotonation of a lysine side chain buried in the hydrophobic core of a protein. J Am Chem Soc. 2008;130:6714–6715. doi: 10.1021/ja801731g. [DOI] [PubMed] [Google Scholar]
- 13.Grzesiek S, Bax A. The importance of not saturating H2O in protein NMR. Application to sensitivity enhancement and NOE measurements. J Am Chem Soc. 1993;115:12593–12594. [Google Scholar]
- 14.Kupče E, Boyd J, Campbell ID. Short selective pulses for biochemical applications. J Magn Reson Ser B. 1995;106:300–303. doi: 10.1006/jmrb.1995.1049. [DOI] [PubMed] [Google Scholar]
- 15.Iwahara J, Clore GM. Detecting transient intermediates in macromolecular binding by paramagnetic NMR. Nature. 2006;440:1227–1230. doi: 10.1038/nature04673. [DOI] [PubMed] [Google Scholar]
- 16.Iwahara J, Clore GM. Direct observation of enhanced translocation of a homeodomain between DNA cognate sites by NMR exchange spectroscopy. J Am Chem Soc. 2006;128:404–405. doi: 10.1021/ja056786o. [DOI] [PubMed] [Google Scholar]
- 17.Iwahara J, Zweckstetter M, Clore GM. NMR structural and kinetic characterization of a homeodomain diffusing and hopping on nonspecific DNA. Proc Natl Acad Sci U S A. 2006;103:15062–15067. doi: 10.1073/pnas.0605868103. [DOI] [PMC free article] [PubMed] [Google Scholar]
- 18.Sahu D, Clore GM, Iwahara J. TROSY-based z-exchange spectroscopy: Application to the determination of the activation energy for intermolecular protein translocation between specific sites on different DNA molecules. J Am Chem Soc. 2007;129:13232–13237. doi: 10.1021/ja074604f. [DOI] [PubMed] [Google Scholar]
- 19.Delaglio F, Grzesiek S, Vuister GW, Zhu G, Pfeifer J, Bax A. NMRPipe - a multidimensional spectral processing system based on Unix pipes. J Biomol NMR. 1995;6:277–293. doi: 10.1007/BF00197809. [DOI] [PubMed] [Google Scholar]
- 20.Johnson BA, Blevins RA. NMRView - a computer-program for the visualization and analysis of NMR data. J Biomol NMR. 1994;4:603–614. doi: 10.1007/BF00404272. [DOI] [PubMed] [Google Scholar]
- 21.Iwahara J, Schwieters CD, Clore GM. Characterization of nonspecific protein-DNA interactions by 1H paramagnetic relaxation enhancement. J Am Chem Soc. 2004;126:12800–12808. doi: 10.1021/ja046246b. [DOI] [PubMed] [Google Scholar]


