

Abstract
A microfluidic chip consisting of parallel channels designed for rapid electrophoretic enzyme assays was developed. Radial arrangement of channels and a common waste channel allowed chips with 16 and 36 electrophoresis units to be fabricated on a 7.62 × 7.62 cm glass substrate. Fluorescence detection was achieved using a Xe arc lamp source and commercial CCD camera to image migrating analyte zones in individual channels. Chip performance was evaluated by performing electrophoretic assays for G protein GTPase activity on chip using BODIPY-GTP as enzyme substrate. A 16-channel design proved to be useful in extracting kinetic information by allowing serial electrophoretic assays from 16 different enzyme reaction mixtures at 20 s intervals in parallel. This system was used to rapidly determine enzyme concentrations, optimal enzymatic reaction conditions, and Michaelis-Menton constants. A chip with 36 channels was used for screening for modulators of the G protein: RGS protein interaction by assaying the amount of product formed in enzyme reaction mixtures that contained test compounds. 36 electrophoretic assays were performed in 30 s suggesting the potential throughput up to 4,320 assays per hour with appropriate sample handling procedures. Both designs showed excellent reproducibility of peak migration time and peak area. Relative standard deviations of normalized peak area of enzymatic product BODIPY-GDP were 5% and 11% respectively in the 16 and 36-channel designs.
Introduction
Determination of enzymes and their kinetics is important in biotechnology, biochemistry, clinical chemistry, and pharmaceutical development 1-3. Increasingly, high-throughput characterization of enzymes is important. This is especially true in drug discovery where chemical libraries are commonly screened for potential drugs that inhibit or activate enzymes that are therapeutic targets 1, 4. Where feasible, enzyme activity is assessed using photometric or fluorometric methods to measure changes in substrate and product concentrations 5, 6. If it is not possible to distinguish substrate and product by those techniques, then other methods such as radiochemical assays or HPLC may be used 7. While these latter methods are acceptable in many cases, they are not well-suited for high-throughput applications.
Capillary electrophoresis (CE) has emerged as a promising means to detect and monitor enzyme activity as an alternative to HPLC or radiochemistry 8-10. Advantages of CE include low sample consumption, rapid analysis, high sensitivity, and efficient separation of product from substrate for detection and quantification. CE enzyme assays can take several forms based on how the enzyme and substrate are mixed including: 1) pre-column mixing where CE is used to analyze reaction mixtures; and 2) on-column mixing, also called enzyme-mediated microanalysis, where substrate and product are mixed electrophoretically within the capillary 2, 9, 10. With pre-capillary mixing, it is possible to use rapid CE to continually monitor a reaction and determine enzyme kinetics 11.
The throughput of enzyme assay by CE can be increased by performing separations in parallel using capillary bundles 12-16. In most cases, capillaries used in array instruments are 40-80 cm long and have 50-100 μm i.d. These capillary dimensions are suitable for high efficiency, but cannot deliver high-speed analysis 17. Slow separation compromises the improvement of throughput brought about by using large number of capillaries and precludes experiments aimed at monitoring reaction kinetics.
A promising alternative to capillary-array devices is chip-based CE 18-22. Separation channels a few centimeters long can be easily fabricated on a glass substrate allowing rapid separations. Assays of a variety of enzymes including β-galactosidase 23, protein kinase A 24, and acetylcholinesterase 25 have been demonstrated on single-channel chips. Increasing the number of channels can be achieved for significantly improved throughput. Chips with as many as 384 channels have been demonstrated for genetic analysis 26; however, relatively few applications have been reported demonstrating enzyme assays on multi-channel CE devices. Increased throughput for electrophoretic enzyme assay has been demonstrated on a 4-channel, optically-gated CE device 27. In that study, β-galactosidase was screened against a few inhibitors demonstrating modest throughput. A commercial system (Caliper HTS) is available with 4 parallel channels (now also available with 12 channels) to generate throughput of 384 samples in 80 min for kinase assays 28, 29. This sophisticated device also incorporates automated sampling from multi-well plates and automated chip conditioning. In this work we explore the use of 16- and 36-channel chips that are suitable for both monitoring reactions on the seconds time scale to determine kinetics and analyzing quenched reactions.
We use an assay of G protein GTPase activity as a model because of its significance in intracellular signaling 30, 31. When a G protein-coupled receptor (GPCR) is activated, it stimulates exchange of GDP for GTP in the Gα subunit of the heterotrimeric G protein associated with the GPCR. The Gα-GTP complex is active, sending signals to downstream effectors such as adenylyl cyclase. Hydrolysis of GTP to GDP by the G protein terminates the signal. It has been shown that GTPase activity can be accelerated by Regulators of G protein Signaling (RGS) proteins which bind the G protein 32-34. G protein hydrolysis activity and its regulation by RGS have emerged as interesting drug targets. Low RGS activity is associated with high blood pressure 35, schizophrenia 36, and drug addiction 37 suggesting that agents that increase RGS activity may be useful in treating these conditions. Substances that inhibit RGS activity may be useful in increasing the potency of GPCR ligands 38. Currently available assays for GTPase activity and its modulation by RGS are not ideal. The most common GTPase assay uses [γ-32P]GTP as G protein substrate 39. A fluorescence assay based on changes of G protein intrinsic fluorescence during hydrolysis was also demonstrated 40. Binding of G protein and RGS protein has been detected by flow cytometry and used in screening for potential RGS inhibitors 41. These methods are either inconvenient for high-throughput or do not report on actual hydrolysis activity. Recently we demonstrated that GTPase activity and modulation by RGS could be detected by using BODIPY® FL GTP (BGTP) as substrate and rapid CE to detection conversion to the product BODIPY® FL GDP (BGDP) 11.
In this work, we used multi-channel electrophoresis chips to monitor GTPase activity in real-time for kinetics determinations. Potential applications include rapid determination of kinetics, determination of enzyme concentrations, and optimization of reaction conditions. In addition, we mimicked drug screening against G protein and RGS protein and characterized dose-response curves.
Experimental Section
Materials
BGTP and BGDP were obtained from Molecular Probes, Inc. (Eugene, OR). Gαo and RGS8 were expressed and purified as described previously and stored at -80°C until used 11. The peptide Ac-Val-Lys-c(Et)[Cys-Thr-Gly-Ile-Cys]-Glu-NH2 (YJ34), where c(Et) designates cyclization via an ethylene dithioether linking the Cys side chains, was synthesized and purified as previously described 42, dissolved in DMSO and stored as 2 mM aliquots at -20 °C. Methyl N-[(4-chlorophenyl)sulfonyl]-4-nitrobenzenesulfinimidoate (CCG-4986) was from the screening compound library from the Chembridge screening collection (hit2lead.com) 41. All other chemicals were purchased from Sigma. All buffers were made using Milli-Q (Millipore, Bedford, MA) 18-MΩ deionized water and filtered using 0.2-μm SFCA membrane filters (Nalgene Labware, Rochester, NY).
All BGTP hydrolysis experiments were performed with Tris-Glycine buffer (containing 25 mM Tris base and 192 mM glycine) supplemented with 1 mM EDTA and 10 mM MgCl2 (TGEM buffer) as the solvent except for those studying the effect of Mg2+ on Gαo GTPase activity. Electrophoresis buffer was 25 mM Tris- 192 mM Glycine buffer (pH 8.3) supplemented with 8 mM MgSO4.
Microfluidic Chip Fabrication
Microfluidic networks consisting of either 16 or 36 separation channels were fabricated on a 76 mm × 76 mm borofloat glass substrate according to a previously described procedure 43. Briefly, 0.7 mm thick borofloat glass photomask blanks pre-coated with a 530-nm layer of AZ1518 positive photoresist on top of another 120-nm layer of chrome were purchased from Telic Co. (Santa Monica, CA). A custom-made photomask (Fineline Imaging, Colorado Springs, CO) patterned with the microfluidic network (Figure 1 (a) and (b)) was used to transfer the network design onto the photomask blanks by exposing for 4 s at 26 W cm-2. The exposed photomask blanks were developed in AZ915 MIF developer (Clariant Corp., Summerville, NJ) and then treated with CEP-200 chrome etchant (Microchrome Technologies, Inc., San Jose, CA). 12 μm deep channels were then formed by etching the exposed glass in 14:20:66 (v/v/v) HNO3/HF/H2O for 20 min. 360 μm diameter access holes were drilled onto the etched plate with diamond-tipped drill bits (Kyocera, Ervine, CA). Both the etched and another blank substrate were thoroughly cleaned in Piranha solution (3:1 v/v H2SO4/H2O2) for 20 min and then with RCA solution (5:1:1 v/v/v H2O/NH4OH/H2O2) for 40 min at 60 °C. The cleaned substrates were pressed together when wet and bonded at 610 °C for 8 h in a Neytech Centurian Qex furnace (Pacific Combustion, Los Angeles, CA). Sample and buffer reservoirs were attached to the bonded chip using epoxy (Epo-Tech., Bellerica, MA). Figure 1 (c) shows the completed 36-channel chip.
Figure 1.
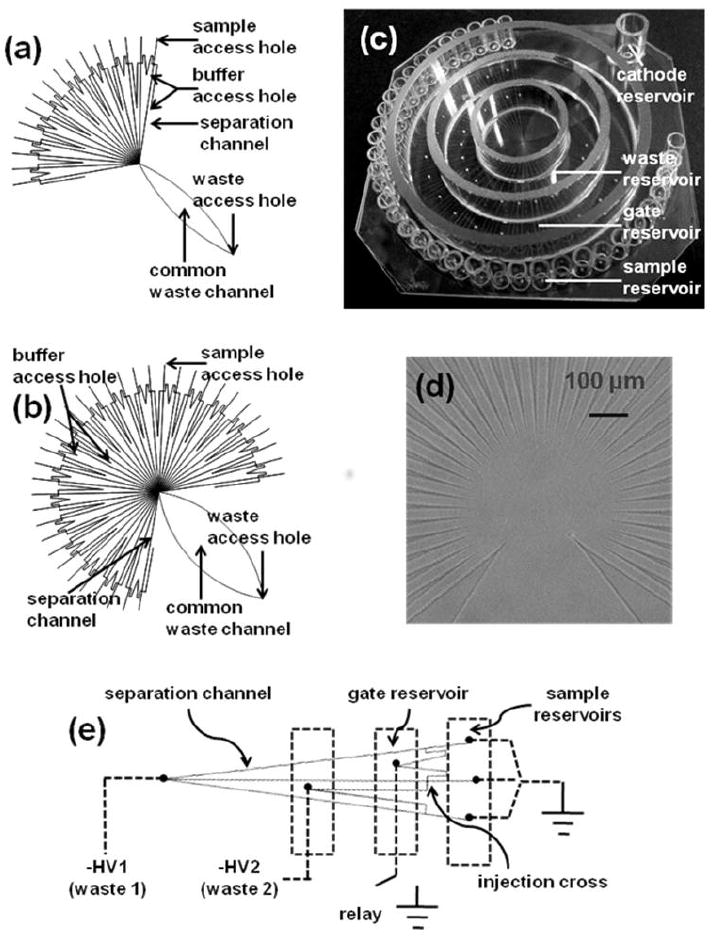
Microfluidic devices used for parallel electrophoretic enzyme assays. (a). Design of microfluidic network containing 16 parallel separation channels. Dimensions of each section were as follows: 7 mm from sample access hole to injection cross; 27 mm for separation channel (from injection cross to center where all separation channels converge); 8 and 13 mm for two other channels connecting the injection cross; 35 mm long and 6 mm wide at the widest point for the common waste channel. (b) Design of 36-channel network. Dimensions were similar to the 16-channel chip except the common waste channel was 40 mm long and 13 mm wide at the widest point. (c) Photograph of finished 36-channel chip. 1 cm long glass tubes of volume of 50 μL each were used for individual sample reservoirs. Two groups of access holes were separately connected to gate reservoir and waste reservoir which were formed by using three glass rings. Common waste channel led to another cathode reservoir to which −HV was applied. (d). Bright-field image of the detection area on the 36-channel chip. (e) Repetitive units of microfluidic network. Electrokinetic injection procedure is described in experimental section.
Mircrofluidic Chip Operation
Before use, chips were conditioned with 0.1 M NaOH in 50:50 (v/v) H2O/methanol by electrophoretically perfusing the solution through all channels for 30 min. This treatment was followed by conditioning channels with deionized water and electrophoresis buffer for 5 min each. To prepare the chip for CE separation, samples were loaded onto sample reservoirs which were grounded using a platinum electrode array fabricated in-house. As shown in Figure 1(e), samples were driven towards the injection cross channel by voltage 1 (-4 kV and -2.5 kV for 16 and 36 channel designs respectively) at the chip center. Sample loading onto the separation channel at the injection cross was controlled by voltage 2 and the relay (Kilovac, Santa Barbara, CA) connected at the waste 1 and gate reservoirs respectively. (These reservoirs were common to all electrophoresis units as shown in 1(b).) With the relay closed sample was shunted to waste 1 while opening the relay for 0.5 to 1.0 s allowed a plug of sample to be injected onto the separation channel. All voltages were applied with a Spellman High Voltage Electronics CZE1000R power supply (Happauge, NY). Applied voltage and frequency of injection were controlled by a personal computer equipped with a multi-function board (AT-MIIO-16, National Instruments, Austin, TX) using software written in-house.
Fluorescence Detection and Data Analysis
Excitation light from a 300 W Xe arc lamp (LB-LS/30, Sutter Instrument Company, Novato, CA) was filtered through a FITC filter cube (Semrock, Rochester, NY) before it was focused onto the chip detection region at the center of the chip (Figure 1 (d)) with an objective lens (Olympus America Inc., Melville, NY). Emission light was collimated with the same objective and detected using an electron-multiplying CCD camera (C9100-13, Hamamatsu Photonic Systems, Bridgewater, NJ). Time-lapse fluorescence images of the detection region were collected using an inverted epi-fluorescence microscope (IX71, Olympus America, Inc., Melville, NY) at ~15 Hz and analyzed with Slidebook software (Intelligent Imaging Innovations, Inc., Denver, CO). Electropherograms from individual channels were reconstructed from the images before they were analyzed using software written in-house 44. To test this system for cross-talk between channels, solutions without fluorophore were injected into channels parallel to those with fluorophore. No peaks were detected in the blank channels. In addition, no signal was detected when imaging the area between channels when all channels had fluorophore pumped through them. From these results we concluded that no detectable cross-talk occurred between channels.
G protein assay and drug screening
Assay was done in a real-time monitoring format on the 16-channel chip. Hydrolysis was initiated by mixing G protein and BGTP in reaction buffer and then loading 50 μL of the sample into sample reservoirs on the chip. Periodic injections were then made to track the evolution of BGDP peak. The initial portion of BGDP peak growth was fitted to a linear equation and the resulting slope converted to hydrolysis rate using a previously acquired calibration curve. Derived hydrolysis rates were used as indications of G protein enzymatic activities. On the 36-channel chip, all assays were performed on quenched reactions. G protein, BGTP and other modulators as indicated were incubated in the TGEM buffer at room temperature for specific period before reactions were quenched by adding excess GTPγS. The quenched reactions were stored on ice prior to loading on chip for analysis. The final BGDP concentrations were derived and quantified from the acquired electropherograms and calibration curves. BGDP formation was calculated by subtracting out the initial BGDP residue existing in the BGTP sample. The calculated BGTP turnover rates were used to determine the stimulatory or inhibitory effects of test substances.
RESULTS AND DISCUSSION
Chip Performance
Electrophoretic assay of GTPase activity requires separation and quantification of the G protein substrate BGTP, the product BGDP, and the internal standard rhodamine 110 (R110). To determine kinetics by monitoring the enzyme reaction, it is necessary to perform serial injections from a given sample at a rate sufficient to achieve adequate temporal resolution. Separation time also affects the ability to perform high throughput assays. To implement parallel enzyme assays on chip, reliable and reproducible channel performance, including reproducible migration times across channels, is required. We therefore tested the 16- and 36-channel devices for their suitability for serial separation of substrate, product, and internal standards.
Typical serial electropherograms on a 16-channel chip are shown in Figure 2. As shown, the substrate, product, and internal standard were well-resolved in 18 s and injections could be reliably performed serially across all channels. The separation time is limited by the electric field applied to the separation channel. In the 16-channel design, electrical resistance of separation channel is about 250-fold that of the common waste channel. The total resistance of 16 parallel separation channels is about 15-fold that of the common channel. Therefore, with -4 kV applied to the cathode reservoir an electric field of -1.1 kV/cm was developed in the separation channels. In the 36-channel design, electrical resistance of a single separation channel is about 470-fold that of the common channel. So the total resistance of 36 parallel separation channels is about 13-fold higher than that of the common channel. In similar experiments with 36-channel chips, -2.5 kV was applied to the cathode resulting in – 0.68 kV/cm electrical field. As a result, the separation of R110, BGDP and BGTP took longer, about 30 s. At these voltages Joule heating, evidenced by non-linear Ohm plots, was not observed. Rather, voltages applied in both cases were limited by the maximal current allowed by the high-voltage power supply. Should higher current power supplies be available a higher separation voltage could be applied to attain even faster and higher resolution separation.
Figure 2.
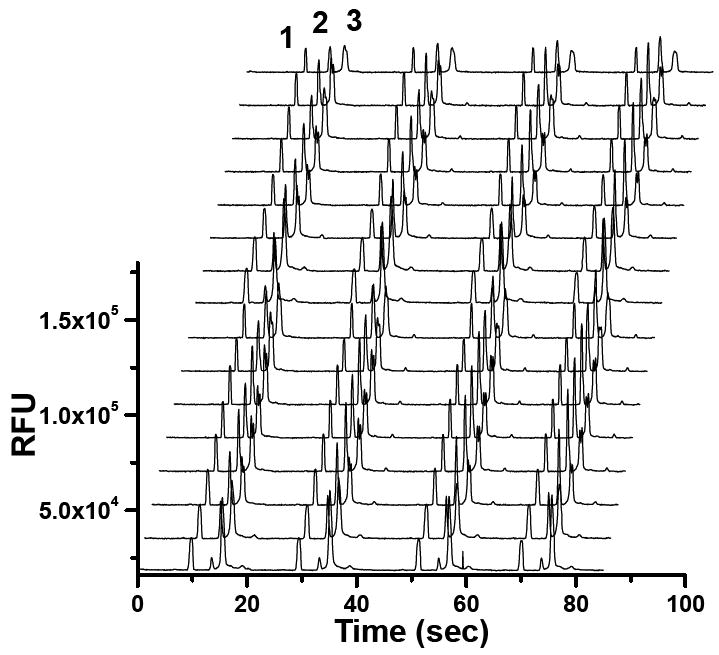
Typical serial electropherograms acquired in parallel from a 16 channel-chip. Solution containing 26.2 nM rhodamine 110 (peak 1), 1.0 μM BGTP (peak 3) and trace amount of BGDP (peak 2) was serially injected 4 times onto each channel at 20 s intervals.
The reproducibility of migration times for both the 16- and 36-channel chips was excellent with RSDs of 1.5% (n = 6) and 2.5% (n = 6) respectively. Good reproducibility allowed for controlling injection on all channels using a single high-voltage relay because the injections could be performed simultaneously. This simplified instrumentation as well as computer control of the relay.
Within a single channel, RSDs of peak area of R110 and BGDP were about 1.5% and 2.0% respectively, and that of the peak area ratio BGDP/R110 was around 3%. Absolute peak areas across all channels were not reproducible enough to achieve quantification (relative standard deviation could be as high as 33%). Therefore relative peak area of BGDP to R110 was always used for quantification. In the 16-channel design, the relative standard deviation of BGDP peak area normalized to internal standard R110 was around 5% across all channels. However, in the 36-channel design, the RSD was increased 11%. This RSD is acceptable for quantification in some cases, but the best quantitative results were obtained by calibrating each channel individually.
We next compared calibration curves across different channels by plotting BGDP/R110 peak area ratios as a function of BGDP concentration from 100 to 800 nM. Linear response was found for all channels with variation of 5.1% in slope for both the 16- and 36-channel designs indicating good channel-to-channel homogeneity. Therefore all channels had similar sensitivity and detection limit of GTPase activity.
It is desirable that chips maintain their performance as long as possible. The most common reason for chip failure was particle accumulation, especially around the common outlet. In preliminary experiments, we found that a wide common waste channel was essential in preventing particulates from accumulating at the outlets of separation channels. This is probably because the wide channel helps decrease pressure build-up at the center of the chip and facilitates particles and fluid passing through the waste channel. With the wide channel, small particles could be observed passing through the common channel and clogging rarely happened in the separation process. Precipitate that did build up during chip storage could be easily removed by perfusing diluted nitric acid, water, and then NaOH through channels by vacuum. By using these procedures a chip could be used daily for at least 2 weeks (~400 electrophoresis injections per channel per week) without significant loss of performance. As the chip was used, the differences in migration time between individual channels gradually became greater so that after about 2 weeks these differences in migration times were large enough to make parallel analysis difficult. Even after this time however, intrachannel reproducibility for migration time and peak areas was sufficient for quantitative analysis.
Parallel Kinetic Enzyme Assays on Chip
We next explored the possibility of using multiplexed channel chip to monitor GTPase hydrolysis kinetics of multiple samples simultaneously. For these kinetics experiments, the 16-channel chip was used because of the better temporal resolution. In initial experiments, BGTP hydrolysis rates at different concentrations of G protein were examined. G protein at 8 different concentrations from 10 to 125 nM was mixed with a fixed concentration of substrate BGTP. Immediately after mixing the samples were loaded into separate sample chambers on the chip (each concentration of G protein was loaded onto and analyzed by two different channels) and monitored by serial electropherograms acquired at 20 s intervals. The resulting hydrolysis rates from those two channels were averaged to generate calibration curves for G protein concentration. These curves could be fit by linear regression (slope = 0.0087 ± 0.0008 nM BGDP formed per nM G protein per second, r2 = 0.83 for n = 4 calibrations). The linear fit could be improved by using only the G protein concentrations from 10 to 60 nM (r2 = 0.94) due to non-linearity and lower reproducibility at high G protein concentrations. These effects at higher G protein concentrations occurred because it took about 5 min to load the samples into the chip and during this time rapid hydrolysis that occurred at higher protein concentrations consumed sufficient BGTP to affect the rate measurement. Variation in time of sample loading would directly lead to variation in measured rates. Automated loading or on-chip mixing could alleviate this error. Channel-to-channel reproducibility at low G protein concentrations was generally good, below 15%. Under conditions used in the experiments, the LOD for G protein by its enzymatic activity was 10 nM. This detection limit could easily be improved by increasing the incubation time using off-line assay.
For characterizing enzymes, it is often necessary to vary buffer composition to identify how different factors affect enzyme behavior and to optimize conditions. For example, G protein hydrolysis is dependent upon Mg2+ which is required for BGTP to effectively bind to G protein. Optimizing conditions can be a slow process if performed serially. To demonstrate rapid reaction optimization using the 16-channel chip, we varied the Mg2+ concentration and monitored hydrolysis kinetics. By monitoring BGTP hydrolysis by G protein at 8 concentrations of Mg2+ in duplicate on the 16-channnel chip, the optimization could be accomplished in a single experiment (Figure 3). The results showing a linear increase up to 5 mM Mg2+ are in good agreement with previous studies11.
Figure 3.
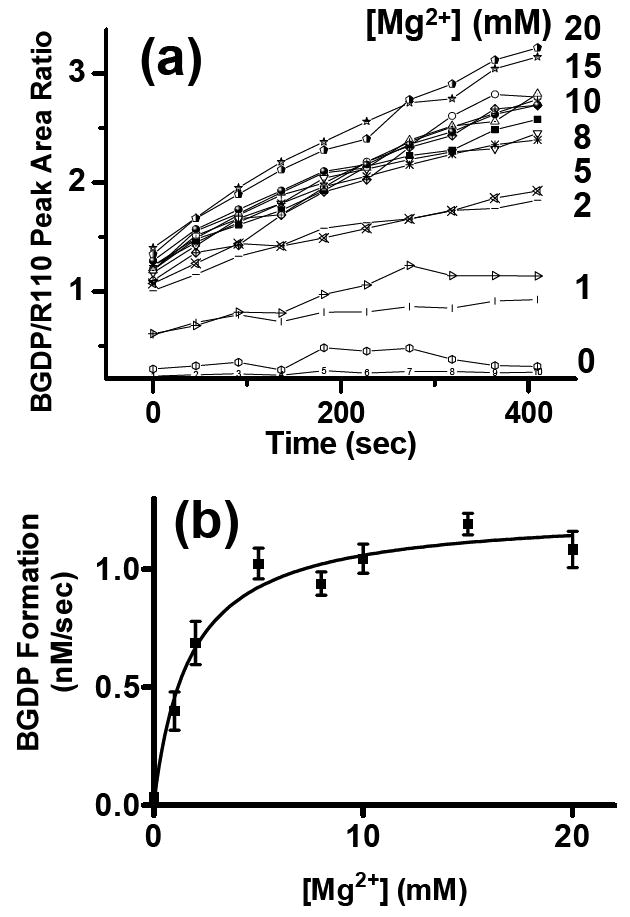
Optimizing enzyme conditions. (a) BGDP peak heights recorded by serial electrophoresis from 16-channels when BGTP was hydrolyzed by Gαo at various Mg2+ concentrations. Each sample reservoir was filled with a solution of 83.3 nM Gαo, 1 μM BGTP, and 21.8 nM R110 in TGE buffer spiked with Mg2+ concentrations as shown. Each Mg2+ concentration was used in two separate channels. BGDP formation was monitored and BGDP/R110 ratios were used to indicate the real-time concentrations of BGDP in the reaction mixtures. (b) Plot showing Gαo hydrolytic activities at different Mg2+ concentrations. Hydrolysis rates indicated by BGDP formation (nM/sec) were derived from linear fitting of Figure 4 (a). The rates were fitted to a one-site binding function versus Mg2+.
The multi-channel chip also allows kinetic parameters of enzymes to be rapidly determined. For example, measuring enzymatic activity across a range of substrate concentration is used to determine Km. This process can be greatly shortened by running assays on the 16-channel chip. In our experiment, BGTP of concentrations ranging from 50 nM to 2.5 μM was mixed with 42 nM G protein and loaded onto the 16-channel chip. The hydrolysis rate at each BGTP concentration was monitored in two separate channels. As shown in Figure 4, BGTP turnover rates can be fitto the Michaelis-Menton equation. Km and kcat calculated by curve fitting were 305 ± 85 nM and 0.015 ± 0.001 sec-1 respectively. These results are comparable to previously reported Km of 300 nM and kcat of 3.6 × 10⁻² s-1 for GTP 45, 46 and 120 nM and 8.3 × 10⁻³ s-1 for BGTP 11.
Figure 4.
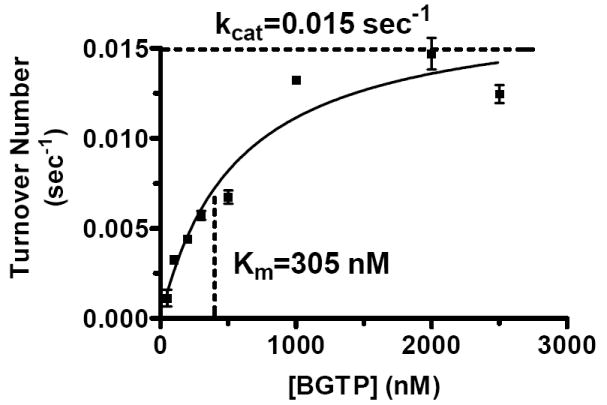
Determination of Enzyme Kinetics. 20.8 nM Gαo was incubated with 0.05, 0.1, 0.2, 0.3, 0.5, 1.0, 2.0, and 2.5 μM BGTP respectively in TGEM buffer at room temperature. Hydrolysis rates expressed in turnover number were calculated by real-time monitoring and plotted against BGTP concentrations. Data were fit to the Michaelis-Menton function.
Although enzyme kinetics can be measured by a variety of analytical techniques, the results shown here illustrate a unique potential for rapid separations in parallel channel electrophoresis. Optical methods in principle could be operated in parallel, but they require changes in optical properties upon conversion from substrate to product which is not always the case, as is true here for GTP with the BIODIPY label on the sugar. Radiochemical methods require hazardous substances and frequent multiple washing and rinsing steps. Slower parallel CE methods are not well-suited for on-line kinetics measurements. Thus, the combination of rapid measurement in parallel with electrophoretic separation allows kinetics to be measured in parallel even for enzymes where the substrate and product are indistinguishable by optical methods.
Parallel Analysis of Quenched Reaction Mixtures: Drug Screening and Dose Response Curves
In addition to the multi-point kinetic data, it is also frequently of interest to measure the extent of reaction at a fixed time point. For example, dose response curves for compounds that affect enzyme activity are typically measured at fixed times. Similarly, in combinatorial screening for enzymatic activators or inhibitors, the extent of reaction at a single time point is often measured. We therefore examined the possibility of performing such measurements using the multiplexed chip. In this experiment, serial analysis was less important than parallel measurements so the 36-channel chip was used.
Because RGS has become an interesting drug target, we tested the possibility of screening against RGS protein effects on GTPase activity. The principle of the assay is illustrated in Fig. 6. G protein was mixed with substrate for a fixed period and the hydrolysis reaction was then quenched by addition of an excess of the non-hydrolyzable GTP analog GTPγS (see Experimental section for details). As shown in Fig. 6, the extent of hydrolysis reaction is increased by the presence of RGS protein in the reaction mixture. Inhibition of RGS activity results in less net hydrolysis. Therefore, comparison of BGDP formation with and without test compound in the presence of RGS allowed detection of inhibitors. The steady state assay used here is made possible by the rapid dissociation of BGDP from G protein. RGS assays normally require a single turnover format, which is requires more sophisticated mixing because the RGS effect is masked by slow dissociation of GDP from the G protein.
Figure 6.
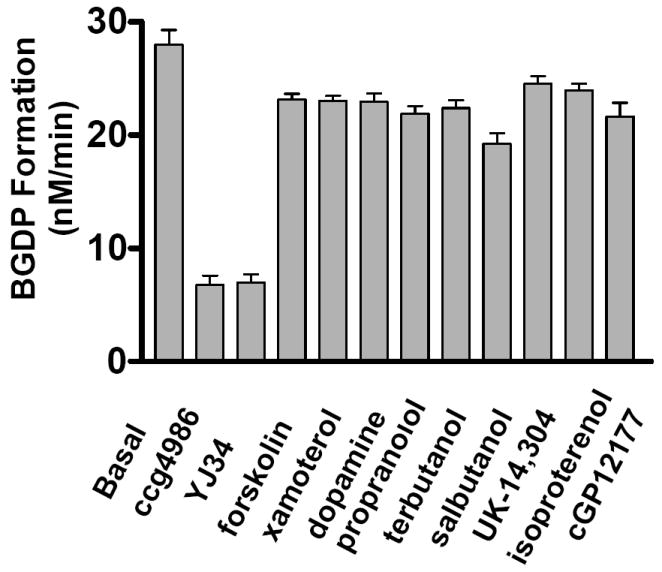
GTPase accelerating activity of RGS8 in the presence of test compounds. 1 μM BGTP was incubated with 20 nM Gαo and 321 nM RGS8 in the presence of 11 different compounds. BGDP formation rates were used indicate RGS8 activities. All compounds were at 102 μM except YJ34 which was at 40.8 μM.
For the screen we tested the effect of 11 compounds. YJ34 had previously been shown to interfere with G protein-RGS8 binding and would therefore be expected to inhibit BGTP hydrolysis 47. CCG-4986 was reported to interfere with G protein-RGS4 binding but not G protein-RGS8 binding and was expected to not have an effect 41. The other 9 compounds were known drugs but not expected to have any activity on this system. Each reaction mixture containing one drug was analyzed in triplicate using three separate channels. The results are summarized in Figure 6. As shown, the expected inhibitory effect of YJ34 was detected and the 9 negative controls gave similar responses to each other. Interestingly, CCG-4986 showed an inhibitory effect. This could be due to several possibilities including: 1) inhibition of hydrolysis activity independent of inhibition of binding, which is one of the reasons for using activity instead of binding assays or 2) an artifact of using BGTP instead of GTP in the assay. While further work would be required to resolve this issue, the data overall illustrate the potential for screening with the chip-based system. We used Z’ value to evaluate the reproducibility of the assay. The Z’ is by definition = 1.0 - (3.0 × (Sneg + Spos) / R) where Sneg and Spos are the standard deviation of the signal of negative and positive controls respectively, and R is the difference between the mean of positive and negative controls 48. We determined a Z’ = 0.7 for the assay which is well above the 0.5 considered necessary for high-throughput screening. Also, the assay only required 30 s (the separation time) for 11 compounds to be analyzed (in addition to one control sample) in triplicate corresponding to a throughput of 1,440 samples per hour. If only single samples were analyzed the throughput could be 4,320 samples per hour. Naturally, achieving throughput this high would require a means of introducing new samples to the chip rapidly and automated sample preparation procedures.
We also tested the ability to quantitatively determine dose-response curves across channels with a single experiment. Nine concentrations of Gαo inhibitor GTPγS and activator RGS8 separately were included in the reaction mixtures containing G protein and BGTP. After incubation of 30 and 15 min respectively, reactions were quenched with GTPγS and put on ice before analysis. Each reaction mixture was analyzed in two separate channels and BGDP formation was quantified (Figure 7). GTPγS showed EC50 of 18.8 nM and a maximal inhibition of 97.7% of basal GTPase activity. Concentrations of RGS8 available for testing were not enough to cover the whole dose-response range and therefore data were not shown here.
Figure 7.
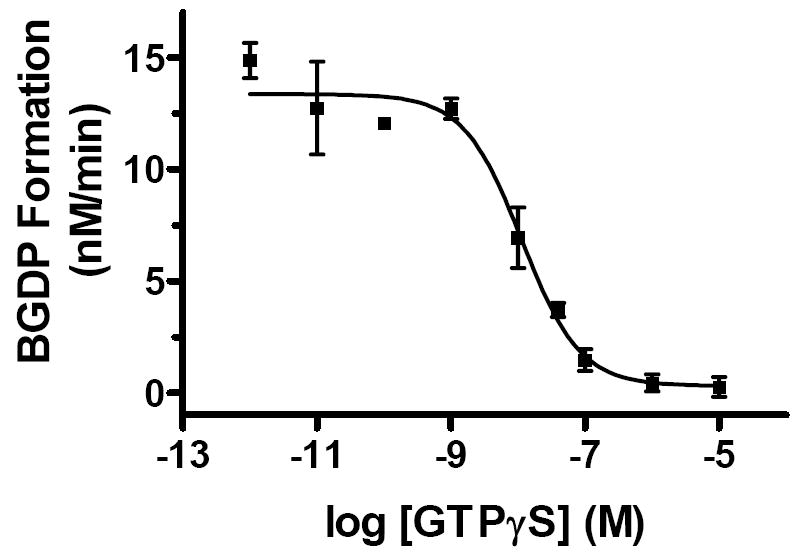
Dose response curve for GTPγS inhibiting Gαo GTPase activity. Nine concentrations of GTPγS were tested for the effect on basal BGTP hydrolysis rate. Reaction mixture containing each concentration of GTPγS was analyzed in 2 separate channels. The calculated EC50 value was 18.8 ± 8 nM. At maximal inhibition GTPase was 2.3% of basal level. Error bars are ±1 SD.
CONCLUSIONS
The microfabricated channel-array electrophoresis device described here is suitable for parallel enzyme assays. The combination of fast separations and parallel operation yields a versatile platform for determining kinetics, enzyme concentrations, optimizing reactions, screening inhibitors, and determining dose response curves. Although the system has the potential for high throughput screening assays, the development of improved sample introduction will be required for this system to be used for such applications. The assay for RGS-G proteins appears to be sufficiently sensitive for drug screening.
Figure 5.

Electrophoretic assay for RGS GTPase accelerating activity and its inhibition. (left) Basal hydrolysis by Gα alone results in formation of BGDP from BGTP; (middle) RGS protein accelerates the GTPase activity of Gα resulting in a larger BGDP peak formation; (right) addition of an inhibitor interferes with RGS and Gα interaction and thus diminishes the acceleratory effect of RGS protein resulting in a smaller BGDP peak in the electropherogram. All solutions were incubated for 20 min and then quenched with 10 μM GTPγS before electrophoretic analysis.
Acknowledgments
Financial support for this project was provided by NSF CHE-0514638 to R.T.K. and NIH R01-DA023252 to R.R.N.
References
- 1.Goddard JP, Reymond JL. Curr Opin Biotechnol. 2004;15:314–322. doi: 10.1016/j.copbio.2004.06.008. [DOI] [PubMed] [Google Scholar]
- 2.Eisenthal R, Danson M. Enzyme assays: a practical approach. Oxford University Press; 2002. [Google Scholar]
- 3.Inglese J, Johnson RL, Simeonov A, Xia M, Zheng W, Austin CP, Auld DS. Nat Chem Biol. 2007;3:466–479. doi: 10.1038/nchembio.2007.17. [DOI] [PubMed] [Google Scholar]
- 4.Bush K. Drug Metab Rev. 1983;14:689–708. doi: 10.3109/03602538308991405. [DOI] [PubMed] [Google Scholar]
- 5.Hennig A, Bakirci H, Hau WM. Nat Methods. 2007;4:629–632. doi: 10.1038/nmeth1064. [DOI] [PubMed] [Google Scholar]
- 6.An L, Tang Y, Feng F, He F, Wang S. J Mat Chem. 2007;17:4147–4152. [Google Scholar]
- 7.Rossoando E. HPLC in enzymatic analysis. J Wiley & Sons; New York: 1998. [Google Scholar]
- 8.Bao JJ, Fujima JM, Danielson ND. J Chromatogr B. 1997;699:481–497. doi: 10.1016/s0378-4347(96)00244-7. [DOI] [PubMed] [Google Scholar]
- 9.Glatz Z. J Chromatogr B. 2006;841:23–37. doi: 10.1016/j.jchromb.2006.02.051. [DOI] [PubMed] [Google Scholar]
- 10.Novakova S, Dyck SV, Schepdael AV, Hoogmartens J, Glatz Z. J Chromatogr A. 2004;1032:173–184. doi: 10.1016/j.chroma.2003.12.025. [DOI] [PubMed] [Google Scholar]
- 11.Jameson EE, Roof RA, Whorton MR, Hosberg HI, Sunahara RK, Neubig RR, Kennedy RT. J Biol Chem. 2005;280:7712–7719. doi: 10.1074/jbc.M413810200. [DOI] [PubMed] [Google Scholar]
- 12.Pang H, Kenseth J, Coldiron S. Drug Discovery Today. 2004;9:1072–1080. doi: 10.1016/S1359-6446(04)03293-3. [DOI] [PubMed] [Google Scholar]
- 13.He Y, Yeung ES. Electrophoresis. 2003;24:101–108. doi: 10.1002/elps.200390000. [DOI] [PubMed] [Google Scholar]
- 14.Dai J, Tu J, Anderson LN, Bao JJ, Liu C, Quay B, Wehmeyer KR. LC-GC N Am. 2002;20:606–612. [Google Scholar]
- 15.Tu J, Anderson LN, Dai J, Peters K, Carr A, Loos P, Buchanan D, Bao JJ, Liu C, Wehmeyer KR. J Chromatogr B. 2003;789:323–335. doi: 10.1016/s1570-0232(03)00102-8. [DOI] [PubMed] [Google Scholar]
- 16.Marsh A, Altria K. Chromatographia. 2006;64:327–333. [Google Scholar]
- 17.Ma L, Gong X, Yeung ES. Anal Chem. 2000;72:3383–3387. doi: 10.1021/ac000145o. [DOI] [PubMed] [Google Scholar]
- 18.Auroux P, Lossifidis D, Reyes DR, Manz A. Anal Chem. 2002;74:2637–2652. doi: 10.1021/ac020239t. [DOI] [PubMed] [Google Scholar]
- 19.Culbertson CT, Jacobson SC, Ramsey JM. Anal Chem. 2000;72:5814–5819. doi: 10.1021/ac0006268. [DOI] [PubMed] [Google Scholar]
- 20.Dolnik V, Liu S, Jovanovich S. Electrophoresis. 2000;21:41–45. doi: 10.1002/(SICI)1522-2683(20000101)21:1<41::AID-ELPS41>3.0.CO;2-7. [DOI] [PubMed] [Google Scholar]
- 21.Jacobson SC, Hergenroder R, Koutny LB, Ramsey JM. Anal Chem. 1994;66:1114–1118. [Google Scholar]
- 22.Weigl B, Bardell RL, Cabrera CR. Adv Drug Deliv Rev. 2003;55:349–377. doi: 10.1016/s0169-409x(02)00223-5. [DOI] [PubMed] [Google Scholar]
- 23.Burke BJ, Regnier FE. Anal Chem. 2003;75:1786–1791. doi: 10.1021/ac026173j. [DOI] [PubMed] [Google Scholar]
- 24.Dunne J, Reardon H, Trinh V, Li E, Farinas J. Assay Drug Dev Technol. 2004;2:121–129. doi: 10.1089/154065804323056468. [DOI] [PubMed] [Google Scholar]
- 25.Hadd AG, Jacobson SC, Ramsey JM. Anal Chem. 1999;71:5206–5212. [Google Scholar]
- 26.Emrich CA, Tian H, Medintz IL, Mathies RA. Anal Chem. 2002;74:5076–5083. doi: 10.1021/ac020236g. [DOI] [PubMed] [Google Scholar]
- 27.Xu H, Ewing AG. Electrophoresis. 2005;26:4711–4717. doi: 10.1002/elps.200500620. [DOI] [PMC free article] [PubMed] [Google Scholar]
- 28.Lin S, Fischl AS, Bi X, Parce W. Anal Biochem. 2003;314:97–107. doi: 10.1016/s0003-2697(02)00616-4. [DOI] [PubMed] [Google Scholar]
- 29.Perrin D, Fremaux C, Scheer A. J Biomol Screen. 2006;11:359–368. doi: 10.1177/1087057106286653. [DOI] [PubMed] [Google Scholar]
- 30.Milligan G, Wakelam M. G proteins: signal transduction and disease. Academic Press Limited; San Diego, CA: 1992. [Google Scholar]
- 31.Spiegel AM. J Inherit Metab Dis. 1997;20:113–121. doi: 10.1023/a:1005393501786. [DOI] [PubMed] [Google Scholar]
- 32.Neubig RR. J Pept Res. 2002;60:312–316. doi: 10.1034/j.1399-3011.2002.21064.x. [DOI] [PubMed] [Google Scholar]
- 33.Neubig RR, Siderovski D. Nat Rev. 2002;1:187–197. doi: 10.1038/nrd747. [DOI] [PubMed] [Google Scholar]
- 34.Zhong HL, Neubig RR. J Pharmacol Exp Ther. 2001;297:837–845. [PubMed] [Google Scholar]
- 35.Heximer SP, Knutsen RH, Sun X, Kaltenbronn KM, Rhee MH, Peng N, Oliveira-dos-Santos A, Penninger JM, Muslin AJ, Steinberg TH, Wyss JM, Mecham RP, Blumer kJ. J Clin Invest. 2003;111:1259. doi: 10.1172/JCI200315598A. [DOI] [PMC free article] [PubMed] [Google Scholar]
- 36.Erdely HA, Tamminga CA, Roberts RC, Vogel MW. Synapse. 2006;59:472–479. doi: 10.1002/syn.20265. [DOI] [PubMed] [Google Scholar]
- 37.Traynor JR, Neubig RR. Mol Interv. 2005;5:30–41. doi: 10.1124/mi.5.1.7. [DOI] [PubMed] [Google Scholar]
- 38.Thomsen W, Frazer J, Unett D. Curr Opin Biotechnol. 2005;16:655–665. doi: 10.1016/j.copbio.2005.10.008. [DOI] [PubMed] [Google Scholar]
- 39.Berman DM, Wikie TM, Gilman AG. Cell. 1996;86:445–452. doi: 10.1016/s0092-8674(00)80117-8. [DOI] [PubMed] [Google Scholar]
- 40.Lan K, Zhong H, Nanamori M, Neubig RR. J Biol Chem. 2000;275:33497–33503. doi: 10.1074/jbc.M005785200. [DOI] [PubMed] [Google Scholar]
- 41.Roman DL, Neubig RR. FASEB J. 2005;19:A1099–A1099. [Google Scholar]
- 42.Jin Y, Zhong H, Omnaas JR, Neubig RR, Mosberg HI. J Pept Res. 2004;63:141–146. doi: 10.1111/j.1399-3011.2003.00114.x. [DOI] [PubMed] [Google Scholar]
- 43.Dishinger JF, Kennedy RT. Anal Chem. 2007;79:947–954. doi: 10.1021/ac061425s. [DOI] [PubMed] [Google Scholar]
- 44.Shackman JG, Watson CJ, Kennedy RT. J Chromatogr A. 2004;1040:273–282. doi: 10.1016/j.chroma.2004.04.004. [DOI] [PubMed] [Google Scholar]
- 45.Gilman AG. Annu Rev Biochem. 1987;56:615–649. doi: 10.1146/annurev.bi.56.070187.003151. [DOI] [PubMed] [Google Scholar]
- 46.Linder ME, Ewald DA, Miller RJ, Gilman AG. J Biol Chem. 1990;265:8243–8251. [PubMed] [Google Scholar]
- 47.Roof RA, Jin Y, Roman DL, Sunahara RK, Ishii M, Mosberg HI, Neubig RR. Chem Biol Drug Des. 2006;67:266–274. doi: 10.1111/j.1747-0285.2006.00373.x. [DOI] [PubMed] [Google Scholar]
- 48.Jameson EE, Pei J, Wade SM, Neubig RR, Milligan G, Kennedy RT. Anal Chem. 2007;79:1158–1163. doi: 10.1021/ac061099g. [DOI] [PubMed] [Google Scholar]