

Abstract
Background
Vascular depression has been proposed as a unique diagnostic subtype in late-life yet no study has evaluated whether the specified clinical features associated with the illness are jointly indicative of an underlying diagnostic class.
Methods
We applied latent class analysis to two independent clinical samples: The prospective, cohort design, Neurocognitive Outcomes of Depression in the Elderly (NCODE) study (1) and the eight week, multi-center, double blind, placebo-controlled Old-Old study (2).
Results
A 2-class model consisting of vascular and non-vascular depressed patients provided an excellent fit to the data in both studies, χ2 (6) = 2.02, p = .90, in the NCODE study, and χ2 (6) = 7.024, p = .32, in the Old-Old study. Although all of the proposed features of vascular depression were useful in identifying the illness, deep white matter lesion burden emerged with perfect sensitivity (1.00) and near perfect specificity (.95) making it the only indicator necessary to determine class membership.
Conclusions
These findings, replicated across two independent clinical samples, provide the first support for the internal validity of vascular depression as a subtype of late-life depression.
Vascular depression has been proposed as a unique diagnostic subtype of late-life depression (3–6). The concept initially emerged from the finding that patients with late-onset depression (LOD) had higher rates of cerebrovascular disease as evidence by hyperintensities (HIs) on structural magnetic resonance imaging (MRI) compared to patients with early-onset depression (3, 7–9). It was further observed that patients with LOD and HIs also demonstrated greater neuropsychological impairment, including but not limited to tests of executive dysfunction (ED) (9–12). Based on these observations, it was hypothesized that structural damage to the frontostriatal tracts resulting from ischemic cerebrovascular disease creates a vulnerability to depression in late-life that is characterized by deficits in executive functioning (3).
A number of different definitions for vascular depression and other related syndromes have been proposed in the last decade using different combinations of LOD, ED, and vascular disease as core features (4, 5, 13–15). Despite different definitions, it has been suggested that vascular depression meets criteria for a valid diagnostic subtype based on studies of clinical profile and treatment outcome (5, 13, 16, 17). Sneed, et al. (18) have argued that relying on studies of clinical profile and treatment outcome (i.e., external validity) to determine diagnostic validity is problematic when each study uses different criteria to define the illness, i.e., there is no way of knowing whether the different definitions correspond to multiple diagnostic groups or a single, underlying diagnostic class.
Therefore, the next logical step is to evaluate the internal validity of vascular depression by determining 1) whether a subgroup can be identified among late-life depressed patients that is consistent with the vascular depression hypothesis; and 2) what combination of the core features most accurately identifies this subgroup. This study addresses this next critical step using latent class analysis (LCA) (19, 20), and to evaluate the validity and generalizability of the findings we tested the latent class models across two, independent clinical studies.
Method
Samples
The Neurocognitive Outcomes of Depression in the Elderly (NCODE) study uses a prospective, cohort design to examine neurocognitive outcomes in depressed older adults receiving naturalistic treatment in an outpatient, academic medical setting. All depressed subjects (N=367) met DSM-IV criteria for single episode or recurrent major depression, were at least 60 years of age at baseline enrollment, and had baseline Mini-Mental Status Exam (MMSE) scores of greater than or equal to 25. Participants were excluded if they had another major psychiatric illness, alcohol or drug abuse or dependence, clinically diagnosed primary neurological illness (including dementia), or were taking medications or had a medical illness or physical disability that affected cognitive function.
Of the 367 NCODE study participants, 150 provided baseline data on age-at-onset, a measure of ED, and HI burden. Age-at-onset was assessed using the Diagnostic Interview Schedule. ED was assessed using the Trail Making Test – Part B (Trails B) (21). The Trails B is a complex neuropsychological task involving visual scanning, psychomotor speed, and cognitive flexibility in the form of set shifting (22) and is a frequently used measure of executive functioning (23, 24). T1-weighted and T2-weighted MRI scans were evaluated for the presence of HIs (i.e., deep-white-matter and subcortical gray-matter lesions) using the Coffey modified Fazekas Rating Scale (8). Deep white matter (DW) HIs were defined as abnormalities in the frontal, parietal, temporal, or occipital lobes, and scored as 0 (absent), 1 (punctate foci), 2 (beginning confluence of foci), and 3 (large confluent areas). Subcortical gray matter (SCG) HIs were defined as abnormalities in the caudate nucleus, putamen, globus pallidus, thalamus, and internal capsule, and were scored as 0 (absent), 1 (punctate), 2 (multipunctate), and 3 (diffuse).
The Old-Old study (2) was a large, multi-center, double blind, randomized eight-week trial comparing citalopram to placebo in patients 75 and older (N =174). All depressed subjects (N=174) met DSM-IV criteria for single episode or recurrent major depression, were at least 75 years of age and not living in a residential setting, and had baseline 24-item Hamilton Rating Scale for Depression (HRSD) scores of at least 20. Participants were excluded if they had another major psychiatric illness, current substance abuse or dependence within past year, current suicide intent or serious attempt within past year, dementia, MMSE score ≤ 18, or an acute, severe or unstable medical illness.
Of the 174 Old-Old study participants, 97 provided baseline data on age-at-onset, a measure of ED, and HI burden. Age-at-onset was determined based on information obtained in the baseline SCID interview, medical records, and other sources of historical information. ED was assessed using the Stroop Color-Word Test (25). The Stroop is a complex neuropsychological task tapping attention and the ability to inhibit automatic responses (26) and is a frequently used measure of executive functioning (23, 24, 26). T1-weighted and T2-weighted MRI scans were evaluated for the presence of DW and SCG HIs using the Coffey modified Fazekas Rating Scale and the same definitions of severity used in the NCODE study.
Classification
For the purposes of this study, LOD, ED, HI burden (DW and SCG lesions) were dummy coded (1 = yes, 0 = no) in each sample to reflect the presence or absence of a feature. Participants were classified as LOD if the onset of their first episode of depression occurred after age 50 (3, 5, 11, 27, 28). Participants were classified as having deficits in ED if they scored in the highest quartile of performance within their sample (higher scores indicating greater dysfunction) (29). Participants were classified as having DW or SCG burden if they received a score of 2 or more on their severity rating scales (8). As a result, each data set consisted of four dummy coded, manifest indicators of the vascular depression construct.
Data Analysis
We hypothesized that there are two classes of late-life depressed patients, vascular and non-vascular, and that the diagnostic indicators of interest are imperfect measures of the class to which a patient belongs. LCA generates two types of probabilities that enable the researcher to interpret a given model: Unconditional probabilities provide information regarding the likelihood that a person is in a particular class. Unconditional probabilities are sample specific and of interest only in that they provide estimates of the base rate of the disorder in the population. Conditional probabilities represent the likelihood that an individual belonging to a class will score a certain way on a particular observed feature (30, 31). Thus, conditional probabilities allow us to interpret the meaning of the classes. The conditional probabilities also enable us estimate the sensitivity (i.e., the probability of being positive on an indicator given you have the illness) and specificity (i.e., the probability you are negative on an indicator given you do not have the illness) of a given indicator in the absence of a gold or criterion standard; that is, the conditional probabilities show what would be the sensitivity and specificity of a given indicator if a gold standard (external criterion) existed.
Results
Descriptive Statistics
Descriptive statistics for both the NCODE and Old-Old studies are reported in Table 1 for those who provided both complete and incomplete baseline data on age-at-onset, a measure of ED, and HI burden. Those with complete baseline data in the NCODE and Old-Old study were comparable in many respects. However, although formal statistical tests across samples were not performed, Old-Old study participants (with complete data) were on average older and had higher depression severity ratings than NCODE study participants with complete baseline data. Within sample, there were small differences in the NCODE study between those with and without complete baseline data on education, MMSE, and HRSD. In the Old-Old study, women were overrepresented among those with complete baseline data.
Table 1.
Descriptive statistics for NCODE and Old-Old study participants with complete and incomplete baseline data on age-at-onset, executive dysfunction, and hyperintensity burden.
Latent class analysis
The first step in LCA is to establish that there are relationships among the manifest indicators. In the absence of any relationships, there cannot be distinct latent classes. For the NCODE study data, the test of independence among the four manifest indicators was statistically significant, χ2 (11) = 38.39, p = .0001, indicating there is covariation among the variables that is greater than chance. Next, we tested our primary hypothesis that there are two classes of late-life depressed patients. The likelihood ratio chi-square goodness of fit test for the two class model was 2.02 on 6 degrees of freedom, which is non-significant (p = .90). This indicates that the data are consistent with the model. We can compare the fit of these two models by taking the difference of their likelihood ratio χ2 values where the degrees of freedom will be equal to the difference in the number of parameters between the two models. In this case, the two class model fit significantly better than the independence model, χ2 (11-6=5) = 38.39-2.02 = 36.37, p = .001. [Technical note: Although one might normally test more complex (e.g., 3-class) models, the small chi-square value observed in this analysis indicates that we would not find any improvement in fit. Also, such a model would be underidentified (i.e., not all parameters would be able to be uniquely estimated)].
Table 2 reports the unconditional and conditional probabilities for the final 2-class model. As can be seen from the table, there are two classes of participants in the NCODE study: those who were classified as vascular depression were high on SCG, DW, LOD, and ED (class 2) and those who were classified as non-vascular depression were low on SCG, DW, LOD, and ED (class 1). The unconditional probabilities indicate that the sample is approximately evenly split between the two classes (.51 and .49). The conditional probabilities provide estimates of the sensitivity and specificity of the manifest indicators. The highest sensitivity was for DW (.85), followed by SCG (.65), LOD (.56), and ED (.41), whereas the highest specificity was for ED (.91), followed by DW (.88), SCG (.79), and LOD (.71).
Table 2.
Unconditional and conditional probabilities for final 2-class model, NCODE study data.
| Class 1 | Class 2 | |
|---|---|---|
| Unconditional class probabilities | .51 | .49 |
| Conditional probabilities of manifest indicators, given latent class | ||
| SCG (no) | .79 | .35 |
| SCG (yes) | .21 | .65 |
| DW (no) | .88 | .15 |
| DW (yes) | .12 | .85 |
| LOD (no) | .71 | .44 |
| LOD (yes) | .29 | .56 |
| RI (no) | .91 | .59 |
| RI (yes) | .09 | .41 |
Note. SCG = subcortical hyperintensity burden; DW = deep white matter hyperintensity burden; LOD = late-onset depression; RI = response inhibition component of executive functions. Bold indicates sensitivity and specificity estimates of the manifest indicators.
To replicate these findings, we also applied LCA to data from the Old-Old study. As expected, the complete independence model in this data set also did not provide a good fit to the data, χ2 (11) = 27.18, p = .004. Next, we tested the two class model. The likelihood ratio chi-square goodness of fit test for the two class model was 7.024 on 6 degrees of freedom, which is non-significant (p = .32). As in the NCODE study, the two class model fit significantly better than the independence model, χ2 (11-6=5) = 27.18-7.02=20.16, p = .001.
Table 3 reports the unconditional and conditional probabilities associated with the final two class model for the Old-Old study data. As in the NCODE study, the Old-Old study data yielded two classes of participants: vascular and non-vascular depressed. Those who were classified as having vascular depression scored high on SCG, DW, LOD, and ED and those who were classified as not having vascular depression scored low on SCG, DW, LOD, and ED. Like the NCODE study, participants in the Old-Old study were also approximately evenly split between the two classes (52% vs. 48%). Looking at the conditional probabilities in Table 3, we see a similar pattern to that observed in the NCODE study for DW (sensitivity = 1.00, specificity = .60), SCG (sensitivity = .78, specificity = .87), and ED (sensitivity = .31, specificity = .79). However, the sensitivity of LOD was much higher in the Old-Old study as compared to the NCODE study (.87 versus .56) whereas its specificity was much lower (.20 versus .71).
Table 3.
Unconditional and conditional probabilities for final 2-class model, Old-Old study data.
| Class 1 | Class 2 | |
|---|---|---|
| Unconditional class probabilities | .52 | .48 |
| Conditional probabilities of manifest indicators, given latent class | ||
| SCG (no) | .87 | .22 |
| SCG (yes) | .13 | .78 |
| DW (no) | .60 | .00 |
| DW (yes) | .40 | 1.00 |
| LOD (no) | .20 | .13 |
| LOD (yes) | .80 | .87 |
| RI (no) | .79 | .69 |
| RI (yes) | .21 | .31 |
Note. SCG = subcortical hyperintensity burden; DW = deep white matter hyperintensity burden; LOD = late-onset depression; RI = response inhibition component of executive functions. Bold indicates sensitivity and specificity estimates of the manifest indicators.
These findings suggest that while DW, SCG, and ED function similarly across the studies, LOD functions differently. In the NCODE study, LOD had low sensitivity and moderately high specificity whereas in the Old-Old study, LOD had high sensitivity and low specificity. To test the hypothesis that LOD functions differently across the two studies, we estimated a complete invariance model in which we held constant the relationship between the manifest indicators and the underlying latent classes in the two samples. As expected, this model did not provide a good fit to the data, χ2 (20) = 52.01, p = .0001, indicating that at least one of the manifest indicators functions differently across the two samples.
Next, we tested the hypothesis that it is LOD that functions differently across the samples by allowing the relationship between LOD and the latent classes to vary while holding constant the relationships for the other observed variables. This model provided a good fit to the data, χ2 (18) = 15.60, p = .62. Table 4 reports the unconditional and conditional probabilities associated with the final, two class model that allows LOD to vary across both the NCODE and Old-Old studies. As can be seen from this table, there are two classes of patients, one vascular (class 2) and the other non-vascular depressed (class 1). Across the two, independent clinical samples, DW has perfect sensitivity (1.00) and near perfect specificity (.95), SCG has moderate sensitivity (.61) and somewhat high specificity (.77), and finally, ED has low sensitivity (.33) but high specificity (.84). In Table 4, the average sensitivity and specificity of LOD is reported. The actual values for each sample (data set) are at least approximately the same as in Table 2 and Table 3.
Table 4.
Unconditional and conditional probabilities for final 2-class model allowing only LOD to vary across both the NCODE and Old-Old studies.
| Class 1 | Class 2 | |
|---|---|---|
| Unconditional class probabilities | .47 | .53 |
| Conditional probabilities of manifest indicators, given latent class | ||
| SCG (no) | .77 | .39 |
| SCG (yes) | .23 | .61 |
| DW (no) | .95 | .00 |
| DW (yes) | .05 | 1.00 |
| LOD (no) | .54 | .31 |
| LOD (yes) | .46 | .69 |
| RI (no) | .84 | .66 |
| RI (yes) | .16 | .33 |
Note. SCG = subcortical hyperintensity burden; DW = deep white matter hyperintensity burden; LOD = late-onset depression; RI = response inhibition component of executive functions. Bold indicates sensitivity and specificity estimates of the manifest indicators.
Although the calculation of sensitivity and specificity of the manifest indicators is useful, LCA can also provide guidance regarding the classification of patients as either having or not having vascular depression. To do this, we use the unconditional and conditional probabilities in a formula related to Bayes’ theorem to determine for any pattern of indicators, the probability that a person with that pattern belongs to a particular class. Table 5 reports the observed and expected cell frequencies, the latent class assignment for each response pattern based on the LCA model, and the probability of correct classification.
Table 5.
Latent class assignment for each response pattern based on final, two-class model allowing LOD to vary across NCODE and Old-Old studies.
| Manifest Indicators | Frequencies | |||||||
|---|---|---|---|---|---|---|---|---|
| SCG | DW | LOD | RI | Observed | Expected | Latent Class | p(error) | |
| NCODE | 0 | 0 | 0 | 0 | 36 | 34.48 | Non-VD | .00 |
| 0 | 0 | 0 | 1 | 3 | 6.36 | Non-VD | .00 | |
| 0 | 0 | 1 | 0 | 15 | 16.85 | Non-VD | .00 | |
| 0 | 0 | 1 | 1 | 4 | 3.11 | Non-VD | .00 | |
| 0 | 1 | 0 | 0 | 10 | 9.94 | VD | .19 | |
| 0 | 1 | 0 | 1 | 4 | 4.39 | VD | .08 | |
| 0 | 1 | 1 | 0 | 9 | 10.17 | VD | .09 | |
| 0 | 1 | 1 | 1 | 5 | 4.81 | VD | .03 | |
| 1 | 0 | 0 | 0 | 12 | 10.25 | Non-VD | .00 | |
| 1 | 0 | 0 | 1 | 2 | 1.89 | Non-VD | .00 | |
| 1 | 0 | 1 | 0 | 5 | 5.00 | Non-VD | .00 | |
| 1 | 0 | 1 | 1 | 2 | .92 | Non-VD | .00 | |
| 1 | 1 | 0 | 0 | 13 | 13.23 | VD | .04 | |
| 1 | 1 | 0 | 1 | 7 | 6.46 | VD | .02 | |
| 1 | 1 | 1 | 0 | 13 | 14.80 | VD | .02 | |
| 1 | 1 | 1 | 1 | 10 | 7.33 | VD | .01 | |
| Old-Old | 0 | 0 | 0 | 0 | 3 | 3.92 | Non-VD | .00 |
| 0 | 0 | 0 | 1 | 1 | .72 | Non-VD | .00 | |
| 0 | 0 | 1 | 0 | 18 | 15.70 | Non-VD | .00 | |
| 0 | 0 | 1 | 1 | 4 | 2.89 | Non-VD | .00 | |
| 0 | 1 | 0 | 0 | 3 | 2.72 | VD | .08 | |
| 0 | 1 | 0 | 1 | 2 | 1.29 | VD | .03 | |
| 0 | 1 | 1 | 0 | 18 | 15.26 | VD | .06 | |
| 0 | 1 | 1 | 1 | 5 | 7.38 | VD | .02 | |
| 1 | 0 | 0 | 0 | 1 | 1.16 | Non-VD | .00 | |
| 1 | 0 | 0 | 1 | 1 | .22 | Non-VD | .00 | |
| 1 | 0 | 1 | 0 | 2 | 4.67 | Non-VD | .00 | |
| 1 | 0 | 1 | 1 | 0 | .86 | n/a | n/a | |
| 1 | 1 | 0 | 0 | 2 | 3.99 | VD | .02 | |
| 1 | 1 | 0 | 1 | 3 | 1.98 | VD | .01 | |
| 1 | 1 | 1 | 0 | 25 | 22.86 | VD | .01 | |
| 1 | 1 | 1 | 1 | 9 | 11.38 | VD | .00 | |
Note: SCG = subcortical hyperintensity burden; DW = deep white matter hyperintensity burden; LOD = late-onset depression; RI = response inhibition component of executive functions; 1=”yes” and 0=”no”; Non-VD = non-vascular depression and VD = vascular depression; p(error) = probability of misclassification; n/a indicates zero cell frequency.
As can be seen from Table 5, there is perfect correspondence between being classified as vascular depressed and the presence of DW lesion burden (as it should be since DW has perfect sensitivity and near perfect specificity). This indicates that DW lesion burden is a nearly necessary and sufficient condition to be classified as vascular depressed. However, the highest rate of misclassification occurs when only DW lesion burden is present (i.e., .19 and .08 in the NCODE and Old-Old studies, respectively). Therefore, there is less certainty about diagnosis when DW is inconsistent with the other features. This suggests that while DW lesion burden is necessary to receive a diagnosis of vascular depression, our confidence in the accuracy of the classification increases with the presence of additional indicators.
Discussion
The results of this study provide the first support for the internal validity of vascular depression as a subtype of late-life depression. A subgroup of patients was identified by the presence of DW, SCG, ED, and LOD. Although all of the proposed core features of vascular depression were used to identify the illness, ultimately, only the presence DW lesion burden was necessary to determine class membership. Thus, DW lesion burden emerged as the most accurate indicator of the underlying group. This is reflected by the perfect (1.00) sensitivity and near perfect (.95) specificity of DW for the illness. Importantly, the latent class model was replicated across two independent clinical samples.
Although LOD, SCG, and ED were useful in identifying the illness, they were ultimately unnecessary given the perfect sensitivity and near perfect specificity of DW lesion burden. This reality reflects the nature of the problem under investigation. As with all other psychiatric diagnoses, no gold or criterion standard exists for vascular depression; therefore, it is impossible to evaluate the sensitivity and specificity of a given indicator. LCA, however, gives us the opportunity to assess sensitivity and specificity of indicators in the absence of a gold standard. As a result, the theory underlying a given diagnostic construct must be adequately developed in order to identify a sufficient number of indicators. Once identified, LCA can be used to determine whether the proposed model of the illness is consistent with observed data and the sensitivity and specificity of the indicators assessed. In the present study, DW emerged with perfect sensitivity and near perfect specificity but we would not have been able to determine this without the aid of the other indicators specified by the theory.
ED did not emerge as an essential feature in the classification of patients as vascular depressed. Several factors may contribute to this finding. First, the executive system encompasses a broad range of functions (e.g., planning, organizing, problem solving, & cognitive flexibility) and may be difficult to comprehensively assess (26, 32–34). Although the prefrontal cortex is central to these functions (34), executive tasks activate a diffuse network of brain areas and are better described in terms of process rather than in terms of neuroanatomical location (32). Second, the NCODE and Old-Old studies used two different measures of executive functioning. The NCODE study used the Trails B, a common measure of the executive task of set shifting, whereas the Old-Old study used the Stroop test, a common measure of the executive task of response inhibition. Although these functions are considered to be essential to executive processes (26), including other domains of executive functioning in the LCA might change the findings observed in this report. Importantly, although the Trails B and Stroop test assess different cognitive processes and are largely uncorrelated (24), in the present study they functioned in similar ways with respect to sensitivity and specificity across the two independent clinical samples.
Although ED did not emerge as a defining feature of vascular depression, a recent study showed that only ED (and not LOD or hyperintensity lesion burden) predicted poor treatment response among late-life depressed patients using data from the Old-Old study (35). This raises the possibility that while the presence of DW lesion burden is both necessary and sufficient in identifying the vascular depression subtype, DW lesion burden may not adversely affect antidepressant treatment response unless it is simultaneously associated with ED.
There are a number of possibilities why LOD did not emerge as a reliable indicator of the vascular depression subtype. First, the concept of LOD incorrectly assumes that the etiology of depression in those classified as early-onset is the same in early adulthood as it is in later adulthood when it is distinctly possible that the same person could experience different major depressive episodes at different points in life for very different reasons (36). Second, the classification of patients as LOD is based on patient self-report, which is problematic due to retrospective reporting bias (37). Research suggests that 20% of the critical details associated with personal events are irretrievable after one year, and as much 60% are irretrievable after 5 years (37). This is a remarkable fact when you keep in mind that we are asking older adults to recall and distinguish between syndromal and subsyndromal depression over the course of their entire lives. Given these conceptual and methodological problems, it is not surprising that LOD emerged as an unreliable indicator.
Implications for DSM-V
Although the current study focused on patients with major depressive disorder, it has not been established that the mood disorder associated with DW lesion burden is restricted to major depression. Patients with DW lesion burden may have clinically significant depressive symptomatology but not meet criteria for any mood disorder recognized in DSM-IV. Patients with DW lesion burden might also present with cognitive deficits, falls, gait disturbance, and urinary incontinence without depressed mood or anhedonia (16, 38). Thus, vascular depression may be viewed as part of a larger category of cerebral white matter lesion syndrome in which patients may or may not present with depressive symptomatology (16, 38). In attempting to establish a new diagnosis, we should not be bound by the current classification system.
The method used in this study also has important implications for the process of establishing valid diagnoses. Sneed et al (18) articulated the psychometric approach to diagnostic validity (39–41), which is represented in Figure 1. According to this approach, the first step in establishing diagnostic validity is the specification of a theory. Given a specified theoretical model, the next step is to evaluate internal validity, which becomes the focus of attention “whenever no criterion or universe of content is accepted as entirely adequate to define the quality to be measured” (p. 282) (42). In the absence of a gold or criterion standard, it must be shown that the proposed features of the illness identify an unobserved (inferred) construct that represents the theoretically specified diagnostic subgroup. This study represents the first evidence of this kind for vascular depression. Given sufficient evidence of internal validity, which includes replication across different samples as in this study, the next and final step in the validation process is to examine external validity, i.e., clinical presentation, treatment outcome, and developmental course (43). Thus, studies of internal validity serve as a critical starting point but cannot serve as an endpoint in the process of establishing diagnostic validity (36).
Figure 1.
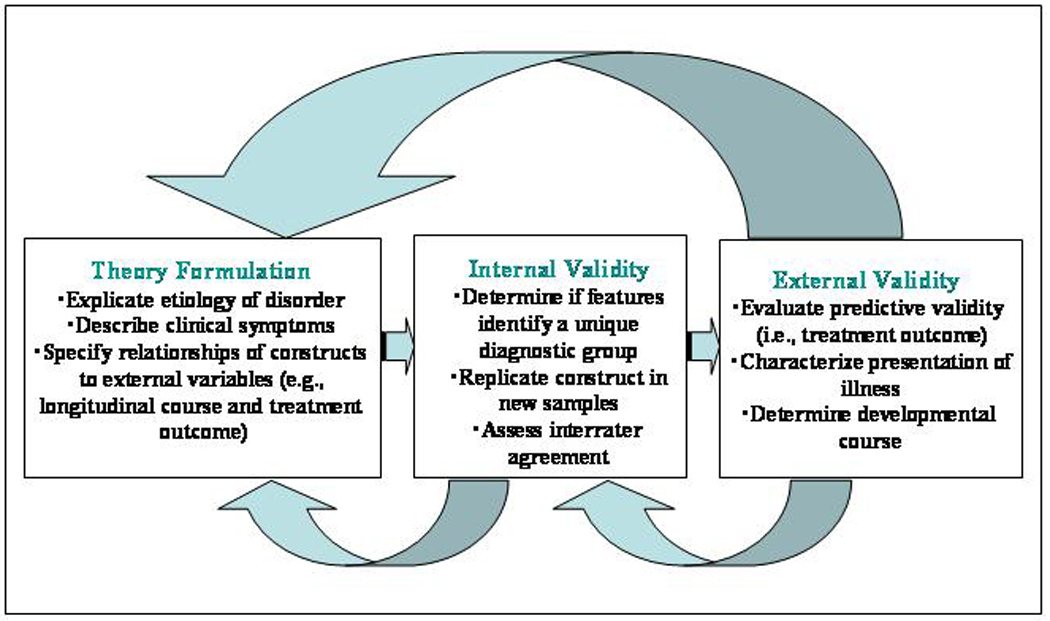
A construct validation framework for psychiatric classification. Adapted from “Toward the integration of classification theory and methods,” by Harvey A. Skinner, 1981, Journal of Abnormal Psychology, 90, p. 70. Copyright 1981 by the American Psychological Association.
The statistical models that were used to evaluate the internal validity of vascular depression required certain assumptions that place limits on our ability to discern the “truth” about the construct. First, we took as given that the observed variables would be dichotomized and at what point they would be dichotomized. Each could be questioned, but we were investigating the latent structure that could be inferred if the current definitions of these variables were correct. It would be of interest to investigate the issue of whether these variables should be dichotomized, and if so, at what point in future research. We also assumed that the underlying structure of vascular depression is categorical rather than continuous. This is consistent with the hypothesis that vascular depression is a subtype of late-life depression. However, it is possible that the underlying structure of vascular depression is continuous, which deserves further research and requires different statistical models such as taxometrics (44). However, the application of taxometrics to clinical studies is often precluded because of the statistical requirements of the model such as very large sample sizes, a sufficient number of manifest indicators, and correlations among these indicators that are large enough to be able to separate the putative taxon and complement class in order to detect the taxonic boundary should it exist (44).
Limitations
First, there is no consensus regarding how LOD should be defined. While most have used an age threshold of 50 years (3, 5, 11, 27, 28), others have used an age threshold of 60 years (9, 45) or even 65 years (12). In the present study, it is possible that using different cutoffs would have yielded different results. Second, small differences were observed between those with and without complete baseline data (see Table 1). However, these differences only affect the unconditional probabilities of the LCA and not the conditional probabilities, which are our primary interest. The conditional probabilities tell us the probability of being positive on a given indicator given latent class, and this is independent of the rate of the illness in the sample. Third, we were unable to examine the additive influence of certain clinical features that have been associated with vascular depression (e.g., psychomotor retardation, family history of mental illness) as these variables were not available across both studies. However, because different definitions of vascular depression have been used to study clinical presentation (13, 15), it is unclear whether the features that have been identified are in fact part of the vascular depression syndrome (18).
Conclusion
This study provides the first support for the internal validity of vascular depression as a subtype of late-life depression. The application of a systematic, empirically-grounded, psychometric approach to diagnostic validity may substantially improve on previous efforts that relied primarily on expert consensus. In fact, vascular depression may serve as a prototype for the DSM-V in that the criteria for the diagnosis are based on both phenomenology (symptoms of major depressive disorder) and laboratory tests (e.g., DW lesion burden on MRI), and the method of establishing diagnostic validity is based on evidence of both internal and external validity.
Acknowledgments
This research was supported by National Institute of Mental health grants P50 MH60451 (PI: R. Krishnan), R01 MH-54846 (PI: D. Steffens), K23 MH70056 (PI: J. Sneed), and K24 MH70027 (PI: D Steffens), and a grant from Forest Laboratories (PI: S. P. Roose). The authors wish to acknowledge James M. Provenzale, M,D., Division of Neuroradiology, Duke University Medical Center, for his assignment of lesion ratings. We would also like to thank George Alexopoulos for his comments and suggestions on an earlier draft of this paper delivered to the Department of Geriatric Psychiatry, Weill Cornell Medical College, June 4th, 2007.
Footnotes
Publisher's Disclaimer: This is a PDF file of an unedited manuscript that has been accepted for publication. As a service to our customers we are providing this early version of the manuscript. The manuscript will undergo copyediting, typesetting, and review of the resulting proof before it is published in its final citable form. Please note that during the production process errors may be discovered which could affect the content, and all legal disclaimers that apply to the journal pertain.
Financial Disclosure
The authors reported no biomedical financial interests or potential conflicts of interest.
Contributor Information
Joel R. Sneed, Queens College, City University of New York, Columbia University and the New York State Psychiatric Institute
David Rindskopf, The Graduate Center, City University of New York
David C. Steffens, Duke University
K. Ranga Rama Krishnan, Duke University
Steven P. Roose, Columbia University and the New York State Psychiatric Institute
References
- 1.Steffens DC, Welsh-Bohmer KA, Burke JR, Plassman BL, Beyer JL, Gersing KR, Potter GG. Methodology and preliminary results from the Neurocognitive Outcomes of Depression in the Elderly (NCODE) study. Journal of Geriatric Psychiatry and Neurology. 2004;17:202–211. doi: 10.1177/0891988704269819. [DOI] [PubMed] [Google Scholar]
- 2.Roose SP, Sackeim HA, Krishnan KRR, Pollock BG, Alexopoulos G, Lavretsky MK, I, Hakkarainen RH. Antidepressant pharmacotherapy in the treatment of depression in the very old: A randomized, placebo-controlled trial. American Journal of Psychiatry. 2004;161(11):2050–2059. doi: 10.1176/appi.ajp.161.11.2050. [DOI] [PubMed] [Google Scholar]
- 3.Hickie I, Scott E, Mitchell P, Wilhelm K, Austin MP, Bennett B. Subcortical hyperintensities on magnetic resonance imaging: Clinical correlates and prognostic significance in patients with severe depression. Biological Psychiatry. 1995;37:151–160. doi: 10.1016/0006-3223(94)00174-2. [DOI] [PubMed] [Google Scholar]
- 4.Alexopoulos GS, Meyers BS, Young RC, Campbell S, Silbersweig D, Charlson M. 'Vascular depression' hypothesis. Archives of General Psychiatry. 1997;54(10):915–922. doi: 10.1001/archpsyc.1997.01830220033006. [see comment] [DOI] [PubMed] [Google Scholar]
- 5.Steffens DC, Krishnan KR. Structural neuroimaging and mood disorders: recent findings, implications for classification, and future directions. Biological Psychiatry. 1998;43(10):705–712. doi: 10.1016/s0006-3223(98)00084-5. [DOI] [PubMed] [Google Scholar]
- 6.Krishnan KR, McDonald WM. Arteriosclerotic Depression. Medical Hypotheses. 1995;44:111–115. doi: 10.1016/0306-9877(95)90081-0. [DOI] [PubMed] [Google Scholar]
- 7.Fujikawa T, Yamawaki S, Touhouda Y. Incidence of silent cerebral infarction in patients with major depression. Stroke. 1993;24:1631–1634. doi: 10.1161/01.str.24.11.1631. [DOI] [PubMed] [Google Scholar]
- 8.Krishnan KR, Hays JC, Blazer DG. MRI-defined vascular depression. American Journal of Psychiatry. 1997;154(4):497–501. doi: 10.1176/ajp.154.4.497. [DOI] [PubMed] [Google Scholar]
- 9.Salloway S, Malloy P, Kohn R, Gillard E, Duffy J, Rogg J, Tung G, Richardson E, Thomas C, Westlake R. MRI and neuropsychological differences in early- and late-life-onset geriatric depression. Neurology. 1996;46(6):1567–1574. doi: 10.1212/wnl.46.6.1567. [DOI] [PubMed] [Google Scholar]
- 10.Lesser IM, Hill-Gutierrez E, Miller RL, Boone KB. Late-onset depression with white matter lesions. Psychosomatics. 1993;34:364–367. doi: 10.1016/S0033-3182(93)71872-1. [DOI] [PubMed] [Google Scholar]
- 11.Lesser I, Boone K, Mehringer C, Wohl M, Miller B, Berman N. Cognition and white matter hyperintensities in older depressed patients. American Journal of Psychiatry. 1996;153(10):1280–1287. doi: 10.1176/ajp.153.10.1280. [DOI] [PubMed] [Google Scholar]
- 12.Alexopoulos GS, Meyers BS, Young RC, Kakuma T, Silbersweig D, Charlson M. Clinically defined vascular depression. American Journal of Psychiatry. 1997;154(4):562–565. doi: 10.1176/ajp.154.4.562. [DOI] [PubMed] [Google Scholar]
- 13.Krishnan KR, Taylor WD, McQuoid DR, MacFall JR, Payne ME, Provenzale JM, Steffens DC. Clinical characteristics of magnetic resonance imaging-defined subcortical ischemic depression. Biological Psychiatry. 2004;55(4):390–397. doi: 10.1016/j.biopsych.2003.08.014. [DOI] [PubMed] [Google Scholar]
- 14.Alexopoulos GS. "The depression-executive dysfunction syndrome of late life": a specific target for D3 agonists? American Journal of Geriatric Psychiatry. 2001;9(1):22–29. [PubMed] [Google Scholar]
- 15.Alexopoulos GS, Kiosses DN, Klimstra S, Kalayam B, Bruce ML. Clinical presentation of the "depression-executive dysfunction syndrome" of late life. American Journal of Geriatric Psychiatry. 2002;10(1):98–106. [PubMed] [Google Scholar]
- 16.Taylor WD, Steffens DC, Krishnan KR. Psychiatric disease in the twenty-first century: The case for subcortical ischemic depression. Biological Psychiatry. 2006;60:1299–1303. doi: 10.1016/j.biopsych.2006.05.028. [DOI] [PubMed] [Google Scholar]
- 17.Roman G. An archetypal neuropsychiatric disorder. Biological Psychiatry. 2006;60:1306–1308. doi: 10.1016/j.biopsych.2006.09.005. [DOI] [PubMed] [Google Scholar]
- 18.Sneed JR, Roose SP, Sackeim HA. Vascular depression: A distinct diagnostic entity? Biological Psychiatry. 2006;60:1295–1298. doi: 10.1016/j.biopsych.2006.06.018. [DOI] [PubMed] [Google Scholar]
- 19.McCutcheon AL. Latent Class Analysis. Newbury Park, CA: Sage Publications; 1987. [Google Scholar]
- 20.Lazarsfield PF, Henry NW. Latent Structure Analysis. Boston: Houghton Mifflin; 1968. [Google Scholar]
- 21.Reitan RM. Validity of the Trail Making Test as an indicator of organic brain damage. Perceptual Motor Skills. 1958;8:271–276. [Google Scholar]
- 22.Kortte K, Horner M, Windham W. The Trail Making Test, part B: Cognitive flexibility or ability to maintain set? Applied Neuropsychology. 2002;9:106–109. doi: 10.1207/S15324826AN0902_5. [DOI] [PubMed] [Google Scholar]
- 23.Gunning-Dixon F, Raz N. The cognitive correlates of white matter abnormalities in normal aging: A quantitative review. Neuropsychology. 2000;14:224–232. doi: 10.1037//0894-4105.14.2.224. [DOI] [PubMed] [Google Scholar]
- 24.Chaytor N, Schmitter-Edgecomb M, Burr R. Improving the ecological validity of executive functioning assessment. Archives of Clinical Neuropsychology. 2006;21:217–227. doi: 10.1016/j.acn.2005.12.002. [DOI] [PubMed] [Google Scholar]
- 25.Golden CJ. The Stroop Color and Word test: A manual for clinical and experimental use. Wood Dale, IL: Stoelting; 1978. [Google Scholar]
- 26.Miyake A, Freidman NP, Emerson MJ, Witzki AA, Howerter A. The unity and diversity of executive functions and their contributions to complex "frontal lobe" tasks: A latent variable analysis. Cognitive Psychology. 2000;41:49–100. doi: 10.1006/cogp.1999.0734. [DOI] [PubMed] [Google Scholar]
- 27.Baldwin R, Jeffries S, Jackson A, Sutcliffe C, Thacker N, Scott M, Burns A. Treatment response in late-onset depression: relationship to neuropsychological, neuroradiological and vascular risk factors. Psychological Medicine. 2004;34(1):125–136. doi: 10.1017/s0033291703008870. [DOI] [PubMed] [Google Scholar]
- 28.Krishnan KRR, Hays JC, Tupler LA, George LK, Blazer DG. Clinical and phenomenological comparisons of late-onset and early-onset depression. American Journal of Psychiatry. 1995;152:785–788. doi: 10.1176/ajp.152.5.785. [DOI] [PubMed] [Google Scholar]
- 29.Alexopoulos G, Kiosses DN, M H, Murphy CF, Shanmugham B, Gunning-Dixon F. Executive dysfunction and the course of geriatric depression. Biological Psychiatry. 2005;58:204–210. doi: 10.1016/j.biopsych.2005.04.024. [DOI] [PubMed] [Google Scholar]
- 30.Rindskopf D. Using latent class models to test developmental research. Developmental Review. 1987;7:66–85. [Google Scholar]
- 31.Rindskopf D, Rindskopf W. The value of latent class analysis in medical diagnosis. Statistics in Medicine. 1986;5:21–27. doi: 10.1002/sim.4780050105. [DOI] [PubMed] [Google Scholar]
- 32.Garavan H, Ross TJ, Li SJ, Stein EA. A parametric manipulation of central executive functioning. Cerebral Cortex. 2000;10:585–592. doi: 10.1093/cercor/10.6.585. [DOI] [PubMed] [Google Scholar]
- 33.Podell K, Lovell MR. In: Neuropsychological assessment, in Textbook of Geriatric Neuropsychiatry. Coffey CE, Cummings JL, editors. Washington, DC: American Psychiatric Press; 2000. [Google Scholar]
- 34.Gunning-Dixon F, Raz N. Neuroanatomical correlates of selected executive functions in middle-aged and older adults: A prospective MRI study. Neuropsychologia. 2003;41:1929–1941. doi: 10.1016/s0028-3932(03)00129-5. [DOI] [PubMed] [Google Scholar]
- 35.Sneed JR, Roose SP, Keilp JG, Krishnan KRR, Alexopoulos GS, Sackeim HA. Response inhibition predicts poor antidepressant treatment response in very old depressed patients. American Journal of Geriatric Psychiatry. 2007;15:553–563. doi: 10.1097/JGP.0b013e3180302513. [DOI] [PubMed] [Google Scholar]
- 36.Alexopoulos GS. The vascular depression hypothesis: 10 years later. Biological Psychiatry. 2006;60:1304–1305. doi: 10.1016/j.biopsych.2006.09.006. [DOI] [PubMed] [Google Scholar]
- 37.Bradburn NM, Rips LJ, Shevell SK. Answering autobiographical questions: The impact of memory and inference on surveys. Science. 1987;236:157–161. doi: 10.1126/science.3563494. [DOI] [PubMed] [Google Scholar]
- 38.Kuo HK, Lipsitz LA. Cerebral white matter changes and geriatric syndromes: Is there a link? Journals of Gerontology. 2004;59A:818–826. doi: 10.1093/gerona/59.8.m818. [DOI] [PubMed] [Google Scholar]
- 39.Young MA, Scheftner WA, Klerman GL, Andreasen NC, Hirschfeld RMA. The endogenous sub-type of depression: A study of its internal construct validity. British Journal of Psychiatry. 1986;148:257–267. doi: 10.1192/bjp.148.3.257. [DOI] [PubMed] [Google Scholar]
- 40.Young MA. Evaluating diagnostic criteria: A latent class paradigm. Journal of Psychiatric Research. 1983;17:285–296. doi: 10.1016/0022-3956(82)90007-3. [DOI] [PubMed] [Google Scholar]
- 41.Skinner HA. Toward the integration of classification theory and methods. Journal of Abnormal Psychology. 1981;90:68–87. doi: 10.1037//0021-843x.90.1.68. [DOI] [PubMed] [Google Scholar]
- 42.Cronbach LJ, Meehl PE. Construct validity in psychological tests. Psychological Bulletin. 1955;52:281–302. doi: 10.1037/h0040957. [DOI] [PubMed] [Google Scholar]
- 43.Robins E, Guze SB. Establishment of diagnostic validity in psychiatric illness: Its application to schizophrenia. American Journal of Psychiatry. 1970;126:107–111. doi: 10.1176/ajp.126.7.983. [DOI] [PubMed] [Google Scholar]
- 44.Ruscio J, Ruscio AM. Clarifying boundary issues in psychopathology: The role of taxometrics in a comprehensive program of structural research. Journal of Abnormal Psychology. 2004;113:24–38. doi: 10.1037/0021-843X.113.1.24. [DOI] [PubMed] [Google Scholar]
- 45.Van den Berg MD, Oldehinkel AJ, Bouhuys AL, Brilman EI, Beekman AT, Ormel J. Depression in later life: three etiologically different subgroups. Journal of Affective Disorders. 2001;65(1):19–26. doi: 10.1016/s0165-0327(00)00263-9. [DOI] [PubMed] [Google Scholar]