Abstract
Two different phosphonic acid monolayer films for immobilization of bioactive molecules like the protein BMP-2 on titanium surfaces have been prepared. Monolayers of (11-hydroxyundecyl)phosphonic acid and (12-carboxydodecyl)phosphonic acid molecules were produced by a simple dipping process (the T-BAG method). The terminal functional groups on these monolayers were activated (carbonyl diimidazole for hydroxyl groups and N-hydroxysuccinimide for carboxyl groups) to bind amine containing molecules. The reactivity of the surfaces was investigated using trifluoroethylamine hydrochloride and BMP-2. Each step of the surface modification procedure was characterized by X-ray photoelectron spectroscopy (XPS) and time-of-flight secondary ion mass spectroscopy (ToF-SIMS).
Introduction
The important factor for the success of an implanted biomaterial is its surface properties, because the first interactions between the material and the biological environment occur at the surface upon implantation. The first processes that can impact the long time stability of an implant (protein adsorption, cell-surface interaction, tissue development, etc.) are affected by the physical, chemical and biochemical properties of the implant surface.1 Thus, there is an increasing interest to improve the cell-material interactions of biomaterials by tailoring their surface properties. Initially chosen because of their good mechanical properties, titanium and its alloys have a successful history as orthopedic and dental implants. The native thin surface titanium oxide film gives the metal a general inertness and biocompatibility, allowing it to readily heal into bone. However, a true adhesion of the bone to the metal is not observed.2 For titanium and its alloys there are numerous publications about tailoring the surface properties of the metal. Most approaches report the functionalization with self-assembled monolayers (SAMs) of silanes. These are then further functionalized with cell adhesive peptides (e.g., RGD3–5 or bone morphogenetic proteins (BMPs)6) to render the surface bioactive. Recently phosphonic acid molecules were introduced for SAM formation on titanium surfaces.7–9 Advantages of these monolayers compared to silane SAMs are a higher hydrolytic stability under physiological conditions and the fact that no surface conditioning (i.e., acid treatment) is required to obtain high coverage,10–12 which is especially important for coating medical devices. SCHWARTZ et al. developed the simple but effective T-BAG method to immobilize highly stable and ordered monolayer films of phosphonic acids onto the surfaces of titanium and its alloys.13,12 Furthermore, the authors have employed phosphonate SAMs to immobilize RGD peptides to these surfaces.14–16 However, the RGD sequence only leads to unspecific enhanced cell attachment.17 The goal of our studies is to increase the initial osseointegration of orthopedic implants after the operation to prevent an aseptic loosening. A promising candidate for this approach is the protein BMP-2 since it effects the differentiation of mesenchymal cells into osteoblasts and therefore leads to enhanced local bone growth.18 The few existing studies of surface immobilized BMP-2 already showed that the immobilized protein increased the metal bone contact and is more efficient compared to soluble BMP-2 doses.19,20 The protocol to immobilize peptides like RGD usually involves maleimide chemistry binding a cysteine residue of the peptide sequence.3–5 However, the 7 cysteine residues of the BMP-2 monomer are engaged in 6 intramolecular disulfide bonds and in one intermolecular disulfide bond forming the holoprotein.6 Thus no cysteine residue is available for this type of binding chemistry, so coupling BMP-2 to a surface is usually done employing the amino groups of the protein.6,20
In this study two different methods to bind proteins like BMP-2 to titanium surfaces were investigated. Both involve the use of stable phosphonic acid monolayers. The first approach uses immobilization of (11-hydroxyundecyl)phosphonic acid to the metal surface. This surface is then activated for protein binding with carbonyldiimidazole chemistry. The second approach uses immobilization of (12-carboxydodecyl)phosphonic acid to the metal surface. This surface is then activated with N-hydroxysuccinimide. The reactivity of these surfaces was tested with the fluorine-tagged molecule trifluoroethylamine hydrochloride. This reagent is soluble in buffer and can be immobilized onto the surface under the same conditions as a protein. X-ray photoelectron spectroscopy (XPS) and time-of-flight secondary ion mass spectroscopy (ToF-SIMS) were used to characterize the chemistry and structure of each surface modification steps. The first experiments to immobilize BMP-2 to the surfaces were also done.
Materials and methods
Materials
All solvents were dried and distilled using standard procedures.21 11-bromoundecanol (Aldrich), acetyl chloride (p.a.), 12-bromododecanoic acid (Aldrich) N-hydroxysuccinimide (NHS, Aldrich) N-(3-dimethylaminopropyl)-N-ethylcarbodiimide hydrochloride (EDC, Aldrich), N,N’-carbonyldiimidazole (CDI, Aldrich) and trifluoroethylamine hydrochloride (TFEA, Aldrich) were used as received. Triethylamine (Fluka) was dried over calcium hydride and distilled. Triethyl phosphite (Fluka) was dried over sodium and distilled under reduced pressure. (11-Hydroxyundecyl)phosphonic acid was synthesized according to the literature.22 The synthetic route published in [23] was modified to synthesize (12-carboxydodecyl)phosphonic. Briefly, starting with 12-bromododecanoic acid the carboxylic acid group was protected through the formation of an ethyl ether by refluxing in ethanol with the addition of concentrated sulfuric acid.24 The resulting ester was phosphonated with triethyl phosphite in an Arbuzov reaction. The phosphonated species was hydrolyzed and deprotected by refluxing in concentrated HCl solution as described for (11-hydroxyundecyl)phosphonic acid.22
Squares of Ti90/Al6/V4 (25×25mm2) (Goodfellow) were cut into 10×10mm2 pieces and polished as previously reported.25 Subsequently they were rinsed and sonicated with dichloromethane, acetone and methanol, dried in a stream of nitrogen and stored in an oven at 120°C. Before use the substates were sonicated in 5% RBS-35 detergent solution (Pierce), three times in Millipore water, twice in acetone, and twice in methanol 10 minutes each and dried in a stream of nitrogen.
Immobilization of (11-hydroxyundecyl)phosphonic acid and (12-carboxydodecyl) phosphonic acid onto Ti-6Al-4V-Surfaces
The immobilization was done with the T-BAG method according to SCHWARTZ et al.12 Squares of Ti-6Al-4V foil were hung vertically in a solution of (11-hydroxyundecyl)phosphonic acid or (12-carboxydodecyl)phosphonic acid (1 mM) in dry tetrahydrofuran and the solvent was slowly evaporated. The squares were heated in an oven at 120°C for 63 h and then rinsed under sonication. Squares with hydroxyundecyl phosphonic acid were rinsed with tetrahydrofuran and methanol and squares with carboxydodecyl phosphonic acid with tetrahydrofuran.
Activation of the (11-hydroxyundecyl)phosphonic acid monolayer
For the activation of the hydroxyl terminated surfaces a 0.3 M CDI solution in dry dioxane was prepared. The samples were immersed in the solution for 15 hours. After removal from solution they were rinsed twice for 10 minutes in dry dioxane under sonication and dried in a stream of nitrogen.
Activation of the (12-carboxydodecyl)phosphonic acid monolayer
For the activation of the carboxyl terminated surfaces a 1:1 mixture of 0.4 M EDC and 0.1 M NHS in Millipore water was prepared. The samples were immersed in the solution for 45 minutes. After removal from solution they were rinsed with Millipore water and dried in a stream of nitrogen.26
Reactivity test of the activated monolayers
The activity of the surfaces was tested using trifluoroethylamine (TFEA) hydrochloride (similar to [27]). The activated samples were immersed in a 0.1 M solution of TFEA in phosphate buffered saline (PBS, pH=7.4) while shaking for 15 h at room temperature. After removal from the solution they were washed twice 15 minutes in PBS under shaking, 15 minutes in PBS and 5 minutes in Millipore water under sonication. They were dried in a stream of nitrogen.
Immobilization of BMP-2
The activated titanium samples were covered with a solution of recombinant human BMP-2, or MES-buffer for negative control reactions, and left overnight at 4 °C under gentle shaking for coupling.28 After eight washings with 0.125 M sodium tetraborate buffer (pH=10.0) containing 0.066 % (w/v) sodium dodecyl sulfate, the plates were washed once with PBS. Bound BMP-2 was detected subsequently by an indirect enzyme-linked immunosorbent assay (ELISA). For that purpose non-specific protein binding sites were blocked by another overnight incubation with 10 % (v/v) fetal calf serum in PBS (“10 % FCS”). All plates were washed with three times with TTBS (0.1 % (w/v) Tween-20 in tris-buffered saline). Then, monoclonal mouse anti-human BMP-2 antibody was added (diluted 1: 100 in 10 % FCS: R & D, cat.no. MAB3551, 250 µl/ well) and incubated 1 h at 37 °C. After washing five times with TTBS, goat-anti-mouse antibody, peroxidase-conjugate, was added, incubated 1 h at 37 °C, then washed again to remove any unbound antibody. Detection was performed with 3,3′,5,5′-tetramethylbenzidine (TMB Plus; KemEnTec, ready-to-use substrate,cat.no. 4390A) solution (250 µl/ well), developed for 1 h at room temperature in the dark, and stopped with 2 M sulphuric acid (50 µl/ well). Absorbance was read at 450 nm versus 620 nm after removal of 2× 100 µl aliquots into a 96-well plate.
XPS Analysis
XPS measurements were obtained using a Kratos AXIS Ultra DLD instrument equipped with a monochromatized Al Kα X-ray source. Compositional survey and detail scans (P2p, C1s, N1s, O1s, and F1s) were acquired using a pass energy of 80 eV. High-resolution spectra (C1s and O1s) were obtained using a pass energy of 20 eV. All spectra were taken at a 0° take-off angle unless otherwise noted. (Take-off angle is defined as the angle of the analyzer lens with respect to surface normal. Therefore at a 0° take off angle the analyzer is directly above the sample, while at a 70° angle the analyzer is at a glancing angle to the sample.) For the high-resolution spectra, peak binding energies were referenced to the C1s (C-C/C-H) peak at 285.0 eV. Three spots on two or more replicates of each sample were analyzed. The compositional data are averages of the values determined at each spot. Data analysis was performed with the Vision2 software.
ToF-SIMS Analysis
ToF-SIMS spectra were acquired on a Physical Electronics PHI 7200 time-of flight spectrometer using an 8 keV Cs+ primary ion source in the pulsed mode. Spectra were acquired for both positive and negative secondary ions over a mass range of (m/z) 0–1000. The area of analysis for each spectrum was 100 µm × 100 µm, and the total ion dose was maintained < 1 × 10¹² ions/cm2. The mass resolutions (m/Δm) were typically 6500 for the positive ions at m/z=27 (C2H3+) and 4000 for the negative spectra at m/z=25 (C2H−). Three spots on three replicates of each sample were examined. Positive ion spectra were calibrated using the CH3+, C2H3+, C3H5+ and C6H9+ peaks, and negative ion spectra were calibrated using the CH−, C2H−, OH−, PO3− and TiPO4− peaks. Calibration errors were kept below 10 ppm.
Results and discussion
XPS measurements of the monolayer formation
(11-Hydroxy-undecyl)phosphonic acid and (12-carboxydodecyl)phosphonic acid were assembled onto a polished and freshly solvent cleaned Ti90/Al6/V4 substrate using the T-BAG method. The substrate and the bulk powders were measured as references.
Composition
The chemical composition of the polished Ti90/Al6/V4 substrate is listed in table 1. Beside the Ti and O expected from the titanium substrate, the usual C contamination along with N, P and sometimes Pb contaminants were detected. The carbon contamination is always observed for samples exposed to air.8 The presence of N, P and Pb contamination is in agreement with literature data for polished and solvent cleaned titanium samples.9,29–31
Table 1.
XPS determined elemental composition (at.%) of the Ti90/Al6/V4 substrate after polishing and solvent cleaning.
| C 1s | O 1s | P 2p | N 1s | Ti 2p |
|---|---|---|---|---|
| 20.4±1.5 | 57.4±1.4 | 0.2±0.1 | 0.5±0.1 | 21.4±0.4 |
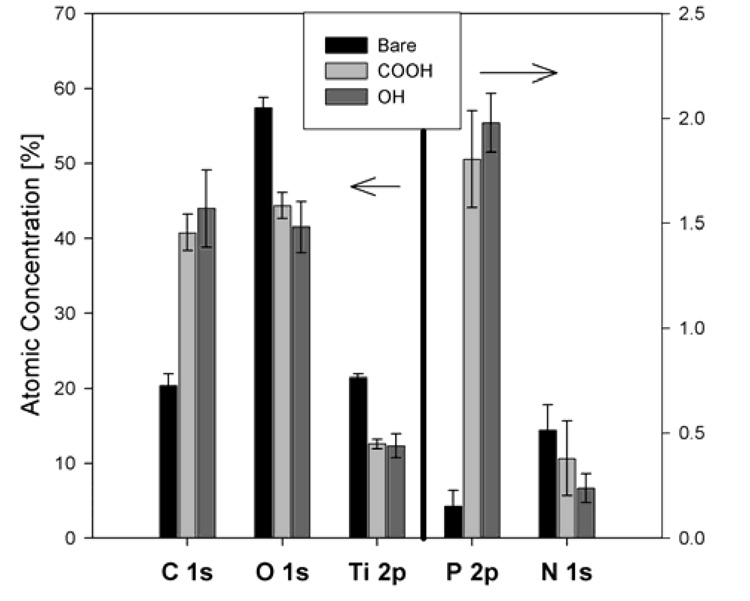
The XPS determined elemental compositions for the phosphonate coated samples showed increased carbon and phosphorus atomic percentages compared to the bare substrate, as expected. The titanium and oxygen signals from the substrate as well as the nitrogen contamination signal decreased compared to the bare substrate (see Figure 1).
Figure 1.
XPS determined atomic compositions of the titanium substrate, the carboxy (COOH) terminated monolayer and the hydroxy (OH) terminated monolayer.
The compositions of the monolayers are comparable with those reported by Hofer et al. for dodecyl phosphate and 12-hydroxy dodecyl phosphate on metal oxide surfaces,32 indicating similar monolayer assemblies were achieved. The XPS measured compositions of the bulk powder of (11-hydroxyundecyl)phosphonic acid and (12-carboxydodecyl)phosphonic acid are shown in Table 2 along with the compositions of the monolayers (without the TiO2 contribution) and their expected theoretical values.
Table 2.
XPS determined elemental compositions (at.%) of the (11-hydroxyundecyl)phosphonic acid and (12-carboxydodecyl)phosphonic acid bulk powders, and their monolayers on Ti90/Al6/V4. The TiO2 contributions have been subtracted from these values and the remaining concentrations renormalized to 100%.
| C 1s | O 1s | P 2p | N 1s | Cl 2p | C/P | |
|---|---|---|---|---|---|---|
| OH Powder | 75.7±0.5 | 19.6±0.6 | 3.7±0.1 | 0.9±0.1 | 20.5 | |
| OH monolayer | 69.8±3.0 | 27.0±2.6 | 3.2±0.5 | 0.4±0.1 | 21.8 | |
| Expected | 68.7 | 25.0 | 6.3 | 10.9 | ||
| COOH Powder | 74.0±1.5 | 22.5±1.3 | 2.9±0.0 | 0.6±0.1 | 25.5 | |
| COOH monolayer | 65.9±2.4 | 31.3±2.1 | 2.9±0.4 | 0.6±0.3 | 22.7 | |
| Expected | 66.7 | 27.8 | 5.6 | 11.9 | ||
For both phosphonate molecules the carbon, oxygen and phosphorus contents of the powder and monolayer samples were close to the expected values. Furthermore a small amount of chlorine contamination was detected in the powder. The phosphorus content was lower than expected and in some cases the carbon content higher than expected. The higher carbon content is attributed to hydrocarbon contamination. The chlorine is a residue from the last synthesis step of the phosphonic acids. Both contaminants are not expected to interfere with the monolayer formation, because they do not have a high affinity to the titanium surface and therefore should remain in solution upon assembly. The carbon to phosphorus ratio of powder and monolayer agree well with each other for both phosphonate molecules.
High resolution
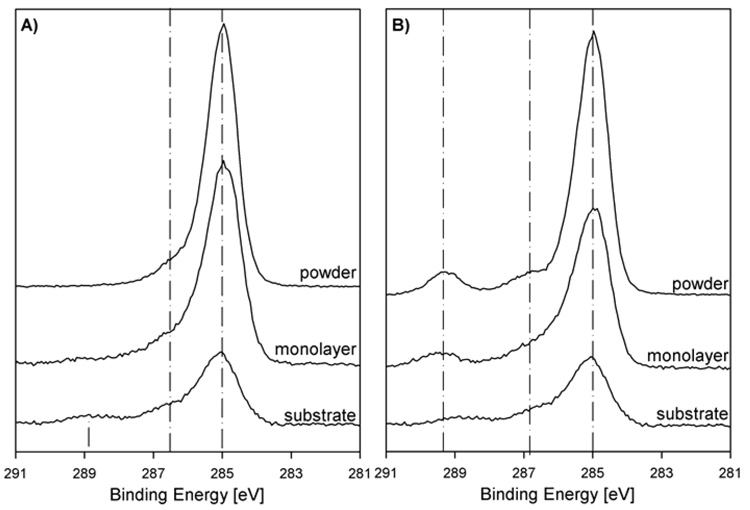
The C 1s high resolution spectra of the assembled monolayers along with the substrate and the respective bulk powder are shown in Figure 2.
Figure 2.
High Resolution XPS C 1s spectra of A) the hydroxyl and B) the carboxyl terminated monolayers compared to the titanium substrate and the respective powders.
The spectrum of the (11-hydroxyundecyl)phosphonic acid powder (Figure 2A) was fit with two contributions, one peak at 285.0 eV (85.9 % ± 3.0 %; fwhm 1.1 eV) and a second broader peak at 286.2 eV (14.1 % ± 3.0 %; fwhm 1.5 eV). The first peak is assigned to the carbon of the aliphatic chain and is close to expected theoretical concentration of 81.8 %. The second peak is assigned to the carbon bound to oxygen (C-O, expected binding energy of 286.5 eV)8,33 and to the carbon bound to phosphorus (C-P, expected binding energy of 286-286.4 eV)9,34. The high resolution C 1s spectrum of the hydroxyl terminated monolayer was also fit with two contributions as expected. The relative percentages of the 285 eV peak was 77.5 % ± 2.9 % (fwhm 1.1 eV) and the 286.3 eV peak was 21.7 % ± 3.5 % (fwhm 1.8 eV), both close to the theoretically expected values and the measured results for the powders. This and the clear difference to the substrate high resolution spectrum are in agreement with a monolayer structure.
The high resolution C 1s spectrum of (12-carboxydodecyl)phosphonic acid powder (Figure 2B) was fit with three peaks. The first peak at 285.0 eV (76.1 % ± 1.2 %; fwhm 1.1 eV) is attributed to the hydrocarbon chain, which has an expected concentration of 75.0 %. The second peak at 286.4 eV (15.7 % ± 1.5 %; fwhm 1.8 eV) is broader because it consists of the beta-shifted carbon next to the carboxylic group and the C-P bond. The third peak at 289.2 eV (8.2 % ± 0.6 %; fwhm 1.2 eV) is assigned to the carboxylic group, which has a theoretical concentration of 8.3 %.33,34 The spectrum of the carboxyl terminated monolayer was also fit with three contributions. The first peak at 285.0 eV has a relative percentage of 69.1 % ± 2.4 % (fwhm 1.2 eV), the second peak at 286.3 eV of 21.6 % ± 3.0 % (fwhm 1.9 eV) and the third peak at 289.3 eV of 9.3 % ± 1.8 %; (fwhm 1.7 eV). Again the agreement of the powder and the monolayer measurements and their difference from the substrate spectrum confirm the molecules have been deposited onto the titanium surface.
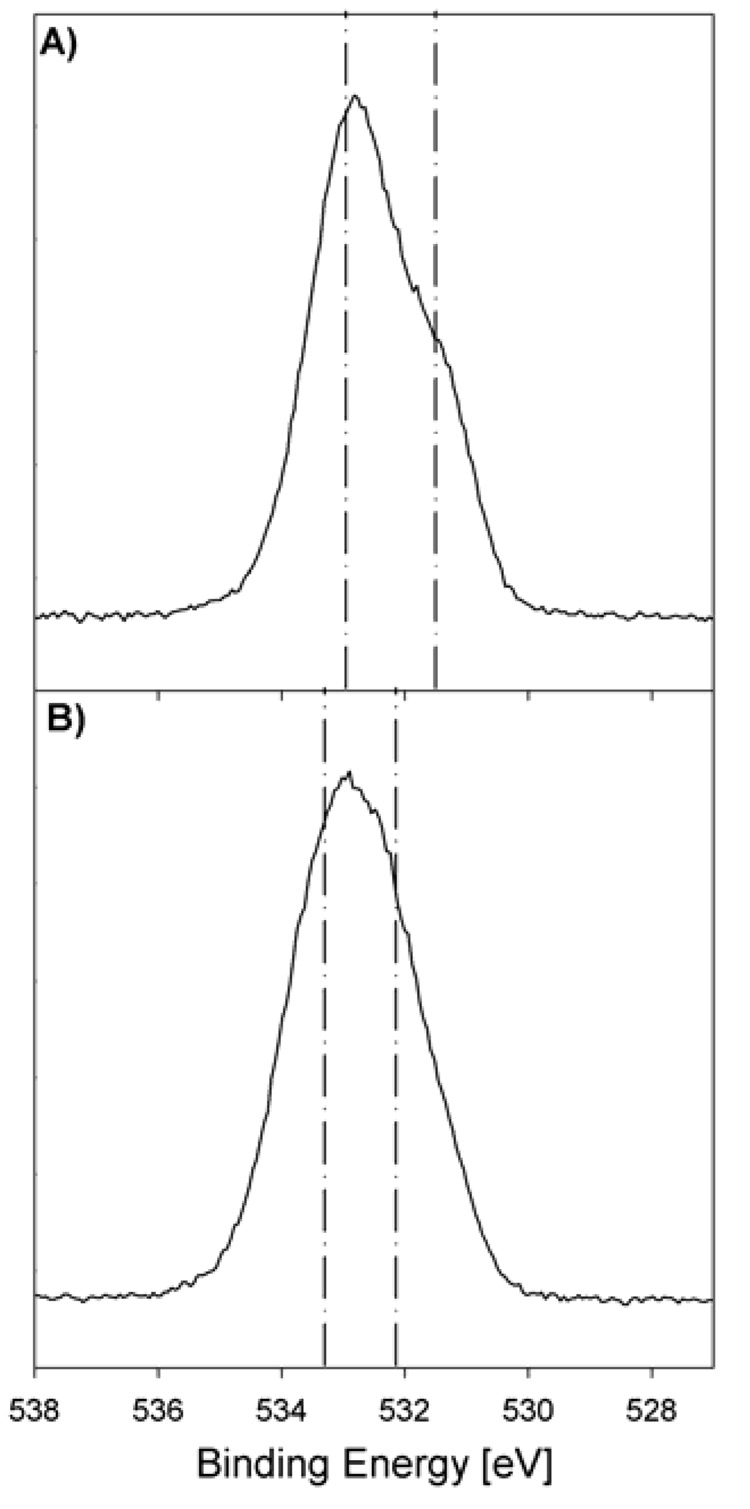
Reference high resolution O 1s spectra were recorded of the substrate and the two bulk powders for the angle resolved studies. The substrate spectrum was resolved into three contributions. The major peak at 530.4 eV was from the O atoms in TiO2 9,35 with the other contributions being from either surface terminal oxygen or bridging OH groups and basic hydroxyl groups and chemisorbed or surface contamination.9,29,35 The oxygen O 1s spectra of the (11-hydroxyundecyl)phosphonic acid powder signal is shown in Figure 3A.
Figure 3.
High Resolution XPS O 1s spectra of bulk powders of A) (11-hydroxyundecyl)phosphonic acid and B) (12-carboxydodecyl)phosphonic acid.
It was fit with two peaks. The first peak at 531.4 eV (25.2 % ± 6.6 %) was attributed to the P=O group with an expected concentration of 25 %. The literature binding energy for this peak ranges from 531.3 eV to 532.1 eV.8,32,36–38 The second peak at 532.8 eV (74.9 % ± 6.6 %) is broader because it consists of two species (P-OH and C-OH). The expected binding energy for the P-OH groups is between 532.6 and 533.6 eV,8,32,36–38 while the binding energy for the C-OH group is expected to be about 533.4 eV.8 The spectrum of the (12-carboxydodecyl)phosphonic acid powder was fit with two peaks (Figure 3B). The peak at 532.2 eV (52.0 % ± 1.2 %) is from the P=O and C=O species (both have reported binding energies of ~532 eV33) and the peak at 533.4 eV (48.0 % ± 1.2 %) is from the C-OH and P-OH species (both have reported binding energies near ~533.6 eV)33.
Angle resolved analysis
One sample of each monolayer was investigated in angle resolved XPS measurements at three different angles (see Table 3).
Table 3.
Angle dependent XPS compositional results of the hydroxyl and the carboxyl terminated layers.
| Take-off Angle | Atomic Composition [%] | |||||
|---|---|---|---|---|---|---|
| θ[°] | C 1s | O 1s | P 2p | Ti 2p | C/P | |
| OH | 70 | 67.8 | 23.0 | 3.3 | 5.9 | 20.7 |
| 35 | 45.9 | 40.3 | 2.8 | 11.0 | 16.5 | |
| 0 | 44.2 | 41.1 | 3.0 | 11.7 | 14.7 | |
| COOH | 70 | 52.9 | 35.5 | 4.0 | 7.6 | 13.3 |
| 35 | 37.3 | 46.3 | 3.0 | 13.4 | 12.6 | |
| 0 | 34.9 | 49.1 | 2.9 | 13.2 | 12.0 | |
The oxygen and titanium signals for both types of samples decrease at more glancing take-off angles. This is due to the decrease of sampling depth with increasing take-off angles and therefore resulting in a decreased signal from the underlying titanium dioxide substrate. Simultaneously the carbon signals increase at glancing take-off angles. Results of the angle resolved compositional scans are summarized in Table 3. The ratio of the carbon to the phosphorus signal (Table 3) can be used to determine the degree of molecular orientation. In theory the phosphorus should be oriented at the TiO2 substrate with the carbon oriented towards the outer surface. The increase in the C/P ratio at more glancing take-off angles indicates that the P is oriented towards the TiO2 substrate. As shown in Table 3, there is a much greater increase in the C/P ratio for the OH terminated layer, indicating a higher degree of orientation in the hydroxyl terminated monolayers compared to the carboxyl terminated layers.
The results of the angle dependent high resolution C 1s measurements are shown in Table 4. Unfortunately the measured hydroxyl terminated sample was slightly contaminated. This is shown by a third contribution in the high-resolution carbon spectrum, which was not detected on the samples measured earlier. However, there is a clear decrease of the hydrocarbon contribution at 285.0 eV and an increase of the 286.3 eV signal with increasing take-off angle. This is consistent with the hydroxyl group located at the outer surface of the monolayer. For the carboxyl terminated samples a decrease of the hydrocarbon concentration and an increase of the other two species with increasing take-off angle were observed. The increase of the carboxyl contribution at 288.9 eV, at glancing take-off angles indicates an orientation of the carboxyl group at the outer surface of the monolayer.
Table 4.
Angle dependent C 1s and O 1s high resolution XPS results of the hydroxyl and the carboxyl terminated layers.
| Take-off Angle | ||||||||
|---|---|---|---|---|---|---|---|---|
| θ[°] | C 1s [%] | O 1s [%] | ||||||
| 285.0 | 286.3 | 289.0 | 530.1 | 531.4 | 533.0 | [eV] | ||
| OH | 70 | 76.2 | 19.4 | 4.4 | 38.2 | 35.1 | 16.7 | |
| 35 | 77.4 | 17.5 | 5.1 | 56.0 | 31.1 | 12.9 | ||
| 0 | 81.5 | 16.0 | 2.5 | 57.6 | 28.5 | 13.9 | ||
| 285.0 | 286.5 | 288.9 | 530.1 | 531.4 | 532.9 | [eV] | ||
| COOH | 70 | 74.7 | 16.6 | 8.6 | 44.7 | 27.6 | 27.8 | |
| 35 | 77.1 | 15.4 | 7.5 | 52.4 | 35.7 | 12.0 | ||
| 0 | 79.7 | 12.6 | 7.6 | 55.2 | 32.9 | 11.9 | ||
The results of the angle dependent high resolution O 1s spectra are shown in Table 4. For both layers the peak was fit with three contributions. The peak at 530.1 eV was attributed to the TiO2 and it is clearly decreased at glancing take-off angles due to the decrease of the sampling depth. For the other two peaks their ratio is important to examine. Other studies report a transformation of P-OH bonds (533.0 eV) to P-O-Ti bonds (531.4 eV), as shown by a change in the ratio of the two peaks. From this change they conclude that a covalent attachment of the molecule to the surface has occurred.32,36–38 In our case for the unbound (11-hydroxyundecyl)phosphonic acid powder sample a ratio of the P=O to the P-OH and C-OH oxygen of 0.3 was measured, as expected theoretically. The ratio after immobilization of the peak at 531.4 eV to the one at 533.0 eV was 2.1–2.4, which suggests a transformation of the P-OH bond to a P-O-Ti bond has occurred upon covalent attachment of the polymer. However, due to the additional oxygen in the C-OH functional group of the current monolayers and the contamination detected in the high resolution C 1s, it is difficult to make any definitive conclusions about the binding mechanism in the (11-hydroxyundecyl)phosphonic acid monolayers. For (12-carboxydodecyl)phosphonic acid the ratio of the peaks is 1.1 for the free powder, 1.0 for the monolayer at a 70° take-off angle and 2.8 at 0° take-off angle. Again the contribution of the carboxyl functional group to both peaks makes it difficult to make any further conclusions about the binding mechanism of the phosphonic acid molecules. However, the change in peak ratio with take-off angle is consistent with the presence of carboxyl group at the outer surface of the monolayer and P-O-Ti bonds at the monolayer-substrate interface.
Tof-SIMS measurements of the monolayer
Time-of-flight secondary ion mass spectrometry (ToF-SIMS) was used to detect the monolayer formation. The freshly cleaned Ti90/Al6/V4 substrate was measured as reference (see Supporting Info). The highest peak observed in its positive ToF-SIMS spectrum is Ti+. Other peaks present included those from hydrocarbon contamination (e.g., the series CnH2n+1+ and CnH2n−1+) and other titanium species (e.g., TiO+ and TiO2H+). The negative spectrum is dominated by the O− and OH− peaks. Some hydrocarbon contamination (CH−, C2H−) and phosphorus contamination (PO2− and PO3−) were detected, as in XPS. Some additional contaminants (e.g., F− and Cl−) were detected with ToF-SIMS, but not with XPS. Titanium species in the negative spectrum were TiO2− and TiO3H−. The spectra agreed well with literature data.8,9,30,39
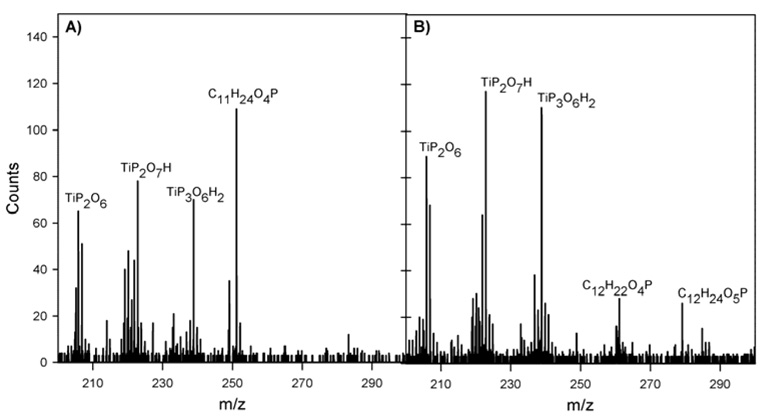
ToF-SIMS spectra were acquired from both monolayers. In the positive mode both surfaces exhibited similar hydrocarbon peaks compared to the bare substrate in the low mass region along with decreased intensities of the titanium peaks. Fragments of the type CaHbPcOd (C3H3O2P, C3H4O3P, C4H4O3P, etc.) and TiaPbOcHd (TiPO3, TiPO3H, TiPO4H2, etc.) were also detected, indicative of monolayer formation.8,36 For the negative mode similar fragments to the bare substrate were detected in the low mass range. In addition, fragments of the type CaHbPcOd (C2H4O3P, C3H6O3P, C4H6O3P, etc.) and TiaPbOcHd (TiPO4H, TiPO5, TiP2O6H etc.) were detected and provide further evidence for monolayer formation.8,35 For both surfaces the molecular mass peak (M-H)− was detected in the negative mode. For the hydroxyl terminated layer the (M-H)− is C11H24O4P at m/z 251.146 and for the carboxyl terminated layer it is C12H24O5P at m/z 279.141 (Figure 4).
Figure 4.
Negative ToF-SIMS results in m/z regiom 200–300 of A) the hydroxyl and B) the carboxyl terminated monolayers.
The intensity of the (M-H)− peak, normalized to the total intensity of the respective spectrum, is greater on the hydroxyl terminated than on the carboxyl terminated surfaces. Graham et al. reported that the detection of molecular mass ions is correlated with the degree of order in a monolayer.40 In agreement with the XPS results we therefore assume the higher intensity of the (M-H)− peak for the hydroxyl terminated layers is due to higher order of the layer.
Activation and reactivity test of the monolayers
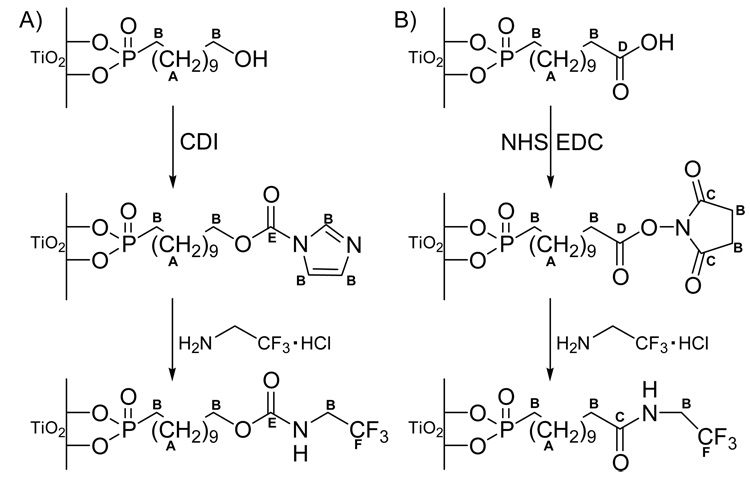
To check the activity of the COOH and OH functional groups, the monolayers were subsequently activated with N,N’-carbonyldiimidazole (CDI) or N-hydroxysuccinimide (NHS), respectively. These activated layers should be able to bind bioactive molecules such as proteins via their primary amine group. As fluorine groups are readily detectable in XPS, the reactivity of these surfaces was quantified using trifluoroethylamine hydrochloride (TFEA) derivatization from PBS. The reaction for each surface is summarized in Figure 5.
Figure 5.
Activation and F-tag binding of A) hydroxyl and B) carboxyl terminated monolayers.
The XPS composition results for these activated surfaces are summarized in Table 5. The contribution of TiO2 from the underlying substrate did not change significantly with activation and TFEA addition, so the TiO2 signals were subtracted to estimate the composition of the organic layer in comparison to the expected theoretical values.
Table 5.
XPS determined elemental compositions for the different modifications steps of the hydroxyl (OH) and carboxyl (COOH) terminated monolayers. The TiO2 contributions have been subtracted from these values and the remaining concentrations renormalized to 100%.
| C | O | P | N | F | |
|---|---|---|---|---|---|
| OH | 69.8±3.0 | 27.0±2.6 | 3.2±0.5 | 0.4±0.1 | |
| Expected | 68.8 | 25.0 | 6.3 | ||
| +CDI | 70.8±1.6 | 26.5±1.5 | 2.7±0.3 | 3.3±0.9 | |
| Expected | 65.2 | 21.7 | 4.3 | 8.7 | |
| +F | 68.0±2.6 | 26.4±1.9 | 2.8±0.4 | 1.6±0.4 | 1.1±0.2 |
| Expected | 58.3 | 20.8 | 4.2 | 4.2 | 12.5 |
| COOH | 65.9±2.4 | 31.2±2.1 | 2.9±0.4 | 0.6±0.3 | |
| Expected | 66.7 | 27.8 | 5.6 | ||
| +NHS | 66.6±0.9 | 29.4±1.6 | 2.4±0.2 | 4.0±0.9 | |
| Expected | 64.0 | 28.0 | 4.0 | 4.0 | |
| +F | 61.6±1.1 | 29.2±0.7 | 2.0±0.3 | 3.6±0.4 | 3.7±1.3 |
| Expected | 60.9 | 17.4 | 4.3 | 4.3 | 13.0 |
Upon activation of the hydroxyl terminated monolayer with CDI, there is a significant increase in the nitrogen content, as expected from the addition of the nitrogen containing CDI species (Table 5). However, as judged by the nitrogen concentration, which is lower than half of the expected value, it appears that the reaction has not gone to completion. Upon reaction with TFEA, fluorine is detected on the surface. However, the small amount of measured fluorine compared to the expected value shows, that the TFEA reaction was not very effective. Controls with non activated surfaces did not react with TFEA (data not shown). Activation of the carboxyl terminated layer with NHS showed a significant increase in the nitrogen concentration (Table 5). It is believed that this surface is completely activated as judged by the nitrogen concentration, which agrees with the theoretical value. More fluorine is immobilized on the COOH terminated surface as compared to the OH terminated surface. However, while this reaction was more successful it has still not gone to 100% completion since the measured fluorine concentration was significantly lower than the expected theoretical value. Again, non activated control surfaces do not react with the TFEA (data not shown).
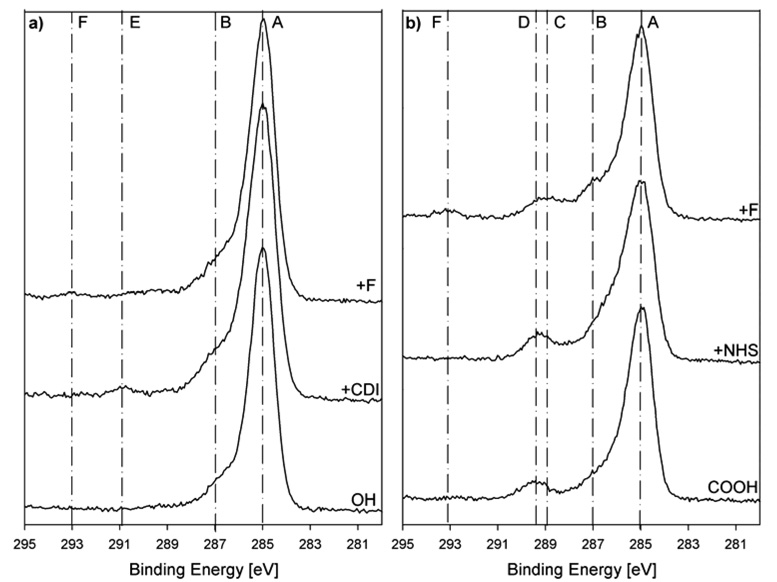
The high-resolution carbon spectra give further evidence for the successful activation and fluorine binding (Figure 6 a and b, Table 6). The positions and percent areas of the peaks are given in Table 6; the assignments of the peaks are shown in Figure 5 and 6.
Figure 6.
High resolution XPS C 1s spectra of the different modification steps for the a) hydroxyl and b) carboxyl terminated monolayers.
Table 6.
Peak positions and concentrations from the high resolution XPS C 1s spectra for the different modification steps of the monolayers.
| Peak | Position | Relative Peak Concentration [%] | |||||
|---|---|---|---|---|---|---|---|
| OH | (theory) | +CDI | (theory) | +F | (theory) | ||
| A | 285.0 | 77.5±2.9 | (81.8) | 72.3±0.5 | (60.0) | 71.7±1.3 | (64.3) |
| B | 286.2–286.5 | 21.7±3.5 | (18.2) | 24.2±2.4 | (33.3) | 22.7±1.8 | (21.4) |
| E | 288.9–289.5 | 3.4±2.0 | (6.7) | 5.1±1.0 | (7.1) | ||
| F | 292.2 | 0.5±0.9 | (7.1) | ||||
| COOH | (theory) | +NHS | (theory) | +F | (theory) | ||
| A | 285.0 | 69.1±3.4 | (75.0) | 61.4±2.7 | (56.3) | 64.7±0.7 | (64.3) |
| B | 286.3–286.7 | 21.6±3.0 | (16.7) | 26.4±2.1 | (25.0) | 21.7±2.2 | (21.4) |
| C/D | 288.9–289.2 | 9.3±1.8 | (8.3) | 12.1±0.6 | (18.7) | 10.7±1.1 | (7.1) |
| F | 293.1 | 2.9±0.7 | (7.1) | ||||
Upon activation of the hydroxyl layer with CDI a new peak is seen at 289.5 eV in the carbon spectra that is assigned to the N-COO group of immobilized CDI.33,41 The concentration is consistent with the composition data in that it is significantly lower than the expected theoretical value for a reaction that has gone to 100% completion. Subsequent immobilization of trifluoroethylamine leads to the new peak at 292.2 eV for the −CF3 group.33,42 This peak always had a very low concentration and in some cases could not be detected, consistent with the low amount of fluorine detected in the survey scan.
The C 1s signal of the NHS activated COOH layer was fit with three peaks. The first peak (285 eV) was assigned to hydrocarbon species, the second peak (~286.5 eV) to the C-P and the three beta-shifted carbons next to a carbonyl group, and the third peak (~289 eV) to the carbonyl groups of the ester and the NHS moiety.42,43 The concentration of this third peak is slightly lower than the expected theoretical value, indicating that, in contrast to the nitrogen results from the composition scan, the activation may not have gone to 100% completion. The difference between the C1s and elemental compositions is probably due the presence of some nitrogen contamination present in the initial monolayer. The successful binding of trifluoroethylamine in the next step was confirmed by the appearance of a new peak at 293.1 eV.33,42 Both the C 1s and elemental compositions indicate the TFEA reaction did not go to completion.
Immobilization of BMP-2
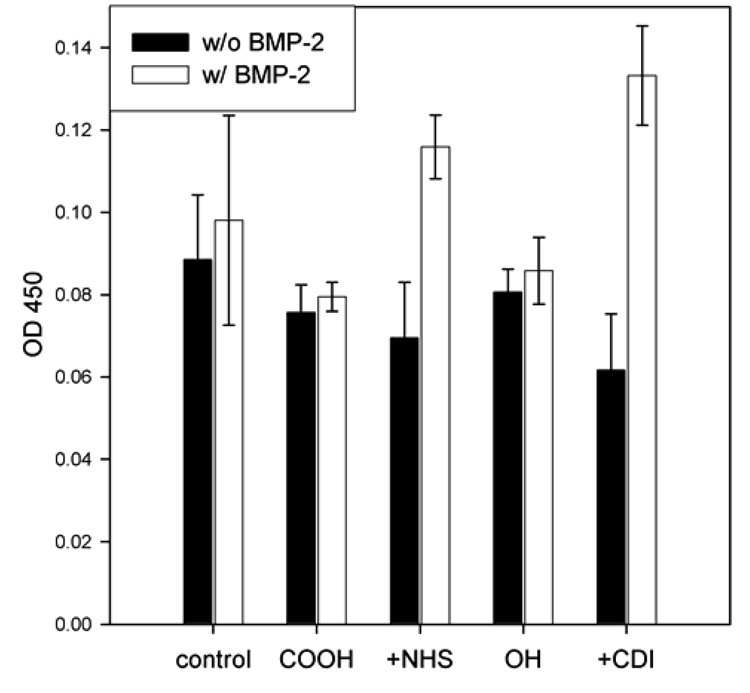
Because the TFEA reactivity test showed a successful immobilization of the fluorine-tagged molecule, initial experiments were performed to immobilize BMP-2 to the surface. The activated titanium samples along with non activated samples control samples were covered with a solution of recombinant human BMP-228 and left overnight at 4 °C under gentle shaking. Negative control reactions with just MES-buffer – the diluent used in the BMP-2 immobilization - were done under the same conditions. After thorough washing the amount of bound BMP-2 was detected by an indirect enzyme-linked immunosorbent assay (ELISA) using a monoclonal mouse anti-BMP-2 antibody and colorimetric detection. The results are shown in Figure 7.
Figure 7.
ELISA results of BMP-2 treated activated (+NHS, +CDI) and non activated (COOH, OH) SAMS along with the corresponding controls treated with pure buffer.
On both control surfaces (hydroxyl and carboxyl terminated monolayers) no significant difference between the BMP-2 treated surface and the MES-buffer treated surfaces was detected. The NHS and CDI activated surfaces treated with BMP-2 however show a significant difference both to the negative controls just treated with MES-buffer and the non activated samples treated with BMP-2. This is a clear evidence for immobilization of the BMP-2 onto the activated monolayer surfaces. However, ELISA can not distinguish between covalently bound and physically adsorbed protein. But the significantly lower signal intensity of the non activated control surfaces treated with BMP-2 indicates covalent immobilization of the protein on the activated surfaces. The CDI activated surfaces gave higher amounts of BMP-2 bound than the NHS activated. This is in contrast to the experiments with the trifluoroethylamine where the NHS was more effective. However, the differences measured here are still within the range of the error of the method.
Conclusions
Two methods to immobilize bioactive molecules to titanium surfaces have been developed. They employ the formation of monolayers of phosphonic acid molecules with functional groups that are subsequently activated to bind molecules via their primary amine groups. (11-hydroxy-undecyl)phosphonic acid and (12-carboxydodecyl)phosphonic acid were assembled onto titanium using the T-BAG method developed by Schwartz.12 XPS and ToF-SIMS measurements showed the successful assembly of the molecules onto the titanium surfaces. Furthermore surface analysis results indicate the hydroxyl terminated SAM is better ordered or orientated than the carboxyl terminated SAM. Subsequently the monolayers were successful activated using NHS or CDI chemistry, respectively. The activation was confirmed by XPS measurements. Experiments with a fluorine-tagged molecule showed, that the activated surfaces were able to covalently attach molecules containing a primary amine. BMP-2 could be attached to the titanium surfaces, too, as evidenced by ELISA. In comparison to existing methods to immobilize BMP-2 to titanium surfaces this method has the advantage that it employs phosphonic acids for preparation of the monolayers, which are more stable under physiological conditions than silane monolayers. Therefore, the bound protein will remain in place longer.
Supplementary Material
Secondary ion spectra of the bare substrate and both monolayers are available free of charge via the Internet at http://pubs.acs.org.
Acknowledgment
The authors would like to thank Michael Klopschar for cutting and polishing the titanium substrates. Dan Graham and Chi-Ying Lee are thanked for the helpful discussions.
This work was supported as a part of the SFB 599 (“Biomedical Engineering”) and of the SFB 578 (“From gene to product”) by the Deutsche Forschungsgemeinschaft (DFG) and by the NIH (NIBIB) Grant EB-002027 to the National ESCA and Surface Analysis Center for Biomedical Problems (NESAC/BIO).
References
- 1.Textor M, Tosatti S, Wieland M, Brunette DM. Bio-Implant Interface, Improving Biomaterials and Tissue Reactions. London: CRC Press; p. 341. [Google Scholar]
- 2.Ratner BD. Titanium in Medicine: Material Science, Surface Science, Engineering, Biological Responses and Medical Applications. Berlin: Springer Verlag; 2001. p. 2. [Google Scholar]
- 3.Xiao SJ, Textor M, Spencer ND, Wieland M, Keller B, Sigrist H. J. Mater. Sci. Mater. Med. 1997;8:867. doi: 10.1023/a:1018501804943. [DOI] [PubMed] [Google Scholar]
- 4.Xiao S-J, Textor M, Spencer ND. Langmuir. 1998;14:5507. [Google Scholar]
- 5.Rezania A, Johnson R, Lefkow AR, Healy KE. Langmuir. 1999;15:6931. [Google Scholar]
- 6.Jennissen HP, Zumbrink T, Chatzinikolaidou M, Stepphuhn J. Mat.-Wiss. u. Werkstofftech. 1999;30:838. [Google Scholar]
- 7.Gawalt ES, Avaltroni MJ, Koch N, Schwartz J. Langmuir. 2001;17:5736. [Google Scholar]
- 8.Tosatti S, Michel R, Textor M, Spencer ND. Langmuir. 2002;18:3537. [Google Scholar]
- 9.Viornery C, Chevolot Y, Léonard D, Aronsson B-O, Péchy P, Mathieu HJ, Descouts P, Grätzel M. Langmuir. 2002;18:2582. [Google Scholar]
- 10.Helmy R, Fadeev AY. Langmuir. 2002;18:8924. [Google Scholar]
- 11.Marcinko S, Fadeev AY. Langmuir. 2004;20:2270. doi: 10.1021/la034914l. [DOI] [PubMed] [Google Scholar]
- 12.Silverman BM, Wieghaus KA, Schwartz J. Langmuir. 2005;21:225. doi: 10.1021/la048227l. [DOI] [PubMed] [Google Scholar]
- 13.Hanson EL, Schwartz J, Nickel B, Koch N, Danisman MF. J. Am. Chem. Soc. 2003;125:16074. doi: 10.1021/ja035956z. [DOI] [PubMed] [Google Scholar]
- 14.Gawalt ES, Avaltroni MJ, Danahy MP, Silverman BM, Hanson EL, Midwood KS, Schwarzbauer JE, Schwartz J. Langmuir. 2003;19:200. [Google Scholar]
- 15.Schwartz J, Avaltroni MJ, Danahy MP, Silverman BM, Hanson EL, Schwarzbauer JE, Midwood KS, Gawalt ES. Mater. Sci. Eng. C. 2003;23:395. [Google Scholar]
- 16.Danahy MP, Avaltroni MJ, Midwood KS, Schwarzbauer JE, Schwartz J. Langmuir. 2004;20:5333. doi: 10.1021/la036084h. [DOI] [PubMed] [Google Scholar]
- 17.Puelo DA, Nanci A. Biomaterials. 1999;20:2311. doi: 10.1016/s0142-9612(99)00160-x. [DOI] [PubMed] [Google Scholar]
- 18.Hoffmann A, Weich HA, Gross G, Hillmann G. Appl. Microbiol. Biotechnol. 2001;57:294. doi: 10.1007/s002530100746. [DOI] [PubMed] [Google Scholar]
- 19.Voggenreiter G, Hartl K, Assenmacher S, Chatzinikolaidou M, Rumpf HM, Jennissen HP. Mat.-Wiss. u. Werkstofftech. 2001;32:942. [Google Scholar]
- 20.Karageorgiou V, Meinel L, Hofmann S, Malhotra A, Volloch V, Kaplan D. J. Biomed. Mater. Res. 2004;71A:528. doi: 10.1002/jbm.a.30186. [DOI] [PubMed] [Google Scholar]
- 21.Armarego WLF, Perrin DD. Purification of Laboratory Chemicals. 4th ed. Oxford: Butterworth-Heinemann; 1996. [Google Scholar]
- 22.Putvinski TM, Schilling ML, Katz HE, Chidsey CED, Mujsce AM, Emerson AB. Langmuir. 1990;6:1567. [Google Scholar]
- 23.Pawsey S, Yach K, Reven L. Langmuir. 2002;18:5205. [Google Scholar]
- 24.Zeppenfeld G, et al. Organikum. 19th ed. Leipzig Berlin Heidelberg: Johann Ambrosius Barth Verlag; 1993. [Google Scholar]
- 25.Griep-Raming N, Karger M, Menzel H. Langmuir. 2004;20:11811. doi: 10.1021/la0485327. [DOI] [PubMed] [Google Scholar]
- 26.Herrwerth S, Rosendahl T, Feng C, Fick J, Eck W, Himmelhaus M, Dahint R, Grunze M. Langmuir. 2003;19:1880. [Google Scholar]
- 27.Noiset O, Schneider Y-J, Marchand-Brynaert J. J. Polym. Sci. A: Polym. Chem. 1997;35:3779. [Google Scholar]
- 28.Vallejo LF, Brokelmann M, Marten S, Trappe S, Cabrera-Crespo J, Hoffmann A, Gross G, Weich HA, Rinas U. J. Biotechn. 2002;94:185. doi: 10.1016/s0168-1656(01)00425-4. [DOI] [PubMed] [Google Scholar]
- 29.Sittig C, Textor M, Spencer ND, Wieland M, Vallotton P-H. J. Mater. Sci. Mater. Med. 1999;10:35. doi: 10.1023/a:1008840026907. [DOI] [PubMed] [Google Scholar]
- 30.Textor M, Sittig C, Frauchinger V, Tosatti S, Brunette DM. Titanium in Medicine: Material Science, Surface Science, Engineering, Biological Responses and Medical Applications. Berlin: Springer Verlag; 2001. p. 171. [Google Scholar]
- 31.Nanci A, Wuest JD, Peru L, Brunet P, Sharma V, Zalzal S, McKee MD. J. Biomed. Mater. Res. 1998;40:324. doi: 10.1002/(sici)1097-4636(199805)40:2<324::aid-jbm18>3.0.co;2-l. [DOI] [PubMed] [Google Scholar]
- 32.Hofer R, Textor M, Spencer ND. Langmuir. 2001;17:4014. [Google Scholar]
- 33.Beamson G, Briggs D. High Resolution XPS of Organic Polymers. Chichester: The Scienta ESCA300 Database , John Wiley and Sons; 1992. [Google Scholar]
- 34.Davies PR, Newton NG. Appl. Surf. Sci. 2001;181:296. [Google Scholar]
- 35.Lu G, Bernasek SL, Schwartz J. Surf. Sci. 2000;458:80. [Google Scholar]
- 36.Textor M, Ruiz L, Hofer R, Rossi A, Feldman K, Hähner G, Spencer ND. Langmuir. 2000;16:3257. [Google Scholar]
- 37.Zorn G, Gotman I, Gutmanas EY, Aladi R, Salitra G, Sukenik CN. Chem. Mater. 2005;17:4218. [Google Scholar]
- 38.Adolphi B, Jähne E, Busch G, Cai X. Anal. Bioanal. Chem. 2004;379:646. doi: 10.1007/s00216-004-2634-x. [DOI] [PubMed] [Google Scholar]
- 39.Briggs D, Brown A, Vickerman JC. Handbook of Static Secondary Ion Mass Spectrometry. Chichester: John Wiley and Sons; [Google Scholar]
- 40.Graham DJ, Ratner BD. Langmuir. 2002;18:5861. [Google Scholar]
- 41.McArthur SL, Halter MW, Vogel V, Castner DG. Langmuir. 2003;19:8316. [Google Scholar]
- 42.Böcking T, James M, Coster HGL, Chilcott TC, Barrow KD. Langmuir. 2004;20:9227. doi: 10.1021/la048474p. [DOI] [PubMed] [Google Scholar]
- 43.Voicu R, Boukherroub R, Bartzoka V, Ward T, Wojtyk JTC, Wayner DDM. Langmuir. 2004;20:11713. doi: 10.1021/la047886v. [DOI] [PubMed] [Google Scholar]
Associated Data
This section collects any data citations, data availability statements, or supplementary materials included in this article.
Supplementary Materials
Secondary ion spectra of the bare substrate and both monolayers are available free of charge via the Internet at http://pubs.acs.org.


