

Abstract
Peroxisome proliferator activated receptor alpha (PPARα) agonists are anti-hyperlipidemic drugs that influence fatty acid combustion, phospholipid biosynthesis and lipoprotein metabolism. To evaluate impacts on other aspects of lipid metabolism, we applied targeted metabolomics to liver, heart, brain and white adipose tissue samples from male Swiss-Webster mice exposed to a 5 day, 500 mg/kg/day regimen of i.p. clofibrate. Tissue concentrations of free fatty acids and the fatty acid content of sphingomyelin, cardiolipin, cholesterol esters, triglycerides and phospholipids were quantified. Responses were tissue-specific, with changes observed in the liver > heart ≫ brain > adipose. These results indicate that liver saturated fatty acid-rich triglycerides feeds clofibrate-induced monounsaturated fatty acid (MUFA) synthesis, which were incorporated into hepatic phospholipids and sphingomyelin. In addition, selective enrichment of docosahexeneoic acid in the phosphatidylserine of liver (1.7-fold), heart (1.6-fold) and brain (1.5-fold) suggests a clofibrate-dependent systemic activation of phosphatidylserine synthetase 2. Furthermore, the observed ~20% decline in cardiac sphingomyelin is consistent with activation of a sphingomeylinase with a substrate preference for polyunsaturate-containing sphingomyelin. Finally, perturbations in the liver, brain, and adipose cholesterol esters were observed, with clofibrate exposure elevating brain cholesterol arachidonyl-esters ~20-fold. Thus, while supporting previous findings, this study has identified novel impacts of PPARα agonist exposure on lipid metabolism that should be further explored.
Keywords: lipid metabolism, metabolomics, PPAR-alpha agonist, clofibrate, sphingomyelin, extra-hepatic
1. Introduction
Fibrates are widely prescribed hypolipidemic drugs that exert their effects through peroxisome proliferator activated receptor alpha (PPARα)-dependent mechanisms (Fruchart et al., 1999). In responsive individuals, such PPARα agonists reduce plasma triglycerides and low density lipoproteins, elevate plasma high density lipoproteins (Kliewer et al., 2001; Linton and Fazio, 2000), and inhibit inflammatory signaling in vascular cells (Delerive et al., 1999; Marx et al., 2004), effects which reduce cardiovascular risk (Kliewer et al., 2001; Linton and Fazio, 2000). However, while extensively studied, the full breadth of responses to PPARα agonist exposure has yet to be defined. Early investigations of PPARα agonists, including an array of environmental pollutants (e.g., phenoxy acetate herbicides, trichloroethylene, diethylhexyl phthalate), classified these compounds as non-genotoxic carcinogens in mammals due to the canonical proliferative response of hepatic peroxisomes in exposed rodents (Maloney and Waxman, 1999; Reddy, 2004). PPARα activation influences peroxisomal and mitochondrial associated gene expression and enzyme activity in multiple tissues including the liver, heart, kidney, brain, intestine, white and brown adipose, with the liver being the most responsive (Cook et al., 2000; Cullingford et al., 2002; Karbowska et al., 1999). These agents influence various aspects of lipoprotein metabolism (Fruchart et al., 1999), long-chain fatty acid oxidation (Cook et al., 2000), and lipogenesis (Karbowska et al., 1999), as well as glycerophospholipid (Lenart et al., 1998), cardiolipin (Jiang et al., 2004), and cholesterol esters biosynthesis (Chinetti et al., 2003).
PPARα is present in most tissues, but is highly expressed in tissues with elevated respiration rates including brown adipose tissue, liver, renal cortex and heart (Kersten et al., 2000; Klaus, 2004). In general, the level of PPARα expression correlates with the metabolic activity and lipid-dependent energy metabolism of a given tissue type (Escher et al., 2001; Michalik et al., 2004). However, even tissues with high PPARα expression show differential responses to fibrate exposure in terms of changes in the cellular β-oxidation machinery (Cook et al., 2000; Nemali et al., 1988). It is therefore expected that the magnitude of the tissue-selective responses to clofibrate treatment will reflect the relative PPARα expression levels, while the nature of the effect will reflect the role of this receptor in disparate tissues.
In this study we assessed the effects of clofibrate on lipid metabolism in the liver, heart, brain and white adipose of male Swiss-Webster mice with the goal of identifying novel PPARα agonist responsive pathways. The concentrations of ~400 discrete lipids, comprising the majority of cellular structural lipids, were compared between treated and untreated animals using a focused metabolomics approach (Watkins et al., 2002). Our findings support numerous earlier studies while laying the foundation for future explorations of clofibrate-dependent shifts in lipid metabolism.
2. Materials and Methods
2.1. Animals
Male Swiss-Webster mice were purchased from Charles River Breeding Laboratory (Hollister, CA) and weighed 20–25 g upon receipt. Mice were housed in HEPA-filtered racks for 7 d before use and were fed and watered ab lib., with a light cycle of 12 h light and 12 h dark. Animal care procedures were approved by the Animal Use and Care Committee at the University of California, Davis. Animals (n = 5/group) were injected i.p. with either clofibrate (Sigma Chemical, St. Louis; 500 mg/kg body weight) in corn oil, or the corn oil vehicle alone, daily for 5 days as previously described (Chen et al., 2000). On the sixth day, mice were euthanized with 100mg/kg i.p. pentobarbital. All organs were immediately excised, rinsed in a 0.9% sodium chloride solution (1% w/v) and flash frozen at −80°C.
2.2. Lipid analysis
Lipid analyses were performed by Lipomics Technologies, Inc. (West Sacramento, CA) using previously reported methods (Watkins et al., 2002). Tissue concentrations of free fatty acids and the fatty acid content of sphingomyelin, cardiolipin, cholesterol esters, triglycerides and phospholipids were quantified. Briefly, lipids were extracted from tissues using 2:1 (v/v) chloroform:methanol (Folch et al., 1957) in the presence of internal standards. An extract equivalent of 25 mg of heart, brain, or liver tissue or 10 mg inguinal adipose tissue was then analyzed. Individual lipid classes were separated by preparative TLC (Watkins et al., 2002) using lipid class standards spotted on the two outside lanes of the TLC plate to enable lipid class localization. Lipid classes were scraped from the plate and trans-esterified in 3N methanolic-HCl under nitrogen at 100°C for 45 min. The resulting fatty acid methyl esters were extracted from the mixture with hexane containing 0.05% butylated hydroxytoluene and stored under nitrogen. Fatty acid methyl esters were separated and quantified by GLC using a Hewlett-Packard (Wilmington, DE) model 6890 GC equipped with a 0.25mm i.d. × 30m 5μm DB-225MS column (J&W Scientific, Folsom, CA) and a flame-ionization detector (Watkins et al., 2002). Free fatty acids as well as the fatty acid content of sphingomyelin, cardiolipin, cholesterol esters, triglycerides and phospholipids were quantified. Total phospholipids as well as individual phosphatidylcholine and phosphatidylethanolamine were measured; however, the Lipomics Technologies method does not discriminate between phosphatidylserine and phosphatidylinositol.
2.3. Data analysis
Differences in mean concentrations between treated and control mice were tested using 2-tailed t-tests with α = 0.05, unless otherwise stated. Non-detected values were replaced with 50% of the lowest reported value for the purpose of determining significance. Fold changes were calculated relative to control means. Significant changes for each measured lipid are displayed in Figure 1 in a heat map of fold-differences from control.
Figure 1.

Clofibrate treatment differentially altered the concentrations of individual lipids in the liver, heart, brain and adipose tissues. Lipids of various chain lengths are grouped by structural similarity, which is associated with their route of biosynthesis. These subclasses include the saturated fatty acids (SAT), terminal double bond location relative to the omega terminal (omega X = nX), the dimethyl acetals resulting from ether linked plasmalogens (PM), and fatty acids containing trans-double bonds(trans). Significant changes (p < 0.05) are indicated graphically such that: white = increase; black = decrease; grey = no change; x = lipid not naturally present.
3. Results
Lipid concentrations (nmol/g tissue) are reported for the analyzed lipid subclasses, including total fatty acids (the sum of all fatty acids analyzed), saturated fatty acids (SAT), monounsaturated fatty acids (MUFA), polyunsaturated fatty acids (PUFA), omega 3 fatty acids (n3), omega 6 fatty acids (n6), products of the delta-9 desaturase (n7 and n9), plasmalogens and trans-fatty acids (trans). The vector of each significant change from control (p < 0.05) is shown in Figure 1. The measured lipid concentrations are provided on a tissue-selective basis along with information on fatty acid nomenclature in the Supplementary Data. Results are reported as group means ± standard deviations within the text.
3.1. Hepatic lipid metabolism
Changes were observed in both the concentration and composition of hepatic lipids (Figure 1 and Figure 2). Total hepatic triglyceride concentrations were ~30% lower in treated mice (4,620 ± 1,300 nmol/g) than in control mice (6,620 ± 1,000 nmol/g), while total cholesterol ester concentrations decreased ~25% (treated: 1,180 ± 140 nmol/g; control: 1,590 ± 210 nmol/g). Phosphatidylserine/inositol concentrations were ~30% higher in treated mice (7,280 ± 550 nmol/g) than in control mice (5,620 ± 380 nmol/g), as were lysophosphatidylcholine concentrations (treated: 1,150 ± 69 nmol/g; control: 874 ± 66 nmol/g).
Figure 2.

Clofibrate treatment affected the saturated fatty acid (SAT), monounsaturated fatty acid (MUFA) and polyunsaturated fatty acid (PUFA) distribution in the liver and heart. In the liver, SAT concentrations were decreased in triglycerides (TG) and to a lesser extent cholesterol esters (CE) and sphingomyelin (SM), while being increased slightly in the phosphatidylserine/inositol (PS) and lysophosphatidylcholine (LPC), but not phosphatidylethanolamine (PE) or phosphotidylcholine (PC). The MUFA concentrations were substantially increased in all liver phospholipid classes, including cardiolipin (CL). Increases in PS and LPC PUFAs were also observed. In the heart, increases in all free fatty acids (FFAs) and decreases in MUFA and PUFA SMs were observed (see Figure 4 for details). White and black bars indicate control and clofibrate-treated groups, respectively. Concentrations are expressed as the mean ± standard deviation of each group (n = 5) with differences in means tested using 2-tailed t-tests (* = p < 0.05).
A number of specific changes in SAT, MUFA and PUFA concentrations were observed in each lipid subclass. While not apparent in the sum of the measured 14 to 22 carbon saturated fatty acids (i.e., the SAT value), palmitic acid (16:0) was elevated in phosphatidylcholine (treated: 17,600 ± 870; control: 14,900 ± 1,200), lysophosphatidylcholine (treated: 520 ± 46; control: 384 ± 32 nmol/g) and phosphatidylserine/inositol (treated: 1,460 ± 270; control: 893 ± 78 nmol/g) of treated mice relative to controls, but reduced in both triglycerides (treated: 2,970 ± 740; control: 4,820 ± 650 nmol/g) and cholesterol esters (treated: 315 ± 51; control: 522 ± 120 nmol/g). Hepatic sphingomyelins also showed a decrease in SATs following clofibrate treatment (Table 1). In addition, the concentration of MUFAs including palmitoleic (16:1n7), vaccenic (18:1n7) and oleic (18:1n9) acids were increased in all of the liver glycerophospholipids (Figure 1). In particular, the concentrations of 16:1n7 and 18:1n9, both direct products of the delta-9 desaturase steroyl CoA desaturase (SCD), were increased in each of the major structural phospholipids, except sphingomeylin. Clofibrate did not increase these fatty acids in the free fatty acid, triglyceride or cholesterol ester pools of the liver.
Table 1.
Fold-changes in lipid subclass component molar abundance produced by i.p. clofibrate
| Total FA | SAT | MUFA | n7 | n9 | PUFA | n3 | n6 | PM | |
|---|---|---|---|---|---|---|---|---|---|
| Brain | |||||||||
|
| |||||||||
| SM | --- | --- | +1.3 | +1.6 | --- | +1.7 | --- | +1.7 | --- |
| CL | NA | NA | NA | NA | NA | NA | NA | NA | NA |
| FFA | --- | --- | --- | +1.2 | --- | --- | −2.5 | --- | --- |
| CE | −1.3 | --- | −1.7 | −1.4 | −1.7 | +2.0 | --- | +2.3 | --- |
| TG | --- | --- | --- | --- | --- | --- | --- | --- | --- |
| TPL | --- | --- | --- | --- | --- | --- | +1.1 | --- | --- |
|
| |||||||||
| Heart | |||||||||
|
| |||||||||
| SM | −1.2 | --- | −1.5 | −2.3 | −1.5 | −1.7 | −1.7 | −1.6 | --- |
| CL | --- | --- | --- | --- | --- | --- | --- | --- | --- |
| FFA | +1.4 | +1.5 | +1.4 | +1.4 | +1.4 | +1.5 | +2.1 | +1.4 | --- |
| CE | --- | --- | --- | --- | --- | --- | --- | --- | --- |
| TG | --- | --- | --- | --- | --- | --- | --- | --- | --- |
| TPL | --- | --- | --- | --- | --- | --- | --- | --- | --- |
|
| |||||||||
| Liver | |||||||||
|
| |||||||||
| SM | --- | −1.2 | --- | +1.4 | --- | --- | --- | --- | --- |
| CL | --- | --- | +1.7 | +1.5 | +1.8 | --- | +1.3 | --- | --- |
| FFA | --- | --- | --- | +1.5 | --- | --- | --- | --- | +6.9 |
| CE | −1.4 | −1.6 | --- | --- | −1.4 | --- | −1.8 | --- | --- |
| TG | −1.4 | −1.6 | --- | --- | --- | --- | −3.5 | --- | --- |
| TPL | --- | --- | +1.6 | +1.9 | +1.6 | --- | −1.1 | --- | −1.2 |
| PC | --- | --- | +1.7 | +1.9 | +1.7 | --- | −1.3 | --- | --- |
| PE | --- | --- | +1.6 | +2.2 | +1.5 | --- | --- | --- | --- |
| PS/PI | +1.3 | +1.1 | +3.1 | +4.0 | +2.8 | +1.3 | +1.7 | +1.2 | --- |
|
| |||||||||
| Adipose | |||||||||
|
| |||||||||
| SM | --- | ND | ND | ND | ND | ND | ND | ND | ND |
| CL | --- | NA | NA | NA | NA | NA | NA | NA | NA |
| FFA | --- | +1.3 | --- | --- | --- | --- | --- | --- | --- |
| CE | --- | −1.6 | +1.9 | +2.2 | +1.9 | --- | +1.4 | --- | --- |
| TG | --- | --- | --- | --- | --- | --- | --- | --- | --- |
| TPL | --- | --- | --- | --- | --- | --- | --- | --- | −1.5 |
Note. Values are mean ± SD fold change between clofibrate- and vehicle-treated (n = 5) groups (p < 0.05; 2-tailed t-test). - - - = no change; ND = not detected; NA = not analyzed; SM = sphingomyelin; CL = cardiolipin; FFA = free fatty acids; CE = cholesterol esters; TG = triglycerides; TPL = total phospholipids; PC = phosphatidylcholine; PE = phosphatidylethanolamine; PS/PI = phosphatidylserine/inositol; SAT = saturated fatty acids; MUFA = monounsaturated fatty acids; PUFA = polyunsaturated fatty acids; PM = plasmalogens; trans = trans-fatty acids; nX = omegaX where X indicates the terminal double bond carbon relative to the omega terminal.
Clofibrate-induced changes in PUFAs (i.e., n3 and n6 lipids) were also observed in liver tissue. Multiple lipid classes, including free fatty acids, cardiolipin, lysophosphatidylcholine, phosphatidylcholine, phosphatidylethanolamine and phosphatidylserine/inositol showed 2–3 fold increases in dihomo-γ-linolenic acid (20:3n6), while total phospholipid measurements revealed additional increases in mead acid (20:3n9) and decreased arachidonic acid (AA, 20:4n6; Figure 1). Upon closer inspection it was found that the influence of clofibrate on phosphatidylserine/inositol was distinct from that of phosphatidylethanolamine and phosphatidylcholine. Increases in 20:3n6 and 22:5n3 were observed in all three phospholipid classes, however the distribution of docosahexenoic acid (DHA, 22:6n3) changed on a phospholipid class-specific basis. DHA increased in phosphotidylserine/inositol (treated: 1,400 ± 360; control 830 ± 90 nmol/g; Figure 3), was unchanged in phosphatidylethanolamine and decreased in phosphatidylcholine. Only phosphatidylcholine exhibited a change in AA levels, which declined by 38%, while free AA increased 78%. Interestingly, while triglyceride DHA levels fell ~5-fold with clofibrate exposure (treated: 115 ± 30 nmol/g; control: 570 ± 160 nmol/g), free DHA was unchanged (treated: 56 ± 13 nmol/g; control: 59 ± 16 nmol/g).
Figure 3.
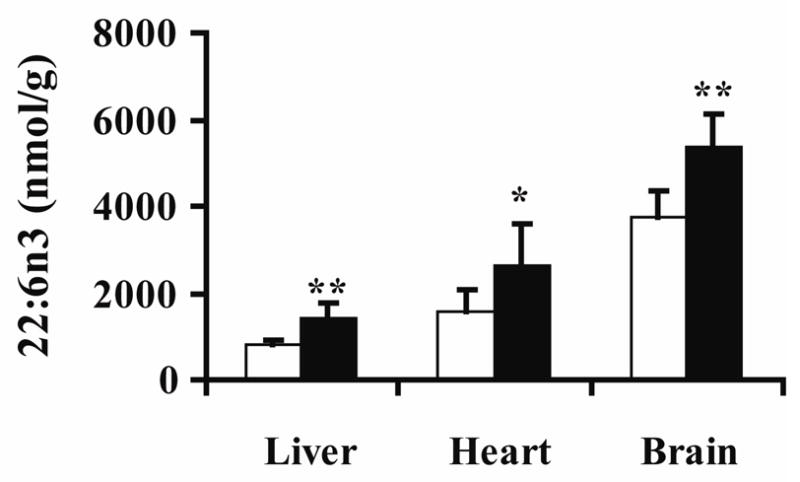
Docosahexenoic acid (DHA, 22:6n3) concentrations in phosphatidylserine/inositol (PS) were affected by clofibrate treatment. White and black bars indicate control and clofibrate-treated groups, respectively. Concentrations are expressed as the mean ± standard deviation of each group (n = 5) with differences in means tested using 2-tailed t-tests (* p = 0.07; ** p < 0.05).
3.2. Cardiac lipid metabolism
The heart showed multiple responses to clofibrate treatment in this study (Figure 1 –Figure 4). Free fatty acids increased by ~45% (treated: 1,420 ± 73 nmol/g; control: 979 ± 67 nmol/g; Table 1). In contrast, sphingomyelin concentration declined by 20% with clofibrate treatment (treated: 1,140 ± 110; control: 1,420 ± 110 nmol/g). While the concentrations of SATs in sphingomyelin were unchanged, the concentrations of MUFAs and PUFAs, declined in this lipid class (Figure 2 and Figure 4). No changes were observed in triglycerides, total phospholipids, cholesterol esters, or cardiolipin (Table 1). However, as shown in Figure 3, an increase in phosphatidylserine/inositol DHA content was observed (p = 0.07; treated: 2,600 ± 970; control: 1,600 ± 500 nmol/g). In the case of triglycerides, the variance in the treated group was 2-fold greater than controls (F-test p < 0.01), with two of the five animals showing evidence of greatly increased cardiac triglycerides. The variance of all other cardiac lipid classes was equivalent between treated and control groups. In contrast to the liver, heart lipids were not enriched with 16:1n7, 18:1n7, 18:1n9 or 20:3n9 upon clofibrate treatment (Figure 1). This figure also shows that the concentrations of 20:3n6 were higher (1.2- to 2.4-fold) in most lipid subclass of clofibrate-treated heart. The exceptions were sphingomyelin, which decreased as described above, and phosphatidylserine/inositol, lysophosphatidylcholine, and cardiolipin which were unchanged. Despite the increase in 20:3n6, there was a decrease in its delta-5 desaturase product AA in heart phosphatidylcholine (45%), phosphatidylserine/inositol (39%), total phospholipids (28%), cholesterol esters (50%), and sphingomyelin (69%) with clofibrate-treatment.
Figure 4.

Cardiac sphingomyelin (SM) concentrations were affected by clofibrate treatment. A) Concentrations of saturated fatty acid (SAT), monounsaturated fatty acid (MUFA) and polyunsaturated fatty acid (PUFA) in control and clofibrate-treated mice. B) Concentrations of omega 3 family fatty acids (n3), omega 6 family fatty acids (n6) and products of the delta-9-desaturase (n7 and n9). Concentrations are expressed as the mean ± standard deviation of each group (n = 5) with differences in means tested using 2-tailed t-tests (* = p < 0.05).
Other observed changes in the heart were reductions in phosphatidylethanolamine plasmalogens (treated: 1,010 ± 110; control: 1,380 ± 200 nmol/g) and minor changes in cardiolipin composition, which showed increased myristic acid (14:0) and erucic acid (22:1n9), and decreased AA and stearidonic acid (18:4n3) in treated animals.
3.3. Brain lipid metabolism
The brain displayed moderate changes upon clofibrate exposure (Figure 1 and Figure 3). No significant effects of clofibrate treatment were observed in the triglyceride, total phospholipid, or free fatty acid lipid subclasses (Table 1), however, levels of phosphatidylserine/inositol increased by ~30% (treated: 11,800 ± 1,700; control: 8,930 ± 1,700 nmol/g). When examined closely, a number of significant changes in PUFA distributions were observed. In particular, fluctuations in AA and DHA concentrations were observed (Figure 1). Free DHA decreased ~60% in clofibrate-treated individuals, while the DHA content of phosphatidylserine/inositol increased 144% (treated 5,400 ± 720; control 3,700 ± 640 nmol/g; Figure 3). The AA content of both phosphatidylserine/inositol and triglycerides also increased. In addition, both AA and DHA increased in sphingomyelin and were responsible for the significant increase in MUFAs and PUFAs observed for this lipid class (1.3- and 1.7-fold, respectively).
The total concentrations of cholesterol esters were decreased with clofibrate-treatment (treated: 1,590 ± 260 nmol/g; control: 2,080 ± 260 nmol/g). However, the composition of this lipid class changed, with MUFAs decreasing and PUFAs increasing by ~2-fold (treated: 322 ± 67; control: 160 ± 17 nmol/g). The increase in cholesterol PUFA esters was accounted for by a 19-fold enrichment in AA (treated: 183 ± 61; control: 9.73 ± 1.5 nmol/g) and a substantial decline in 18:1n9 (treated: 520 ± 100; control: 932 ± 110 nmol/g).
3.4. Adipose lipid metabolism
Few effects were observed in the analyzed adipose tissue collected from the retroperitoneal fat pad (Figure 1). Most notable were changes in cholesterol esters that showed decreases in SATs, and increases in MUFAs and n3 fatty acids (Table 1). Increases were observed in the SCD products 16:1n7 (treated: 120 ± 33; control: 41 ± 10 nmol/g), 18:1n7 (treated: 210 ± 24; control: 110 ± 24 nmol/g) and 18:1n9 (treated: 1,890 ± 500; control: 800 ± 180 nmol/g). The decrease in SAT levels was dominated by a decline in 16:0 concentrations (treated: 890 ± 250; control: 1,470 ± 240 nmol/g; Figure 1). A 30% increase in SATs in free fatty acids following clofibrate treatment was observed, being mainly driven by an increase in 16:0 levels (treated: 1,950 ± 370; control: 1,380 ± 230 nmol/g).
4. Discussion
Fibrates are PPARα agonists used to treat disorders associated with hyperlipidemia (Schmitz and Langmann, 2006; Zambon et al., 2006). Humans are also exposed to PPARα agonists as environmental contaminants (Hauser et al., 2004; Latini et al., 2004; Mortensen et al., 2005; Otake et al., 2004), and such non-therapeutic exposures can alter lipid metabolism (Thorne et al., 1994) and produce adverse health effects (Hauser et al., 2005; Mortensen et al., 2005; Otake et al., 2004). Clofibrate affects lipid metabolism in a tissue-specific manner (Cook et al., 2000; Karbowska et al., 1999; Nemali et al., 1988). To enhance our understanding of the action of PPARα agonists on systemic lipid metabolism as described by Figure 5, the current study examined the effects of clofibrate treatment on the lipids of the liver, heart, brain and white adipose tissue.
Figure 5.
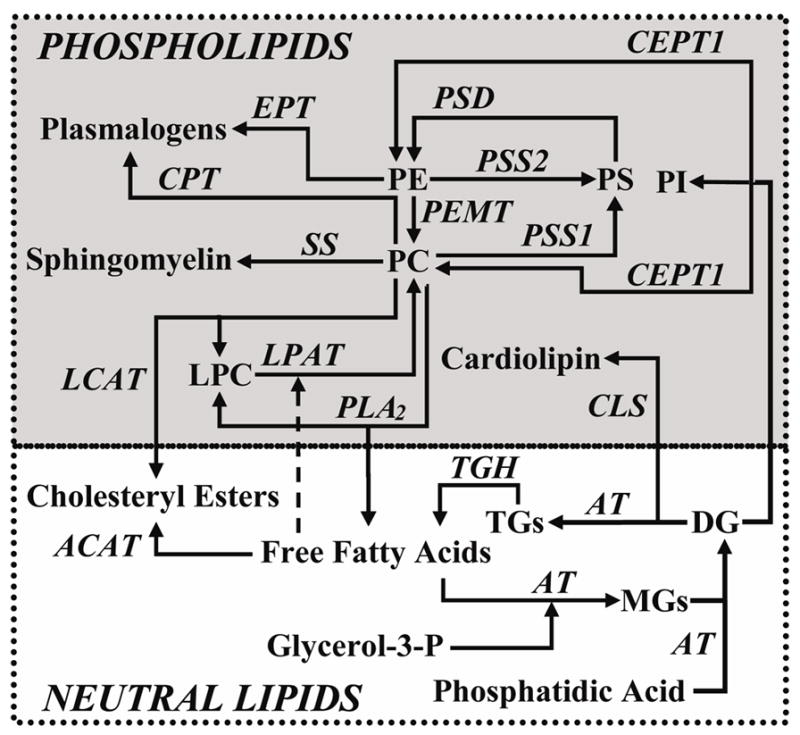
Overview of lipid metabolic pathways examined in this study. Abbreviations are as follows: EPT = ethanolamine-phosphotransferase; CEPT1 = choline/EPT-1; AT = acyltransferases; LPAT = lysophosphatidylcholine AT; PEMT = phosphatidylethanolamine methyl transferase; PSD = phosphatidylserine decarboxylase; PSS = phosphatidylserine synthase; CLS = cardiolipin synthase; SS = sphingomyelin synthase; PC = phosphatidylcholine; PE = phosphatidylethanolamine; PS = phosphatidylserine; PI = phosphatidylinostitol; MGs = monoacylglycerols; DGs = diacylglcerols; TGs = triacylglycerols;TGH = triacylglycerol hydrolase.
In the liver, a decrease in hepatic triglycerides was observed, a classic mammalian response to fibrate therapy (Karbowska et al., 1999). As expected for exposure to a SCD activator/inducer (Hamadeh et al., 2002; Miller and Ntambi, 1996), a redistribution of 16:0 and an increase of 16:1n7 and 18:1n7 synthesis was also observed with clofibrate exposure. When corrected for the 3:1 fatty acid:triglyceride molecular ratio, the decline in triglyceride SATs shown in Figure 2 constitutes ~95% of the total increase in hepatic SCD products appearing in other lipids. Since hepatic triacylglycerol hydrolase activity and expression are reportedly unaffected by clofibrate exposure (Dolinsky et al., 2003), the mechanism of this mobilization is unclear.
Products of the delta-5 and delta-6 desaturases were also expected to increase in the clofibrate exposed liver (Chen et al., 2000; Matsuzaka et al., 2002; Nakamura and Nara, 2004; Song He et al., 2002). While a change in total PUFAs was not observed, DHA levels in cardiolipin and phosphatidylserine/inositol were elevated in the liver (Figure 1 and Figure 3). The enrichment of phosphatidylserine/inositol in DHA would argue for a phosphatidylserine synthetase 2-dependent serine exchange reaction (Vincent et al., 2001). These types of phosphatidylethanolamine-dependent mechanisms are known to be enhanced in the liver of clofibrate exposed rats (Lenart et al., 1998).
Total cardiolipin concentrations in the liver did not change significantly (~8% increase), however, the concentration of MUFA-containing cardiolipin increased by ~65%. Specifically, 1.3- to 1.8-fold increases in the n3, n7 and n9 lipid subclasses of cardiolipin were observed in response to clofibrate treatment (Table 1). Cardiolipin is a primary component of mitochondrial membranes (Hatch, 1994; Schlame and Hostetler, 1997) formed from phosphatidylglycerol phosphate by cardiolipin synthase (Figure 5). PPARα activation stimulates cardiolipin degradation, and it has been postulated that phosphatidylglycerol phosphate synthase activation compensates for this loss, maintaining the cardiolipin pool size (Jiang et al., 2004). Newly formed cardiolipin consists of randomly incorporated acyl chains, which are later remodeled to a high linoleic acid content (Lee et al., 2006; Xu et al., 2003). Thus the enrichment of MUFAs in hepatic cardiolipin is consistent with the elevated level of SCD products in the liver glycerophospholipid pool and enhanced cardiolipin turnover (Table 1). The functional consequences of such changes in cardiolipin structure are unknown (Sparagna et al., 2005).
In contrast to the effects on the liver, glycerophospholipid biosynthesis and SCD-dependent metabolism were apparently unaffected in the heart, while triglycerides, free fatty acids, and sphingomyelins were influenced by treatment. Our findings are consistent with those observed in a cardiac-specific PPARα over-expressing mouse, which show elevated triglycerides, free fatty acids and ceremides (Finck et al., 2003; Finck, 2004). While only 2 of 5 fibrate treated animals showed elevated cardiac triglycerides, cardiac free fatty acids were elevated ~40–50% in all treated animals. Moreover, clofibrate treatment produced a ~35–40% decline in unsaturated sphingomyelins without changes in SAT-containing species (Figure 4). Due to the importance of sphingolipids in the regulation of cell growth (Cremesti et al., 2002) and cardiac contractility (Cailleret et al., 2004), confirmation of a link between fibrate exposure and cardiac sphingomyelinase activity warrants close consideration. Unlike the hepatic lipids, the relative distribution of SATS and MUFAs was unchanged in the heart. While the stable MUFA levels could indicate the presence of unresponsive cardiac SCD isoforms, PUFAs can also inhibit SCD expression (Miller and Ntambi, 1996) and cardiac PUFAs were elevated by clofibrate exposure (1.5-fold, Table 1)
In the brain, clofibrate exposure reduced the cholesterol esters content (Table 1) and remodeled the lipid components of the free fatty acids, cholesterol esters, and sphingomyelin pools (Table 1). It should be recognized, however, that PPARα is focally distributed within specific cerebral and cerebellar cell-types (Kainu et al., 1994) and that the reported results likely only hint at a more complex story. Clofibrate treatment decreased the relative abundance of free DHA by ~2-fold, while producing a ~20-fold and ~3-fold increase in the AA content of cholesterol esters and sphingomyelins, respectively. These changes are consistent with the linkage of cholesterol and PUFA metabolism in neural tissues (Haag, 2003) and a PPARα mediated inhibition of cholesterol ester biosynthesis (Chinetti et al., 2003). Another important observation was the enrichment of unsaturates in the brain sphingomyelin fraction, as opposed to the depletion of this same reservoir in the heart. Again, these effects of clofibrate on sphingomyelin metabolism are intriguing and deserve future focused effort.
As expected, the effects of clofibrate on white adipose tissue were minimal, with changes seen primarily in the free fatty acid and cholesterol ester pools. Clofibrate exposures elevated SAT free fatty acids along with slight increases in 24:0 and 24:1n9 in the triglyceride pool. While the total concentration of adipose cholesterol esters was unchanged, these lipids were depleted in SATs and enriched in MUFAs and PUFAs to a lesser extent. These results are quite distinct from those observed in the brain, suggesting that these two tissue types show a differential preference for these cholesterol ester subclasses.
Together, the reported results support various hypotheses from the literature, while providing novel insights into clofibrate-induced changes on lipid metabolism. We have found that clofibrate not only reduces hepatic triglycerides, but that this reduction is consistent with the use of the saturated component of this lipid pool to drive steroyl-CoA desaturase-dependent de novo MUFAs synthesis. These newly formed MUFAs are then accumulated in hepatic phosphatidylserine, consistent with the proliferation of peroxisomal membranes. In fact, the DHA component of phosphatidylserine/inositol increased in the liver, heart and brain (Figure 3), suggesting an activation of phosphatidylserine synthase 2 in each of these tissues (Figure 5). The elevation in cardiac free fatty acids is consistent with previous reports of PPARα activation enhancing mitochondrial β-oxidation and free fatty acid uptake in the heart. Moreover, the behavior of cardiolipin was consistent with reports of PPARα-dependent accelerations in cardiolipin turnover. In the brain, clofibrate exposure led to an increase in the AA content of phosphatidylserine/inositol, trigycerides, cholesterol esters, and sphingomyelin, suggesting effects on long chain fatty acid synthesis in this tissue, while only minor alterations in adipose lipids were observed, consistent with the low level of PPARα expression in this tissue. The most unexpected result reported here was evidence for a clofibrate-dependent impact on sphingomyelin metabolism in the heart and brain, findings which deserve closer attention. The data reported here suggest a number of interesting hypotheses for further investigation, demonstrating the hypothesis-generating utility of a lipidomics research approach.
Supplementary Material
Supplementary Data
Supplementary data include an excel file with quantitative values (nmol/g tissue) of all lipids measured in this study (Table S1 – S4) as well as a table with the scientific name, molecular name and common name of all fatty acids reported (Table S5).
Acknowledgments
The authors thank Raymond Wan and Hiroshi Mamitsuka for many useful discussions. C.E.W. was supported by a Japanese Society for the Promotion of Science (JSPS) post-doctoral fellowship and NIH post-doctoral training grant T32 DK07355-22. This work was supported in part by NIH/NIEHS R01 ES013933, NIEHS Grant R37 ES02710, NIEHS Superfund Grant P42 ES04699, and NIEHS Center for Environmental Health Sciences Grant P30 ES05707. The authors thank Alan Buckpitt, Dexter Morin, Ryan Davis, David Lawson and C.J. Dillard for technical assistance.
References
- Cailleret M, Amadou A, Andrieu-Abadie N, Nawrocki A, Adamy C, Ait-Mamar B, Rocaries F, Best-Belpomme M, Levade T, Pavoine C, Pecker F. N-acetylcysteine prevents the deleterious effect of tumor necrosis factor-(alpha) on calcium transients and contraction in adult rat cardiomyocytes. Circulation. 2004;109:406–11. doi: 10.1161/01.CIR.0000109499.00587.FF. [DOI] [PubMed] [Google Scholar]
- Chen C, Hennig GE, Whiteley HE, Corton JC, Manautou JE. Peroxisome proliferator-activated receptor alpha-null mice lack resistance to acetaminophen hepatotoxicity following clofibrate exposure. Toxicol Sci. 2000;57:338–44. doi: 10.1093/toxsci/57.2.338. [DOI] [PubMed] [Google Scholar]
- Chinetti G, Lestavel S, Fruchart JC, Clavey V, Staels B. Peroxisome proliferator-activated receptor alpha reduces cholesterol esterification in macrophages. Circ Res. 2003;92:212–7. doi: 10.1161/01.res.0000053386.46813.e9. [DOI] [PubMed] [Google Scholar]
- Cook WS, Yeldandi AV, Rao MS, Hashimoto T, Reddy JK. Less extrahepatic induction of fatty acid beta-oxidation enzymes by PPAR alpha. Biochem Biophys Res Commun. 2000;278:250–7. doi: 10.1006/bbrc.2000.3739. [DOI] [PubMed] [Google Scholar]
- Cremesti AE, Goni FM, Kolesnick R. Role of sphingomyelinase and ceramide in modulating rafts: do biophysical properties determine biologic outcome? FEBS Lett. 2002;531:47–53. doi: 10.1016/s0014-5793(02)03489-0. [DOI] [PubMed] [Google Scholar]
- Cullingford TE, Dolphin CT, Sato H. The peroxisome proliferator-activated receptor alpha-selective activator ciprofibrate upregulates expression of genes encoding fatty acid oxidation and ketogenesis enzymes in rat brain. Neuropharmacology. 2002;42:724–30. doi: 10.1016/s0028-3908(02)00014-x. [DOI] [PubMed] [Google Scholar]
- Delerive P, De Bosscher K, Besnard S, Vanden Berghe W, Peters JM, Gonzalez FJ, Fruchart JC, Tedgui A, Haegeman G, Staels B. Peroxisome proliferator-activated receptor alpha negatively regulates the vascular inflammatory gene response by negative crosstalk with transcription factors NF-kappaB and AP-1. J Biol Chem. 1999;274:32048–54. doi: 10.1074/jbc.274.45.32048. [DOI] [PubMed] [Google Scholar]
- Dolinsky VW, Gilham D, Hatch GM, Agellon LB, Lehner R, Vance DE. Regulation of triacylglycerol hydrolase expression by dietary fatty acids and peroxisomal proliferator-activated receptors. Biochim Biophys Acta. 2003;1635:20–8. doi: 10.1016/j.bbalip.2003.09.007. [DOI] [PubMed] [Google Scholar]
- Escher P, Braissant O, Basu-Modak S, Michalik L, Wahli W, Desvergne B. Rat PPARs: quantitative analysis in adult rat tissues and regulation in fasting and refeeding. Endocrinology. 2001;142:4195–202. doi: 10.1210/endo.142.10.8458. [DOI] [PubMed] [Google Scholar]
- Finck BN. The role of the peroxisome proliferator-activated receptor alpha pathway in pathological remodeling of the diabetic heart. Curr Opin Clin Nutr Metab Care. 2004;7:391–6. doi: 10.1097/01.mco.0000134371.70815.32. [DOI] [PubMed] [Google Scholar]
- Finck BN, Han X, Courtois M, Aimond F, Nerbonne JM, Kovacs A, Gross RW, Kelly DP. A critical role for PPARalpha-mediated lipotoxicity in the pathogenesis of diabetic cardiomyopathy: modulation by dietary fat content. Proc Natl Acad Sci U S A. 2003;100:1226–31. doi: 10.1073/pnas.0336724100. [DOI] [PMC free article] [PubMed] [Google Scholar]
- Folch J, Lees M, Sloane Stanley GH. A simple method for the isolation and purification of total lipides from animal tissues. J Biol Chem. 1957;226:497–509. [PubMed] [Google Scholar]
- Fruchart JC, Duriez P, Staels B. Peroxisome proliferator-activated receptor-alpha activators regulate genes governing lipoprotein metabolism, vascular inflammation and atherosclerosis. Curr Opin Lipidol. 1999;10:245–57. doi: 10.1097/00041433-199906000-00007. [DOI] [PubMed] [Google Scholar]
- Haag M. Essential fatty acids and the brain. Can J Psychiatry. 2003;48:195–203. doi: 10.1177/070674370304800308. [DOI] [PubMed] [Google Scholar]
- Hamadeh HK, Bushel PR, Jayadev S, Martin K, DiSorbo O, Sieber S, Bennett L, Tennant R, Stoll R, Barrett JC, Blanchard K, Paules RS, Afshari CA. Gene expression analysis reveals chemical-specific profiles. Toxicol Sci. 2002;67:219–31. doi: 10.1093/toxsci/67.2.219. [DOI] [PubMed] [Google Scholar]
- Hatch GM. Cardiolipin biosynthesis in the isolated heart. Biochem J. 1994;297(Pt 1):201–8. doi: 10.1042/bj2970201. [DOI] [PMC free article] [PubMed] [Google Scholar]
- Hauser R, Meeker JD, Park S, Silva MJ, Calafat AM. Temporal variability of urinary phthalate metabolite levels in men of reproductive age. Environ Health Perspect. 2004;112:1734–40. doi: 10.1289/ehp.7212. [DOI] [PMC free article] [PubMed] [Google Scholar]
- Hauser R, Williams P, Altshul L, Calafat AM. Evidence of interaction between polychlorinated biphenyls and phthalates in relation to human sperm motility. Environ Health Perspect. 2005;113:425–30. doi: 10.1289/ehp.7305. [DOI] [PMC free article] [PubMed] [Google Scholar]
- Jiang YJ, Lu B, Xu FY, Gartshore J, Taylor WA, Halayko AJ, Gonzalez FJ, Takasaki J, Choy PC, Hatch GM. Stimulation of cardiac cardiolipin biosynthesis by PPARalpha activation. J Lipid Res. 2004;45:244–52. doi: 10.1194/jlr.M300314-JLR200. [DOI] [PubMed] [Google Scholar]
- Kainu T, Wikstrom AC, Gustafsson JA, Pelto-Huikko M. Localization of the peroxisome proliferator-activated receptor in the brain. Neuroreport. 1994;5:2481–5. doi: 10.1097/00001756-199412000-00019. [DOI] [PubMed] [Google Scholar]
- Karbowska J, Kochan Z, Zelewski L, Swierczynski J. Tissue-specific effect of clofibrate on rat lipogenic enzyme gene expression. Eur J Pharmacol. 1999;370:329–36. doi: 10.1016/s0014-2999(99)00129-6. [DOI] [PubMed] [Google Scholar]
- Kersten S, Desvergne B, Wahli W. Roles of PPARs in health and disease. Nature. 2000;405:421–4. doi: 10.1038/35013000. [DOI] [PubMed] [Google Scholar]
- Klaus S. Adipose tissue as a regulator of energy balance. Curr Drug Targets. 2004;5:241–50. doi: 10.2174/1389450043490523. [DOI] [PubMed] [Google Scholar]
- Kliewer SA, Xu HE, Lambert MH, Willson TM. Peroxisome proliferator-activated receptors: from genes to physiology. Recent Prog Horm Res. 2001;56:239–63. doi: 10.1210/rp.56.1.239. [DOI] [PubMed] [Google Scholar]
- Latini G, De Felice C, Verrotti A. Plasticizers, infant nutrition and reproductive health. Reprod Toxicol. 2004;19:27–33. doi: 10.1016/j.reprotox.2004.05.011. [DOI] [PubMed] [Google Scholar]
- Lee HJ, Mayette J, Rapoport SI, Bazinet RP. Selective remodeling of cardiolipin fatty acids in the aged rat heart. Lipids Health Dis. 2006;5:2. doi: 10.1186/1476-511X-5-2. [DOI] [PMC free article] [PubMed] [Google Scholar]
- Lenart J, Komanska I, Jasinska R, Pikula S. The induction of cytochrome P450 isoform, CYP4A1, by clofibrate coincides with activation of ethanolamine-specific phospholipid base exchange reaction in rat liver microsomes. Acta Biochim Pol. 1998;45:119–26. [PubMed] [Google Scholar]
- Linton MF, Fazio S. Re-emergence of fibrates in the management of dyslipidemia and cardiovascular risk. Curr Atheroscler Rep. 2000;2:29–35. doi: 10.1007/s11883-000-0092-2. [DOI] [PubMed] [Google Scholar]
- Maloney EK, Waxman DJ. trans-Activation of PPARalpha and PPARgamma by structurally diverse environmental chemicals. Toxicol Appl Pharmacol. 1999;161:209–18. doi: 10.1006/taap.1999.8809. [DOI] [PubMed] [Google Scholar]
- Marx N, Duez H, Fruchart JC, Staels B. Peroxisome proliferator-activated receptors and atherogenesis: regulators of gene expression in vascular cells. Circ Res. 2004;94:1168–78. doi: 10.1161/01.RES.0000127122.22685.0A. [DOI] [PubMed] [Google Scholar]
- Matsuzaka T, Shimano H, Yahagi N, Amemiya-Kudo M, Yoshikawa T, Hasty AH, Tamura Y, Osuga J, Okazaki H, Iizuka Y, Takahashi A, Sone H, Gotoda T, Ishibashi S, Yamada N. Dual regulation of mouse Delta(5)- and Delta(6)-desaturase gene expression by SREBP-1 and PPARalpha. J Lipid Res. 2002;43:107–14. [PubMed] [Google Scholar]
- Michalik L, Desvergne B, Wahli W. Peroxisome-proliferator-activated receptors and cancers: complex stories. Nat Rev Cancer. 2004;4:61–70. doi: 10.1038/nrc1254. [DOI] [PubMed] [Google Scholar]
- Miller CW, Ntambi JM. Peroxisome proliferators induce mouse liver stearoyl-CoA desaturase 1 gene expression. Proc Natl Acad Sci U S A. 1996;93:9443–8. doi: 10.1073/pnas.93.18.9443. [DOI] [PMC free article] [PubMed] [Google Scholar]
- Mortensen GK, Main KM, Andersson AM, Leffers H, Skakkebaek NE. Determination of phthalate monoesters in human milk, consumer milk, and infant formula by tandem mass spectrometry (LC-MS-MS) Anal Bioanal Chem. 2005;382:1084–92. doi: 10.1007/s00216-005-3218-0. [DOI] [PubMed] [Google Scholar]
- Nakamura MT, Nara TY. Structure, function, and dietary regulation of delta6, delta5, and delta9 desaturases. Annu Rev Nutr. 2004;24:345–76. doi: 10.1146/annurev.nutr.24.121803.063211. [DOI] [PubMed] [Google Scholar]
- Nemali MR, Usuda N, Reddy MK, Oyasu K, Hashimoto T, Osumi T, Rao MS, Reddy JK. Comparison of constitutive and inducible levels of expression of peroxisomal beta-oxidation and catalase genes in liver and extrahepatic tissues of rat. Cancer Res. 1988;48:5316–24. [PubMed] [Google Scholar]
- Otake T, Yoshinaga J, Yanagisawa Y. Exposure to phthalate esters from indoor environment. J Expo Anal Environ Epidemiol. 2004;14:524–8. doi: 10.1038/sj.jea.7500352. [DOI] [PubMed] [Google Scholar]
- Reddy JK. Peroxisome proliferators and peroxisome proliferator-activated receptor alpha: biotic and xenobiotic sensing. Am J Pathol. 2004;164:2305–21. doi: 10.1016/s0002-9440(10)63787-x. [DOI] [PMC free article] [PubMed] [Google Scholar]
- Schlame M, Hostetler KY. Cardiolipin synthase from mammalian mitochondria. Biochim Biophys Acta. 1997;1348:207–13. doi: 10.1016/s0005-2760(97)00119-7. [DOI] [PubMed] [Google Scholar]
- Schmitz G, Langmann T. Pharmacogenomics of cholesterol-lowering therapy. Vascul Pharmacol. 2006;44:75–89. doi: 10.1016/j.vph.2005.07.012. [DOI] [PubMed] [Google Scholar]
- Song He W, Nara TY, Nakamura MT. Delayed induction of delta-6 and delta-5 desaturases by a peroxisome proliferator. Biochem Biophys Res Commun. 2002;299:832–8. doi: 10.1016/s0006-291x(02)02743-2. [DOI] [PubMed] [Google Scholar]
- Sparagna GC, Johnson CA, McCune SA, Moore RL, Murphy RC. Quantitation of cardiolipin molecular species in spontaneously hypertensive heart failure rats using electrospray ionization mass spectrometry. J Lipid Res. 2005;46:1196–204. doi: 10.1194/jlr.M500031-JLR200. [DOI] [PubMed] [Google Scholar]
- Thorne PC, Byers DM, Palmer FB, Cook HW. Clofibrate and other peroxisomal proliferating agents relatively specifically inhibit synthesis of ethanolamine phosphoglycerides in cultured human fibroblasts. Biochim Biophys Acta. 1994;1214:161–70. doi: 10.1016/0005-2760(94)90040-x. [DOI] [PubMed] [Google Scholar]
- Vincent P, Maneta-Peyret L, Cassagne C, Moreau P. Phosphatidylserine delivery to endoplasmic reticulum-derived vesicles of plant cells depends on two biosynthetic pathways. FEBS Lett. 2001;498:32–6. doi: 10.1016/s0014-5793(01)02475-9. [DOI] [PubMed] [Google Scholar]
- Watkins SM, Reifsnyder PR, Pan HJ, German JB, Leiter EH. Lipid metabolome-wide effects of the PPARgamma agonist rosiglitazone. J Lipid Res. 2002;43:1809–17. doi: 10.1194/jlr.m200169-jlr200. [DOI] [PubMed] [Google Scholar]
- Xu Y, Kelley RI, Blanck TJ, Schlame M. Remodeling of cardiolipin by phospholipid transacylation. J Biol Chem. 2003;278:51380–5. doi: 10.1074/jbc.M307382200. [DOI] [PubMed] [Google Scholar]
- Zambon A, Gervois P, Pauletto P, Fruchart JC, Staels B. Modulation of Hepatic Inflammatory Risk Markers of Cardiovascular Diseases by PPAR-{alpha} Activators. Clinical and Experimental Evidence. Arterioscler Thromb Vasc Biol. 2006 doi: 10.1161/01.ATV.0000204327.96431.9a. [DOI] [PubMed] [Google Scholar]
Associated Data
This section collects any data citations, data availability statements, or supplementary materials included in this article.
Supplementary Materials
Supplementary Data
Supplementary data include an excel file with quantitative values (nmol/g tissue) of all lipids measured in this study (Table S1 – S4) as well as a table with the scientific name, molecular name and common name of all fatty acids reported (Table S5).