

Abstract
The nucleation processes involved in calcium phosphate formation in tooth enamel are not well understood but are believed to involve proteins in the extracellular matrix. The ability of one enamel protein, amelogenin, to promote the nucleation and growth of calcium phosphate was studied in an in vitro system involving metastable supersaturated solutions. It was found that recombinant amelogenin (rM179 and rp(H)M180) promoted the nucleation of calcium phosphate compared to solutions without protein. The amount of calcium phosphate increased with increasing supersaturation of the solutions and increasing protein concentrations up to 6.5 μg/mL. At higher protein concentrations, the amount of calcium phosphate decreased. The kinetics of nucleation was studied in situ and in real time using a quartz crystal microbalance (QCM) and showed that the protein reduced the induction time for nucleation compared to solutions without protein. This work shows a nucleation role for amelogenin in vitro which may be promoted by the association of amelogenin into nanosphere templates, exposing charged functionality at the surface.
Keywords: A1. Nucleation, A2. Amelogenin, A3. Hydroxyapatite, A4. Enamel
1. Introduction
Heterogeneous nucleation is of great importance in the biomineralization of bone, teeth, and mollusk shells, but the factors that cause nucleation are not well known [1]. It is generally agreed that proteins play a vital role in the nucleation of these materials, however, the specific proteins involved are often not identified. Enamel is an example of a biomineral system with a nucleation mechanism that is not well understood. Enamel is one of the most highly ordered biominerals, composed of elongated hydroxyapatite crystals assembled into prisms [2]. Unlike bone, enamel does not have a structural matrix like collagen and it is not remodeled. The nucleation and growth of enamel is believed to be controlled and modulated by proteins secreted by ameloblasts in the inner enamel epithelium which disappear after mineralization is complete, leaving a structure with high inorganic content and high mechanical hardness.
Amelogenin, a hydrophobic protein with most of the charged amino acids located in the N- and C-termini, constitutes 90% of the protein present during enamel formation [2]. In spite of its prominence in developing enamel, the function of amelogenin is not completely understood. Roles in nucleation, growth, regulation of crystal size and shape, and control of crystal–crystal aggregation have been proposed [2–5]. Amelogenin is unique in that it self-assembles into nanospheres, supra-molecular structures observed in vitro [6–8] and in vivo [7,9] which are believed to be critical to the function of the protein. Several in vivo studies using antisense mice [10], knock out mice [11], transgenic mice [12], and hammerhead ribozymes [13] have investigated the role of amelogenin in regulating enamel nucleation and growth. These studies have shown reduced mineralization in the absence of amelogenin or when amelogenin mutants did not form nanospheres. Although these studies demonstrate that amelogenin is necessary for proper enamel formation, a specific role for amelogenin as nucleator or growth controller has not been determined.
A number of in vitro studies have been undertaken to elucidate possible roles for amelogenin. It has been found that amelogenin can affect the growth and crystal habit of calcium phosphate by adsorbing onto specific faces of growing seed crystals [5,14,15]. Studies have suggested that the charged amino acids in the C-terminal domain are exposed at the nanosphere surface, promoting amelogenin–calcium phosphate interactions [16]. Recent studies using solid-state NMR [17] and neutron reflectivity and molecular modeling [18] determined that the hydrophilic C-terminus was oriented next to the hydroxyapatite surface, providing direct evidence that the C-terminus of amelogenin is positioned to exert control over crystal growth.
Although a great deal of experimental effort has been focused on the role of amelogenin in affecting the growth of calcium phosphate crystals, there have been very few in vitro studies to examine possible roles for amelogenin in nucleation processes [19,20], and these studies showed no nucleation in a gel matrix. We report in vitro studies on the nucleation and growth of calcium phosphate by recombinant mouse amelogenin from aqueous solution. Amelogenin promoted the heterogeneous nucleation of calcium phosphate from metastable solutions supersaturated with respect to OCP and HAP. The amounts precipitated depended on the solution supersaturation and protein concentration. The kinetics of nucleation was studied in real time using a quartz crystal microbalance (QCM). This work has importance in developing an understanding of the possible functions of proteins involved in biomineralization processes such as enamel formation.
2. Experimental methods
2.1. Protein synthesis and purification
Recombinant mouse amelogenin, rM179, was prepared as previously described [21]. The protein rp(H)M180, identical to the recombinant protein rM179 with the addition of an N-terminal tag (RGSHHHHHHGS) utilized for protein isolation (Table 1), was synthesized and purified by Veritas (Rockville, MD) as described previously [8], using a construct provided by M. Snead. Upon receipt, the protein was subsequently dialyzed extensively against water to remove any residual salts. Protein concentrations were standardized using uv-visible spectroscopy, calibrated from a standard solution whose concentration was determined using AAA (amino acid analysis) (AAA Services Laboratory, Boring, OR).
Table 1.
Amino acid sequences for recombinant mouse amelogenin rM179 and rp(H)M180 used in the studies
| rM179 | PLPPHPGSPGYINLSYEVLTPLKWYQSMIRQPYPSYGYEPMGGWLHHQII
PVLSQQHPPSHTLQPHHHLPVVPAQQPVAPQQPMMPVPGHHSMTPTQHH QPNIPPSAQQPFQQPFQPQAIPPQSHQPMQPQSPLHPMQPLAPQPPLPPLFS MQPLSPILPELPLEAWPATDKTKREEVD |
| rp(H)M180 | RGSHHHHHHGS-(rM179) |
Charged amino acids are in “bold” typeface.
2.2. Supersaturated solution preparation
Supersaturated solutions were prepared from standardized stock solutions as described previously [22] and contained 1.8–2.2 mM CaCl2 · 2H2O, KH2PO4 so that the calcium to phosphate ratio was 1.67, with the NaCl concentration adjusted to yield a total ionic strength of 0.15 M. Supersaturations were calculated with respect to hydroxyapatite (HAP; Ca10(PO4)6(OH)2), octacalcium phosphate (OCP; Ca8H2(PO4)6 · 5H2O), tricalcium phosphate (TCP; Ca3(PO4)2), an/d brushite (DCPD; Ca-PO3(OH) · 2H2O) as described elsewhere [22]. Stock solutions were added to deionized water in the order NaCl, CaCl2 · 2H2O, and KH2PO4 to reduce artifact precipitate formation. Solutions were bubbled with nitrogen to exclude CO2, the pH was adjusted to pH 7.4 by addition of KOH, and the solutions were filtered through 0.22 μm filters. Proteins (rp(H)M180 and rM179) were dissolved in 0.01 M HCl (1 mg protein/100 μL HCl), diluted with the calcium phosphate solutions, and adjusted to pH 7.4. Protein concentrations of 0.065, 0.65, 6.5, 32.5, 65, and 130 μg/mL were investigated.
The solutions with protein and controls without protein were placed into vials (4 mL, high-density polyethylene Nalgene) and filled completely to exclude CO2. Substrates composed of COOH and CH3 terminated self-assembled monolayers on gold were also exposed to solutions without protein. The vials were heated to 37 °C for various time periods and were monitored for pH decreases which are diagnostic for calcium phosphate precipitation. Solutions were removed, cooled, filtered through 0.22 μm filters (Isopore, Millipore), and washed with water. For some samples, calcium phosphate particles were resuspended in water and centrifuged onto gold-coated glass substrates for XRD analysis. The filtrate was analyzed for changes in calcium and phosphate concentrations by ion-coupled plasma spectroscopy (ICP) and the filters were examined by field-emission scanning electron microscopy (FESEM) and energy-dispersive spectroscopy (EDS). In addition to calcium concentration changes, the amount of calcium phosphate nucleated was expressed in terms of a particle number density (particles per mL). Particle densities were obtained by converting the calcium concentration changes to the concentration of OCP formed (mg/mL) divided by the mass per particle (mg/particle). The mass per particle was determined by measuring the average particle diameter and multiplying the volume per particle (assuming spherical particles) by the density of OCP. It should be pointed out that this results in an approximation for the number density, since the particles have substructures and are not completely dense. Varying the density to account for the particle porosity resulted in no changes in the relative particle densities. Calcium changes and particle densities are reported as mean ± standard deviation for triplicate samples. Experiments were replicated numerous times with several protein batches, both glass and plastic vials and multiple researchers.
2.3. QCM
A quartz crystal oscillator housed in a Teflon probe (TPS-550 Maxtek) was connected to a power supply and a frequency counter (Stanford Research Instruments) using a triaxial cable as described previously [22]. Data were collected from the frequency counter using a GPIB interface and a data collection and graphing program written in C. An AT-cut quartz crystal (1 in diameter) with gold electrodes was placed onto an O-ring in a receptacle in the probe so that the electrodes made contact with gold pins. A flow cell (0.1 mL volume) was screwed into the probe (Maxtek). Supersaturated solutions in 4 mL plastic vials were continuously flowed into the cell via Teflon tubing and returned to the vial using a peristaltic pump. Continuous flow from the vial solution was used to increase the amount of deposition on the surface. The QCM probe and vial were placed into water heated to 37 °C in a jacketed beaker. Resonance frequency data were collected every 20 s by signal averaging 5–10 measurements with a 1 s gate time per measurement. There was an initial 20 min warm up period for temperature equilibration and some protein adsorption until a relatively stable baseline frequency was achieved. There was a small upward drift in frequency during the initial induction period due to stresses on the crystal so this data was normalized to zero. Decreases in resonance frequency were attributed to changes in mass due to calcium phosphates precipitated in the cell and vial and adsorbed onto the quartz crystal and were converted to ng/cm2 by the Sauerbrey equation [23]. The raw mass data is presented and shows some noise due to the pulsing action of the peristaltic pump.
2.4. Calcium phosphate characterization
Glancing incidence X-ray diffraction (GIXRD) data was obtained using a Philips X’Pert MPD system (PW 3040/00 type) with a vertical θ–θ goniometer (220 mm radius) and a fixed-anode (Cu LFF) sealed ceramic tube X-ray source operated at 40 kV, 50 mA (2.0 kW). The incident beam was fixed at a grazing incidence (Ω) of 5.0°, and the scan axis was 2θ. Spectra were taken at rates of 0.05° per 2 s and 0.05° per 60 s. Images of particles were obtained using a LEO 982 FESEM operating at a resolution of 1 nm at 30 kV and 4 nm at 1.0 kV. The scope was operated at 3 kV and most of the pictures were taken with the below-lens (ET) secondary electron detector. A few images were mixed signals from the ET and in-lens secondary electron detector.
3. Results
3.1. Nucleation and growth of calcium phosphate
Recombinant mouse amelogenin rM179 and rp(H)M180, a protein which is identical to rM179 with the addition of a histidine tag, as shown in Table 1, were utilized for nucleation studies. Amelogenin-containing solutions supersaturated with respect to calcium phosphate were heated to 37 °C for various time periods from 24 h up to 5 days. Identical solutions were prepared and studied immediately by atomic force microscopy (AFM) and were found to contain amelogenin nanospheres. Solutions were supersaturated with respect to the equilibrium phase HAP and the more soluble metastable phases OCP and TCP, but undersaturated with respect to dicalcium phosphate dihydrate (DCPD). The relative supersaturation, σ, was varied from 1.90 to 2.41 for OCP and 15.40 to 18.50 for HAP. The relative supersaturation, σ, is related to the supersaturation, S, by the equation, σ = S–1. Precipitation of calcium phosphate was evidenced by a reduction in calcium concentration in the solutions containing protein but not in control solutions without protein, as shown in Table 2. The formation of calcium phosphate in the presence of protein was also evidenced by a decrease in the pH of the solutions compared to the control solutions. As a further control, calcium phosphate nucleation was promoted from these solutions onto COOH-terminated self-assembled monolayers but was not observed in the presence of CH3-terminated self-assembled monolayers, as expected.
Table 2.
Changes in calcium concentration due to calcium phosphate formation and solution pH in 6.5 μg/ml protein solutions at various relative supersaturations, σ, after 42 h
| Total CaCl2 (mM) | Protein | σOCP | σHAP | Calcium change (mM) | Initial pH | Final pH |
|---|---|---|---|---|---|---|
| 2.2 | — | 2.41 | 18.50 | 0 | 7.41 | 7.27 |
| 2.2 | rM179 | 2.41 | 18.50 | 0.434±0.010 | 7.41 | 6.55 |
| 2.2 | rp(H)M180 | 2.41 | 18.50 | 0.424±0.011 | 7.43 | 6.55 |
| 2.0 | rp(H)M180 | 2.15 | 17.10 | 0.335±0.011 | 7.43 | 6.72 |
| 1.8 | rp(H)M180 | 1.90 | 15.60 | 0.083±0.006 | 7.42 | 7.21 |
Table 2 shows that calcium phosphate was formed in 2.2 mM calcium solutions containing the histidine-tagged rp(H)M180 as well as rM179, with no significant difference in amounts. The effect of supersaturation on amounts of calcium phosphate precipitated in solutions containing 6.5 μg/mL rp(H)M180 was also examined. Increasing the solution supersaturation resulted in increasing amounts of calcium phosphate formed and decreasing final solution pH (Table 2).
The effect of protein concentration on the amount of calcium phosphate formed was examined in 2.2 mM calcium solutions. Fig. 1 shows that the amount precipitated, as evidenced by changes in calcium concentration, increased with increasing concentration of protein solution up to 6.5 μg/mL and then decreased as the protein concentration was increased up to 130 μg/mL. The amounts of calcium phosphate formed were also expressed in terms of the number density of particles nucleated. The particle density data also shows a maximum at 6.5 μg/mL.
Fig. 1.

Change in (a) calcium concentration and (b) particle density for nucleation from 2.2 mM CaCl2 · 2H2O solutions as a function of protein concentration after 24 h.
3.2. Calcium phosphate morphology and phase
Fig. 2 shows FESEM images of calcium phosphate particles recovered by filtration from both control solutions and protein-containing solutions. Fig. 2a shows that there were very few visible crystals formed in the 2.2 mM calcium control solutions (not containing protein). In general, no crystals or very few crystals were observed in the control solutions. Fig. 2b shows particles nucleated in solutions containing 2.2 mM calcium solutions and 0.065 μg/mL rp(H)M180 amelogenin after 24 h. The particles are spherical and contain plate-like substructures. The average particle size is ~47 μm. Fig. 2c shows particles formed in 2.2 mM calcium solutions containing 0.65 μg/mL rp(H)M180 amelogenin. The particles are more numerous and smaller (~32 μm in diameter) than crystals formed in the 0.065 μg/mL amelogenin solutions. Even higher numbers of particles (3–6 μm in diameter) were formed in solutions containing 6.5 μg/mL rp(H)M180 amelogenin as shown in Fig. 2d. Very few particles were formed in the 65 μg/mL protein solutions shown in Fig. 2e and they were ~44 μm in diameter. In general, the particle sizes varied inversely with precipitated amounts. For example, the 2.2 mM calcium solutions that had the most calcium phosphate formed (at 6.5 μg/mL protein) had the smallest particle sizes (3–6 μm) compared to solutions that had the least amount of calcium phosphate formed (e.g. 0.065, 0.65, 65, 130 μg/mL) that had the largest particle sizes (30–50 μm). These trends also occurred for the studies showing calcium phosphate nucleated from 6.5 μg/mL solutions at various solution supersaturations shown in Table 2. Here, the solutions with the most calcium phosphate formed from 2.2 mM calcium solutions had the smallest particle sizes (3–6 μm) compared to the solutions with the least calcium phosphate formed at lower supersaturations. Fig. 2f shows an image of calcium phosphate particles formed from 2.2 mM calcium solutions containing 6.5 μg/mL rM179 amelogenin. The morphology and size of the particles are similar to the particles formed in solutions containing rp(H)M180. The higher magnification image shows the similar plate-like substructures.
Fig. 2.
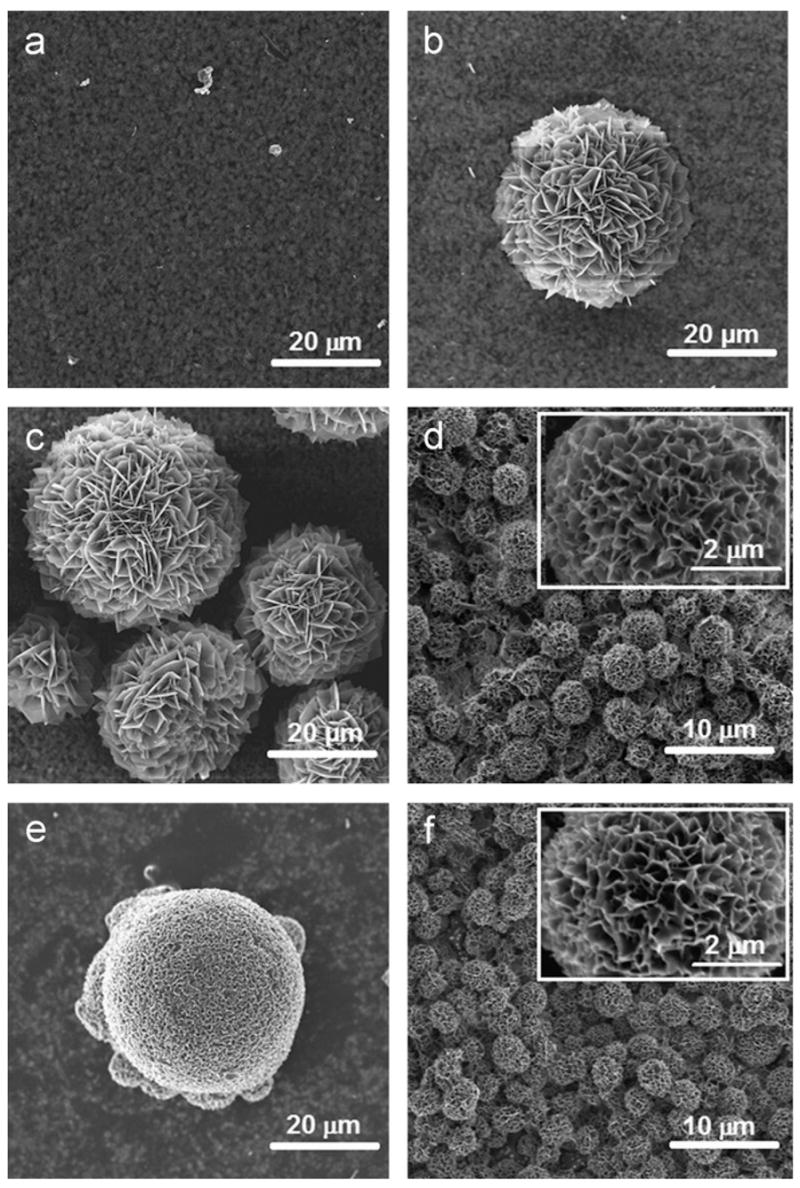
FESEM images of calcium phosphate formed from 2.2 mM CaCl2 · 2H2O solutions after 24 h containing (a) no amelogenin, (b) 0.065 μg/mL rp(H)M180, (c) 0.65 μg/mL rp(H)M180, (d) 6.5 μg/mL rp(H)M180, (e) 65 μg/mL rp(H)M180, and (f) 6.5 μg/mL rM179 (parts (d) and (f) and their insets show the similarity in size, density, and morphology of the rp(H)M180 and rM179 grown under identical conditions). Controls showed essentially no calcium phosphate growth, consistent with ICP and pH measurements. The maximum nucleation occurred at 6.5 μg/mL, yielding the highest nucleation density and smallest particle size.
Fig. 3 shows GIXRD data for the calcium phosphate particles from 6.5 μg/mL rp(H)M180 in 2.2 mM calcium solutions after 2 days, collected onto a silicon substrate coated with gold. Diffraction patterns were collected from 3° two theta (2Θ) in order to screen for the low-angle (0 1 0) reflection of OCP at 4.72°. The spectrum indicates that the particles are OCP as indicated by the (0 1 0) reflection at 4.72 as well as the (0 0 2) reflection at 26° and reflections around 32°. Particles examined after longer time periods (5 days) showed a small (1 0 0) peak for HAP at 10.8° indicating some transformation to HAP at longer time periods.
Fig. 3.
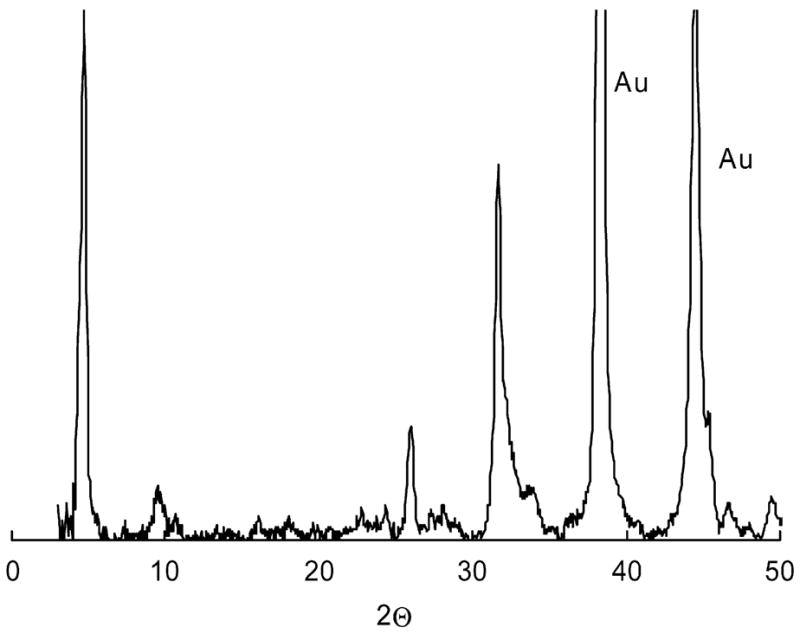
Glancing angle X-ray diffraction spectra of calcium phosphate formed from 2.2 mM CaCl2 · 2H2O solutions, 6.5 μg/mL amelogenin solutions after 40 h.
3.3. Nucleation and growth kinetics by QCM
The real-time kinetics of nucleation and growth for 6.5 and 65 μg/mL amelogenin solutions in 2.2 mM calcium solutions were studied using an in situ QCM and are shown in Fig. 4. Supersaturated solutions containing protein were introduced into a flow cell attached to the microbalance probe. There was no significant deposition onto the quartz crystal surface for an initial induction period. After an induction time of around 8 h for the 6.5 μg/mL protein solutions, frequency decreases occurred due to deposition onto the surface. Fig. 4 shows that an induction time for deposition was also observed for the 65 μg/mL protein solutions but in this case it was longer, around 17 h. The growth region was linear with time for both protein concentrations. The deposition represents the adsorption and growth of calcium phosphate crystals flowing in from the sample vial. Deposition of calcium phosphate was confirmed by FESEM observation of crystals on the surface. There was no significant deposition of calcium phosphate from 2.2 mM solutions without protein over the same time period.
Fig. 4.

Kinetics of deposition of calcium phosphate from 2.2 mM CaCl2 · 2H2O solutions containing 6.5 and 65 μg/mL amelogenin using a quartz crystal microbalance.
4. Discussion
4.1. Nucleation behavior
Our studies showed that amelogenin (rp(H)M180 and rM179) promoted the heterogeneous nucleation of calcium phosphate from metastable supersaturated solutions. Nucleation and then growth of the nuclei was evidenced by decreases in calcium and phosphorus concentration in filtered solutions (Table 2 and Fig. 1), decreases in solution pH which are indicative of calcium phosphate precipitation (Fig. 1), observation of nucleated particles consistent with OCP by FESEM (Fig. 3), and QCM data (Fig. 4). In all cases, no significant nucleation occurred in control solutions without protein, indicating that there was no homogeneous nucleation in the solutions and that the protein promoted heterogeneous nucleation. Nucleation from rM179 was similar to nucleation from rp(H)M180 amelogenin in amounts of calcium phosphate formed, particle sizes, particle morphologies, and phase. This indicates that the histidine tag attached to rp(H)M180 had no significant effect on nucleation behavior. Further studies were done using rp(H)M180 because the tagging enhanced protein isolation, significantly increasing the amount of protein available for experimentation.
Expressions for the inverse of the induction time for nucleation, τ (Eq. (1)), and for the nucleation density, N (Eq. (2)), are given by classical nucleation theory as
| (1) |
and
| (2) |
where ΔG* is the activation energy for nucleation, Ω is a preexponential factor, γ is the interfacial tension for formation of the critical nucleus, S is the solution supersaturation, β is a shape factor, ν is the molecular volume, and A and B are constants. The QCM data in Fig. 4 shows that there was an induction time period for the formation of nuclei in solution in the presence of protein. This period is typical of nucleation and growth behavior and occurs because of the activation energy required for nucleation, ΔG*, which depends upon the interfacial tension for formation of the critical nucleus, γ, and the solution supersaturation, S. Both Eqs. (1) and (2) predict that the induction time is reduced and the nucleation density is increased by lowering the calcium phosphate solution interfacial tension, γ. The promotion of heterogeneous nucleation in the presence of amelogenin indicates that the protein reduces the calcium phosphate solution interfacial tension compared to homogeneous nucleation of calcium phosphate in the absence of protein. Eqs. (1) and (2) also predict that nucleation is promoted by increasing the solution supersaturation, S. The data shown in Table 2 indicates that increasing the solution supersaturation resulted in an increase in the amount of calcium phosphate precipitated, consistent with nucleation theory.
QCM data in Fig. 4 shows that the induction time for nucleation for the 6.5 μg/mL amelogenin solution which had high amounts precipitated (Fig. 1) was shorter than the induction time for the 65 μg/mL protein solution which had lower amounts precipitated. This trend is consistent with Eqs. (1) and (2) which indicate that systems that have higher nucleation densities should also have shorter induction times. The QCM data also showed that the slope of the growth curve was higher for the 6.5 μg/mL amelogenin solution compared to the 65 μg/mL solution. Higher overall growth rates occur because of the higher numbers of nuclei present in the 6.5 μg/mL protein solutions. In general, solutions that resulted in higher amounts precipitated (e.g. 2.2 mM calcium and 6.5 μg/mL protein) had smaller calcium phosphate particle sizes than solutions resulting in lower amounts precipitated. Once nucleation occurs, growth dominates and depletes calcium and phosphate species, lowering the supersaturation until growth stops. For solutions with low nucleation densities, larger particles result because they grow to larger sizes before the supersaturation is lowered enough to stop growth.
The amounts precipitated and particle densities had a strong dependence on protein concentration as shown in Figs. 1 and 2. Particle densities were calculated and presented in Fig. 1b because the particle density is equivalent to the nucleation density, a more fundamental parameter for comparing nucleating ability than amounts precipitated. Increasing nucleation density with increasing protein concentration up to 6.5 μg/mL may occur because of an increase in the number of available nucleation sites with protein concentration. It has been found that the amelogenin nanosphere size is constant over a wide range of concentrations (0.05–2 mg/mL, [6]), indicating that only the nanosphere density is changing with protein concentration. Previous studies have shown that the amounts of calcium phosphate precipitated increased with increasing concentrations of nucleating agents such as bone sialoprotein [24] and citric acid [25,26]. Interestingly, a maximum in calcium phosphate amounts nucleated occurred at 6.5 μg/mL amelogenin and then the amounts precipitated decreased as the amelogenin concentration increased up to 130 μg/mL. This has been observed for other proteins and molecules, where a maximum in amounts of calcium phosphate precipitated in the presence of polyglutamic acid was ~15 μg/mL protein [27], in the presence of dentin sialoprotein at 5 μg/mL [28] and in the presence of citric acid at ratios of 2–12 calcium ions per citric acid molecule [25]. Other studies have shown that high concentrations of amelogenin (15 mg/mL) in a gel matrix [20] and high concentrations of phosphophoryn (100 μg/mL) [29] inhibited calcium phosphate nucleation.
Higher amounts of protein may result in higher degrees of binding of calcium and phosphate ions, causing depletion of species from the solution, lowering the solution supersaturation and reducing the driving force for nucleation. Previous research has shown that calcium binding to proteins and proteoglycans lowered the concentration of calcium in solution and inhibited nucleation [30,31]. It has been suggested that the inhibition of mineralization by the sequestration of mineral ions may be an important role for proteins. The observed dependence of nucleation on protein concentration in vitro suggests that amelogenin’s function in vivo may depend on concentration, with roles such as nucleator being promoted at low concentration and other roles such as growth modifier being promoted at higher concentration.
Hunter et al. [19] examined nucleation by amelogenin contained within an agarose matrix. Solutions that contained 6.5 mM CaCl2 and 3.9 mM sodium phosphate were placed at opposite ends of an agarose gel matrix containing amelogenin and the solutions were allowed to diffuse into the gel matrix. They observed no significant nucleation of calcium phosphate in the presence of 1–300 μg/mL rM179 as well as in gels without amelogenin. When we formed solutions with the same concentrations of calcium, phosphate, sodium chloride, and buffers in the absence of a gel matrix, we found that significant solution precipitation occurred (in the absence of protein). This suggests that nucleation behavior must be different using a gel model compared to using a solution model, perhaps by affecting diffusion processes or the nanosphere structure of the amelogenin protein. Although gel systems are interesting models for studying nucleation, solution systems can have some advantages. Solutions systems can be used for in situ, real-time nucleation kinetic studies using the constant composition [32–34] and QCM approaches [22], there are fewer diffusional effects, the starting solution supersaturations are known, and it is possible to unambiguously determine nanosphere structures within solutions.
Another recent study showed that amelogenin nanospheres could assemble to form ribbon-like structures by hanging drop crystallization in the presence of polyethylene glycol (PEG) and various salt solutions [35]. It was found that HAP grew with the c-axis parallel to the long axis of the microribbons when the surface immobilized ribbons were exposed to supersaturated solutions containing 2.5 mM calcium. Calcium phosphate may have formed by heterogeneous nucleation onto the microribbon template, however, it is not clear if homogeneous nucleation occurred in the solutions or if the PEG and salt additives may have contributed to the nucleation process.
4.2. Calcium phosphate characterization
Glancing angle X-ray diffraction (Fig. 3) showed that OCP was formed in our solutions. The plate-like substructures are typical of OCP crystals [32,36,37] in contrast to a needle-like morphology that is typical of HAP. There was a small amount of transformation to HAP after heating solutions for longer time periods. The initial formation of the more soluble OCP precursor phase is consistent with the supersaturations above the OCP solubility line and Ostwald’s rule which predicts initial formation of more soluble phases due to their lower interfacial energy for formation. OCP is a common precursor phase for HAP in in vitro studies [38,39]. OCP formation is also relevant to enamel formation as it has been observed as a precursor phase in enamel [4,40] and has been used as a model system to study the effects of amelogenin on crystal growth [14]. OCP is favored in our solutions because the decrease in calcium concentration and pH with calcium phosphate formation stabilizes OCP [41]. Ongoing work is being done to promote the formation of HAP by using the constant composition method to maintain constant pH and calcium concentration.
The spherical particle morphology containing plate-like substructures has been observed previously for OCP formation [37]. Also, spherical particles containing substructures have been observed for the formation of calcium phosphate in the presence of dentin [42]. In their study, He et al. found that the amorphous calcium phosphate particles were initially formed and then at later times HAP needles formed within the amorphous matrix by solid-state nucleation. A mechanism involving the formation of an amorphous particle corresponding to one nucleus and then crystallization to form numerous OCP plate-like crystallites within the particle would be consistent with the morphology shown in Fig. 2. Amorphous particles have been observed in some of the nucleation samples and the early stages of nucleation and growth are currently being investigated to confirm this precursor.
4.3. Nucleation mechanisms
The hydrophilic domain at the C-terminus, depicted schematically in Fig. 5, has been shown to be involved in adsorption to hydroxyapatite [8] and to interact directly with hydroxyapatite [17,18]. This domain, therefore, is a possible candidate for a nucleation domain. This region contains two glutamic acid residues and two aspartic acid residues, acidic amino acid residues implicated in the biomineralization of bone [24,27] and calcium carbonate in mollusks [43,44] by the promotion of calcium binding [45]. In addition, this region also contains one arginine and two lysine residues, basic amino acids containing amine functionality which may have importance in promoting phosphate adsorption. Calculations of double-layer structure in nucleating solutions at negatively charged surfaces have shown that cations such as calcium accumulate at the interface but anions are pushed away from the interface because of charge balance considerations [46]. The anisotropic distribution of ions in the electrostatic double-layer structure, therefore, may affect nucleation behavior. Calcium phosphate nucleation has been promoted onto particles such as titania which have mixed surface groups that promote the adsorption of both calcium and phosphate [47]. Acidic and basic residues that promote the adsorption of both calcium and phosphate, therefore, may aid in promoting nucleation. In order to provide evidence that the C-terminus is a nucleation domain, the nucleation behavior of mutants of rp(H)M180 (such as rp(H)M169, rp(H)M165, and rp(H)M159) that have increasingly larger portions of the C-terminal domain removed is currently being investigated.
Fig. 5.

Schematic of a possible mechanism for nucleation: the association of the amelogenin monomers into a nanosphere (arrow indicating the C-terminal domain (red)), calcium and phosphate ion binding at the interface, and amino acid sequences of the C-terminal domain of amelogenin (red: acidic amino acids, blue: basic amino acids).
Although amelogenin is relatively hydrophobic compared to other nucleation proteins, the supramolecular assembly of protein monomers into nanospheres, as demonstrated previously [8] and as demonstrated by AFM under these solution conditions (data not shown), is thought to concentrate the charged domain of the protein at the nanosphere surface [35] as shown schematically in Fig. 5. Association of adjacent C-terminal residues into a template composed of charged sites may promote the accumulation of calcium and phosphate ions and favor the formation of the ~10–20 Å critical nucleus necessary for nucleation from slightly soluble salts [48] compared to an isolated protein.
It is difficult to speculate on how in vitro results may relate to enamel formation in vivo but this work indicates that the amelogenin protein alone can lower the interfacial energy for nucleation relative to homogeneous nucleation, making an in vivo nucleation role possible. Other extra-cellular matrix proteins such as enamelin may also have roles in the nucleation of enamel and deserve study using in vitro models. The function of amelogenin may evolve over the time course of enamel formation, as a function of changing protein concentration and as the protein is progressively cleaved by proteolytic enzymes resulting in removal of potential nucleation domains such as the C-terminus.
5. Conclusions
Amelogenin promoted the heterogeneous nucleation of calcium phosphate from metastable solutions supersaturated with respect to OCP and HAP. Precipitation studies and real-time, in situ kinetic studies using a QCM showed that nucleation was promoted in the presence of protein compared to solutions without protein, indicating that amelogenin lowers the interfacial energy for nucleation. The total amounts precipitated and particle nucleation densities increased with increasing solution supersaturation. The degree of nucleation also depended on the concentration of protein in solution. The amount of calcium phosphate precipitated increased with increasing concentration of protein up to a maximum at 6.5 μg/mL amelogenin, and then decreased as the protein concentration increased up to 130 μg/mL. The nanosphere supra-molecular structure may promote calcium phosphate formation by concentrating charge at the nanosphere surface and acting as a nucleation template. This work has importance in developing physicochemical approaches to the study of nucleation and growth processes in vitro and in elucidating the roles that are possible for proteins such as amelogenin in the formation of mineralized tissues.
Acknowledgments
This work was supported by NIH-NIDCR Grant DE-015347. We are grateful to Todd Hart for ICP analysis, Bruce Arey for FESEM and EDS analysis, Jim Coleman for SEM, and Dave McCready for XRD work. This research was performed at Pacific Northwest National Laboratory, operated by Battelle for the US-DOE. A portion of the research was performed in the EMSL, a national scientific user facility sponsored by the DOE-OBER at PNNL.
Abbreviations
- OCP
octacalcium phosphate
- HAP
hydroxyapatite
- FESEM
field-emission scanning electron microscopy
- QCM
quartz crystal microbalance
References
- 1.Lowenstam HA, Weiner S. On Biomineralization. Oxford University Press; New York: 1989. [Google Scholar]
- 2.Fincham AG, Moradian-Oldak J, Simmer JP. J Struct Biol. 1999;136:270. doi: 10.1006/jsbi.1999.4130. [DOI] [PubMed] [Google Scholar]
- 3.Moradian-Oldak J. J Matrix Biol. 2001;20:293. doi: 10.1016/s0945-053x(01)00154-8. [DOI] [PubMed] [Google Scholar]
- 4.Diekwisch TGH, Berman BJ, Gentner S, Slavkin HC. Cell Tissue Res. 1995;279:149. doi: 10.1007/BF00300701. [DOI] [PubMed] [Google Scholar]
- 5.Moradian-Oldak J, Tan J, Fincham AG. Biopolymers. 1998;46:225. doi: 10.1002/(SICI)1097-0282(19981005)46:4<225::AID-BIP4>3.0.CO;2-R. [DOI] [PubMed] [Google Scholar]
- 6.Moradian-Oldak J, Simmer JP, Lau EC, Sarte PE, Slavkin HC, Fincham AG. Biopolymers. 1994;34:1339. doi: 10.1002/bip.360341006. [DOI] [PubMed] [Google Scholar]
- 7.Fincham AG, Moradian-Oldak J, Simmer JP, Sarte P, Lau EC, Diekwisch T, Slavkin HC. J Struct Biol. 1994;112:103. doi: 10.1006/jsbi.1994.1011. [DOI] [PubMed] [Google Scholar]
- 8.Moradian-Oldak J, Paine ML, Lei YP, Fincham AG, Snead ML. J Struct Biol. 2000;131:27. doi: 10.1006/jsbi.2000.4237. [DOI] [PubMed] [Google Scholar]
- 9.Robinson C, Fuchs P, Weatherell JA. J Crystal Growth. 1981;53:160. [Google Scholar]
- 10.Diekwisch T, Sasson D, Bringas P, Jr, Santos V, Slavkin HC. Development. 1993;117:471. doi: 10.1242/dev.117.2.471. [DOI] [PubMed] [Google Scholar]
- 11.Gibson C, Yuan Z-A, Hall B, Longenecker G, Chen E, Thyagarajan T, Sreenath T, Wright JT, Decker S, Piddington R, Harrison G, Kulkarni AB. J Biol Chem. 2001;276:31871. doi: 10.1074/jbc.M104624200. [DOI] [PubMed] [Google Scholar]
- 12.Paine ML, Zhu D-H, Luo W, Bringas J, Goldberg PM, White SN, Lei Y-P, Sarikaya M, Fong HK, Snead ML. J Struct Biol. 2000;132:191. doi: 10.1006/jsbi.2000.4324. [DOI] [PubMed] [Google Scholar]
- 13.Lyngstadaas SP, Risnes SP, Sproat BS, Thrane PS, Prydz HP. EMBO J. 1995;14:5224. doi: 10.1002/j.1460-2075.1995.tb00207.x. [DOI] [PMC free article] [PubMed] [Google Scholar]
- 14.Iijima M, Moriwaki Y, Takagi T, Moradian-Oldak J. J Crystal Growth. 2001;222:615. [Google Scholar]
- 15.Wen HB, Moradian-Oldak J, Fincha AG. J Dent Res. 2000;79:1902. doi: 10.1177/00220345000790111501. [DOI] [PubMed] [Google Scholar]
- 16.Moradian-Oldak J, Bouropoulos N, Wang L, Gharakhanian N. Matrix Biol. 2002;21:197. doi: 10.1016/s0945-053x(01)00190-1. [DOI] [PubMed] [Google Scholar]
- 17.Shaw WJ, Campbell AA, Paine ML, Snead ML. J Biol Chem. 2004;279:40263. doi: 10.1074/jbc.C400322200. [DOI] [PubMed] [Google Scholar]
- 18.Shaw WJ, Ferris KF, Krueger S, Perez-Salas U, Silin V, McGillivray DJ, Campbell AA, Paine ML, Snead ML. Proceedings of the Eighth International Conference on the Chemistry and Biology of Mineralized Tissues; 2004. p. 150. [Google Scholar]
- 19.Hunter GK, Curtis HA, Grynpas MD, Simmer JP, Fincham AG. Calcif Tissue Int. 1999;65:226. doi: 10.1007/s002239900688. [DOI] [PubMed] [Google Scholar]
- 20.Bouropoulos N, Moradian-Oldak J. J Dent Res. 2004;83:278. doi: 10.1177/154405910408300402. [DOI] [PubMed] [Google Scholar]
- 21.Simmer JP, Lau EC, Hu CC, Aoba M, Lacey D, Nelson M, Zeichner-David ML, Snead ML, Slavkin HC, Fincham AG. Calcif Tissue Int. 1994;54:312. doi: 10.1007/BF00295956. [DOI] [PubMed] [Google Scholar]
- 22.Tarasevich BJ, Chusuei CC, Allara DL. J Phys Chem B. 2003;107:10367. [Google Scholar]
- 23.Sauerbrey G. Z Phys. 1959;155:206. [Google Scholar]
- 24.Hunter GK, Goldberg HA. Proc Natl Acad Sci USA. 1993;90:8562. doi: 10.1073/pnas.90.18.8562. [DOI] [PMC free article] [PubMed] [Google Scholar]
- 25.Rhee S-H, Tanaka J. Biomaterials. 1999;20:2155. doi: 10.1016/s0142-9612(99)00118-0. [DOI] [PubMed] [Google Scholar]
- 26.Rhee SH, Tanaka J. J Mater Sci—Mater Med. 2000;11:449. doi: 10.1023/a:1008992009826. [DOI] [PubMed] [Google Scholar]
- 27.Hunter GK, Goldberg HA. Biochem J. 1994:175. doi: 10.1042/bj3020175. [DOI] [PMC free article] [PubMed] [Google Scholar]
- 28.Boskey A, Spevak L, Tan M, Doty SB, Butler WT. Calcif Tissue Int. 2000;67:472. doi: 10.1007/s002230001169. [DOI] [PubMed] [Google Scholar]
- 29.Boskey AL, Dick BL. Calcif Tissue Int. 1991;49:193. doi: 10.1007/BF02556117. [DOI] [PubMed] [Google Scholar]
- 30.Hunter GK, Szigety SK. Matrix. 1992:362. doi: 10.1016/s0934-8832(11)80032-6. [DOI] [PubMed] [Google Scholar]
- 31.Hunter GK, Allen BL, Grynpas MD, Cheng P-T. Biochem J. 1985;228:463. doi: 10.1042/bj2280463. [DOI] [PMC free article] [PubMed] [Google Scholar]
- 32.Wu W, Nancollas GH. Langmuir. 1997;13:861. [Google Scholar]
- 33.Dalas E, Kallitsis JK, Koutsoukos PG. Langmuir. 1991;7:1822. [Google Scholar]
- 34.Spanos N, Koutsoukos PG. J Mater Sci. 2001;36:573. [Google Scholar]
- 35.Du C, Falini G, Fermani S, Abbott C, Moradian-Oldak J. Science. 2005;307:1450. doi: 10.1126/science.1105675. [DOI] [PubMed] [Google Scholar]
- 36.Ngankam PA, Lavalle P, Voegel JC, Szyk L, Decher G, Schaaf P, Cuisinier FJG. J Am Chem Soc. 2000;122:8998. [Google Scholar]
- 37.Liu Y, Shelton RM, Barralet JE. Key Eng Mater. 2004;254–256:79. [Google Scholar]
- 38.Johnsson M, Nancollas GH. Crit Rev Oral Biol Med. 1992;3:61. doi: 10.1177/10454411920030010601. [DOI] [PubMed] [Google Scholar]
- 39.Iijima M, Kamemizu H, Wakamatsu N, Goto T, Doi Y, Moriwaki Y. J Crystal Growth. 1997;181:70. [Google Scholar]
- 40.Simmer JP, Fincham AG. Crit Rev Oral Biol Med. 1995;6:84. doi: 10.1177/10454411950060020701. [DOI] [PubMed] [Google Scholar]
- 41.Robertson WG. Calcif Tissue Res. 1973;11:311. doi: 10.1007/BF02547230. [DOI] [PubMed] [Google Scholar]
- 42.He G, Dahl T, Veis A, George A. Na Mater. 2003;2:552. doi: 10.1038/nmat945. [DOI] [PubMed] [Google Scholar]
- 43.Weiner S. Biochemistry. 1983;22:4139. [Google Scholar]
- 44.Worms D, Weiner S. J Exp Zool. 1986;237:11. [Google Scholar]
- 45.Chen Y, Bal BS, Gorski JP. J Biol Chem. 1992;267:24871. [PubMed] [Google Scholar]
- 46.Lochhead MJ, Letellier SR, Vogel V. J Phys Chem B. 1997:10821. [Google Scholar]
- 47.Song L, Campbell AA, Li XS, Bunker BC. Mater Res Soc Symp Proc. 1996;414:35. [Google Scholar]
- 48.Dalas E, Kallitsis J, Koutsoukos PG. J Crystal Growth. 1988;89:287. [Google Scholar]