Abstract
The reduction of silver cations bound to the oligonucleotide dC12 was used to form silver nanoclusters. Mass spectra show that the oligonucleotides have 2–7 silver atoms that form multiple species, as evident from the number of transitions in the fluorescence and absorption spectra. The variations in the concentrations of the nanoclusters with time are attributed to the changing reducing capacity of the solution, and the formation of oxidized nanoclusters is proposed. Via mass spectrometry and circular dichroism spectroscopy, double-stranded structures with Ag+-mediated interactions between the bases are observed, but these structures are not maintained with the reduced nanoclusters. Through variations in the pH, the nanoclusters are shown to bind with the N3 of cytosine.
Introduction
Control of the size, shape, and arrangement of nanoparticles is needed to utilize their optical, electronic, and catalytic properties. 1 To accomplish this goal, the functional groups of biological macromolecules are used as sites for the synthesis and binding of nanoparticles.2 Importantly, the arrangement and types of these binding sites can be altered to affect the selection and synthesis of nanoparticles, and nucleic acids offer important advantages as templates.3–5 The organization of nanoparticles associated with DNA strands is accomplished by using complementary interactions between the bases.6 In addition, the sequence of the bases and the types of bases can be readily altered to impact on the types of nanoparticles that form.4 The DNA-mediated synthesis of metal nanostructures is facilitated by the well-known interactions of metal cations with DNA.7 These bound ions are reduced to form structures that have the form of the template, as illustrated by the synthesis of nanowires. 8
The goal of our work is to utilize DNA as a scaffold for the synthesis of much smaller silver nanoclusters. Silver cations are known to interact selectively with the DNA bases, a fact which indicates that nanocluster stoichiometry can be controlled via sequence-selective interactions.7 The stoichiometry/size-dependent variations in the energy levels of the silver nanoclusters will be utilized for single-molecule electronics and fluorescence labeling.9 In these studies, the use of the cytosine oligonucleotide dC12 was motivated by prior 1H NMR spectra in which the silver nanoclusters caused significant spectral shifts for cytosine in comparison with other bases.10 Multiple species are formed following reduction of the Ag+ bound to dC12, and a key distinction is the extent of reduction of these nanoclusters. The binding sites of the nanoclusters were probed using pH variations. Mass spectra and circular dichroism spectra indicate that Ag+ cross-links cytosine oligonucleotides, which provides an explanation for the dependence of the fluorescence on the silver stoichiometry.
Experimental Section
Silver nitrate (Aldrich, 99.9999%) and sodium borohydride (Aldrich, 99%) were used as received. The oligonucleotide dC12 (Integrated DNA Technologies) was purified by desalting by the manufacturer. Oligonucleotides were received as dehydrated pellets and dissolved in sterilized, deionized water (Barnstead Nanopure ultrapure water system). DNA concentrations were determined by absorbance using molar absorptivities based on the nearest-neighbor approximation.11 The silver nanoclusters were synthesized by adding AgNO3 to the DNA and then adding NaBH4, followed by vigorous shaking for 1–2 min. Unless otherwise specified, the concentrations were 15 µM dC12, 90 µM Ag+, and 90 µM BH4−. The aqueous solutions of NaBH4 were prepared by dissolving the solid in water and adding the appropriate volume to the DNA/Ag+ sample within 30 s. Silver nanoparticles were synthesized following the procedure of Creighton et al.12 Buffers with pH values from 3.0 to 5.5 were prepared using 5 mM formate/formic acid and acetate/acetic acid solutions.
Visible absorption spectra were acquired using a Varian Cary 50 Bio UV–visible spectrophotometer. Circular dichroism spectra were obtained from a Jasco J-710 spectropolarimeter. Fluorescence spectra were acquired on a Jobin Yvon Horiba Fluoromax-3 spectrofluorimeter. Fluorescence spectra were collected using excitation wavelengths ranging from 240 to 700 nm with increments of 20 nm. All optical spectra were acquired using quartz cuvettes with 1-cm path lengths. Mass spectra were obtained from a Waters Micromass ZQ (Masslynx 4.0) using electrospray ionization. The spectra were acquired in negative ion mode with 2.5-kV needle and 20-V cone voltages. The solutions were 50% methanol:50% water to facilitate desolvation, and the methanol was added just prior to the acquisition of the spectra. The Beckman TL-10 ultracentrifuge was operated at 52000 rpm and 20 °C for 20 min. For samples that were saturated with nitrogen, purging was conducted for 10 min using a water-saturated gas stream.
Results and Discussion
Production of Multiple Species
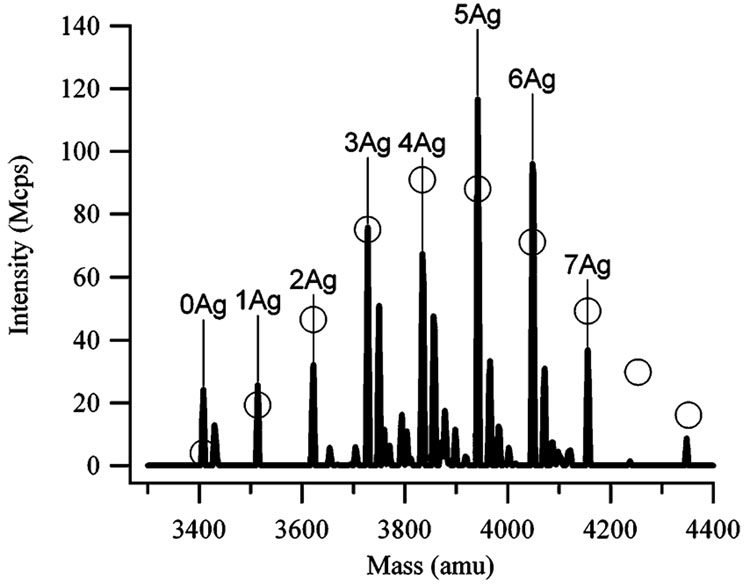
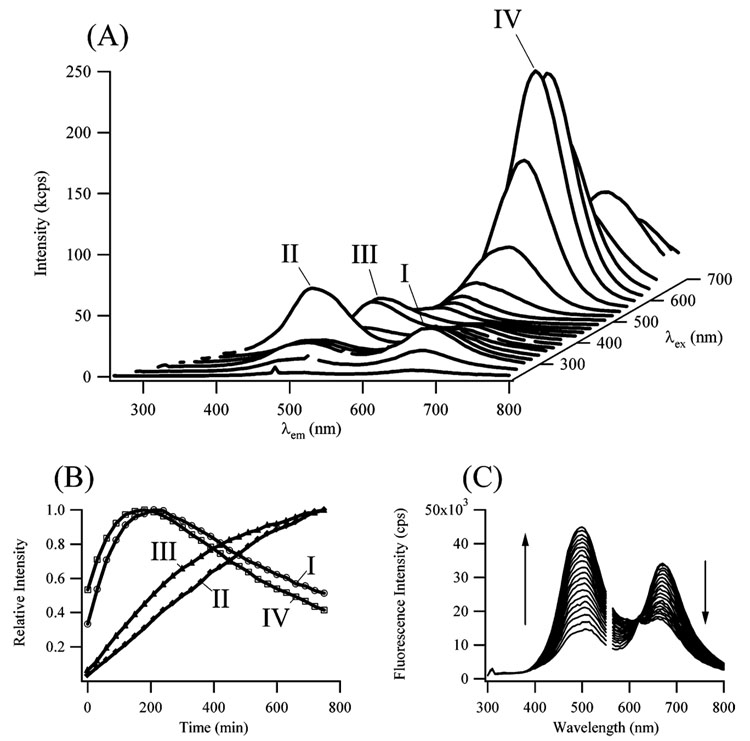
Mass and optical spectra characterized the nanoclusters that formed following the reduction of the DNA-bound silver cations. Electrospray mass spectra demonstrate that small numbers of silver atoms are bound to the oligonucleotide dC12 (Figure 1). The silver atoms exhibit a distribution of stoichiometries that are modeled using Poisson statistics. The agreement between the observed and predicted distributions suggests that no particular stoichiometries, and hence cluster sizes, are favored–a conclusion that is supported by the fluorescence spectra (Figure 2a). Several electronic transitions are observed–one prominent band with λex = 580 nm/λem = 665 nm (Peak IV in Figure 2a) and three weaker bands with λex = 280 nm/λem = 665 nm (Peak I), λex = 340 nm/λem = 485 nm (Peak II), and λex = 440 nm/λem = 525 nm (Peak III). These transitions are in the spectral region for small silver nanoclusters, as expected from theoretical and experimental studies.13–16 A definitive assignment of the electronic bands on the basis of these prior studies is challenging because the peaks for the nanoclusters are expected to change depending on the environment. Thus, the DNA-bound nanoclusters have been characterized on the basis of their spectroscopic and chemical properties. The peaks are distinguished into two types on the basis of their evolution with time (Figure 2b). The intensities of the blue/green emission bands (II and III in Figure 2a) increase with time. In contrast, the intensities of the red emission bands (I and IV in Figure 2a) increase and then decrease with time after ≈200 min. Besides their similar time evolution, the two bands with λex = 580 and 280 nm have a common emission wavelength, which suggests that they arise from a common electronic state of one species.
Figure 1.
Electrospray ionization mass spectra of the dC12:Ag complexes 4 h after adding the BH4 −. The peaks are labeled with the number of silver atoms attached to the dC12. The oligonucleotide has the expected mass of 3408 amu. The peaks to the right of the marked peaks correspond to Na+ adducts. The open circles associated with the peaks represent the predicted stoichiometry distribution based on Poisson statistics. The average number of bound silvers from this fit is 4.8 ± 0.4.
Figure 2.
(A) Fluorescence emission spectra (bottom axis) as a function of the excitation wavelengths (right axis), which were changed by 20 nm starting at 240 nm. The spectra were acquired 4.5 h after adding the BH4 −. The dominant emission band occurs at λex = 580 nm/λem = 665 nm (labeled with IV). Three other bands occur at λex = 280 nm/λem = 665 nm (labeled with I), λex = 340 nm/λem = 485 nm (labeled with II), and λex = 440 nm/λem = 525 nm (labeled with III). (B) The variation in the intensities of the four bands as a function of time. The spectra were collected every 30 min. The bands at λex = 580 nm/λem = 665 nm (IV, open squares) and λex = 280 nm/λem = 665 nm (I, open circles) reach a maximum fluorescence intensity at 200 min and then decay. The bands at λex = 340 nm/λem = 485 nm (II, closed diamonds) and λex = 440 nm/λem = 525 nm (III, closed triangles) only increase with time. (C) Time evolution of the fluorescence emission spectrum using λex = 280 nm, which excites both the red- and blue-emitting species. The isosbestic point at 615 nm results as the emission intensity at 495 nm increases while the emission intensity at 670 nm decreases. The gap in the spectra is due to second-order scattering. The spectra were collected every 30 min starting 3 h after the BH4 − was added.
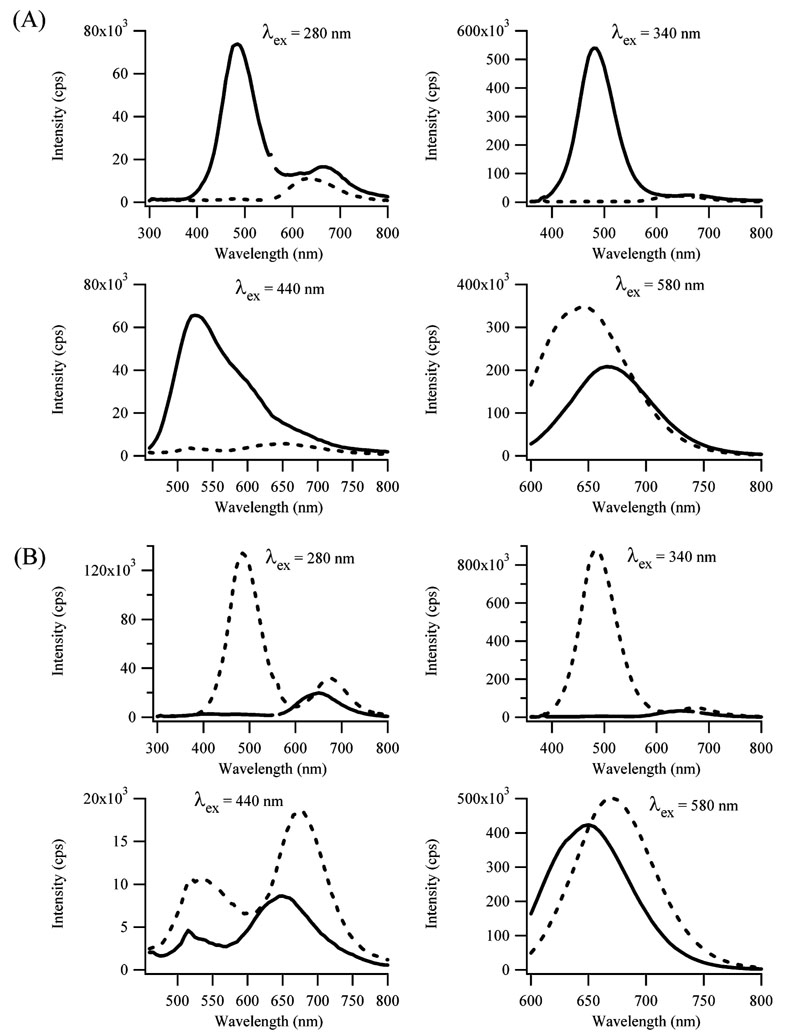
The blue/green- and red-emitting species are linked through a chemical reaction, as seen by the isosbestic point in Figure 2c. The following experiments demonstrate that this reaction is oxidation. Figure 3a shows fluorescence spectra after 6 equivalents each of BH4 − and Ag+ are reacted with 1 equivalent of dC12 for 24 h, a time that is sufficient for formation of both oxidized and reduced species. Following the addition of 6 more equivalents of BH4 −, the blue/green emissions (λem = 490 and 520 nm) are completely quenched. For the red emission (λem = 665 nm), the fluorescence intensity is enhanced and the emission maximum is blue-shifted. As discussed below, the shift in the red fluorescence may be due to two species that emit in this spectral region. Relative to BH4 −, complementary results were obtained when Ag+ was added (Figure 3b). The blue/green emission intensities are low soon after reduction, so 6 more equivalents of Ag+ were added 3.5 h after preparing the sample (6 BH4 −:6 Ag+:1 dC12). The fluorescence intensity of all the peaks increases with the largest change occurring for the band for which λex = 340 nm (Figure 3b). The maximum fluorescence intensity occurs when 6 additional equivalents of Ag+ are added to the sample (Figure 1S). In a pH = 10 buffer (5 mM H2BO3 −/H3BO3), the λex = 580 nm band has a comparable intensity to the experiments in water (Figure 2A), yet the intensity from the λex = 340 nm band is largely suppressed (Figure 2S). This result suggests that the oxidation of the nanoclusters is limited at high pH.
Figure 3.
(A) Fluorescence emission spectra acquired before (solid line) and after (dashed line) adding 90 µM BH4 − to a sample 24 h after combining [dC12] = 15 µM and [Ag+] = [BH4 −] = 90 µM. (B) Fluorescence emission spectra acquired before (solid line) and after (dashed line) adding 90 µM Ag+ to a sample 3.5 h after combining [dC12] = 15 µM and [Ag+] = [BH4 −] = 90 µM. The excitation wavelengths (λex) correspond to the bands I–IV in Figure 2.
Further support for the formation of oxidized nanoclusters is provided by the oxygen and chloride dependence of the fluorescence. Given prior estimates of the oxidation potentials of small silver nanoclusters, it is reasonable to expect that O2 acts as an oxidizing agent, and the following results support the assignment that the oxidized and reduced species are associated with the λex = 340 nm/λem = 485 nm and the λex = 580 nm/λem = 665 nm bands, respectively.17 With N2, the lower fluorescence of the λex = 340 nm band suggests that O2 is needed for the formation of the species associated with this transition (Figure 3SA). In addition, the λex = 580 nm band does not decay as in air-saturated samples (Figure 3SB). Besides the effect of O2, the fluorescent species respond differently to chloride (Figure 3SC and 3SD). For air-saturated samples with 100 mM Cl−, the intensity of the λex = 340 nm band decays continuously over the period of 50 min. In contrast, the emission from the λex = 580 nm band increases and then decays over this time period. These results suggest that chloride reacts favorably with the λex = 340 nm species, which could be expected for an oxidized nanocluster, given the favorability of AgCl precipitation.18 Beyond this chemical evidence to support the formation of oxidized nanoclusters, other reducing agents may help clarify the mechanism of both reduction and oxidation. For example, citrate and ascorbic acid show no spectral changes when combined with the DNA-bound Ag+. This suggests that strong reducing agents are needed for the formation of the DNA-bound nanoclusters, which is motivating our current studies with other reducing agents.
In summary, the above results support the following explanation for the kinetic changes in Figure 2c. Initially after adding BH4 − to the Ag+–dC12 complexes, the high reducing capacity of the solution favors the formation of reduced nanoclusters with transitions at λex = 280 nm/λem = 665 nm and λex = 580 nm/λem = 665 nm. As the BH4 − decomposes, partially oxidized nanoclusters are formed with transitions at λex = 340 nm/λem = 485 nm and λex = 440 nm/λem = 525 nm. Partially oxidized nanoclusters have been proposed on the basis of the dose dependence of photolytically driven reduction, and these clusters exhibit electronic transitions in the visible region of the spectrum.15,19–21 In addition, small silver clusters favor oxidation in aqueous solution, and we are now conducting further studies of this oxidation process.17
For the red fluorescence band, shifts in the λmax occur when Ag+ and BH4 − are added to the samples (Figure 3). A related observation is that excitation at wavelengths greater than 500 nm results in red-shifts of the λem with increasing λex, a result that was observed in our previous studies (Figure 4S).10 At least two species are present, as suggested by the spectral decomposition in Figure 4S. The red- and blue-shifts that accompany the addition of Ag+ and BH4 −, respectively, support contributions from oxidized and reduced species, respectively.
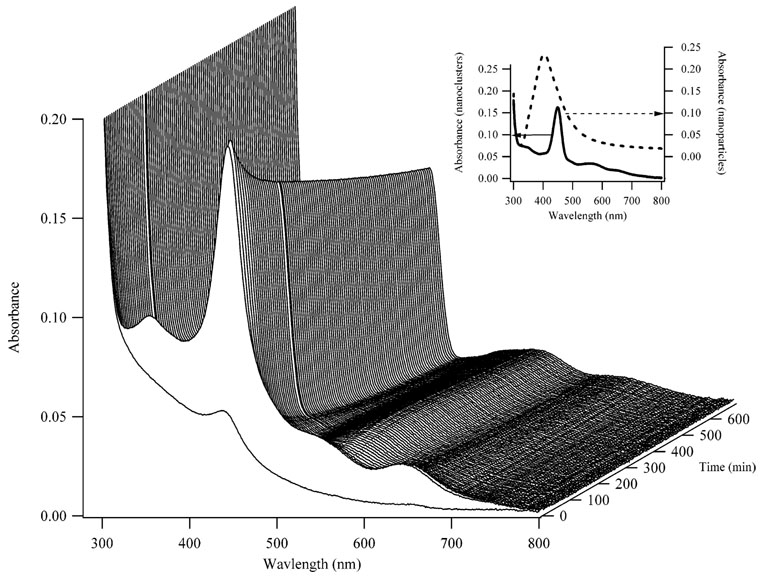
Several electronic transitions are also observed in the absorption spectra of the dC12/Ag conjugates (Figure 4). To provide further support that small silver nanoclusters are formed when the silver cations are bound to DNA prior to reduction, spectra of large (10–50-nm diameter) nanoparticles with dC12 were also acquired. A primary distinguishing feature of the nanoclusters is their strong peak at 440 nm that is red-shifted and narrower relative to the plasmon transition of the nanoparticles (Figure 4, inset). In addition, peaks at 350, 570, and 650 nm are observed for the nanoclusters but not for the nanoparticles. An induced circular dichroism at 440 nm is observed for the nanoclusters that is not observed for the nanoparticles (Figure 5S), which suggests that smaller nanoclusters retain the chirality of the DNA template. Finally, sedimentation was observed for the nanoparticle/DNA conjugates but not for the nanocluster/DNA conjugates, again consistent with the smaller size of the nanoclusters bound to DNA (Figure 6S). In addition, no change in the intensity or position of the fluorescence bands was observed for the nanocluster/DNA samples following centrifugation.
Figure 4.
Absorption spectra acquired as a function of time (right axis) for the nanoclusters. The first spectrum in the series was acquired 2 min after the addition of BH4 −, and subsequent spectra were acquired at 7-min intervals. The solid line in the inset shows the spectra of the nanoclusters acquired at 100 min after the reaction was initiated. The dashed line is the spectrum of a nanoparticle sample with a total of 90 µM silver and 15 µM dC12. The λmax for the nanoparticles is 405 nm.
Important insight is gained by comparing the absorption spectra using the DNA templates relative to other substrates. For example, polymers such as polyacrylate and polyphosphate have been used to bind Ag+ and to form silver nanoclusters.22,23 These studies used radiologically-based reduction methods that favor the formation of oxidized nanoclusters. In our studies with oligonucleotide templates, rapid and complete chemical reduction of the DNA-bound Ag+ is accomplished with BH4 −. Then oxidation occurs with the involvement of dissolved oxygen. Both the polymer and DNA studies exhibit electronic transitions between 200 and 400 nm, which further supports the formation of oxidized nanoclusters in our DNA studies. The significant differences in the band positions and widths between the two types of experiments demonstrate that both the reduction method and the functional groups of the template can play important roles in the formation of the nanoclusters. The effects of pH on the bases and hence on the nanocluster formation further elaborate this issue (see next section).
Limited correspondence exists between the absorption and the fluorescence excitation maxima. For example, the strong band at 440 nm and the shoulder at 350 nm do not follow the same time evolution as the corresponding excitation peaks in the fluorescence (Figure 7S). The 570-nm band in the absorption spectra and the fluorescence band for which λex = 580 nm follow the same time evolution, which suggests that these two transitions arise from a single species. This lack of correspondence may be a further consequence of the formation of multiple species with differing fluorescence quantum yields and extinction coefficients.
Ag+ and Ag Nanocluster Binding
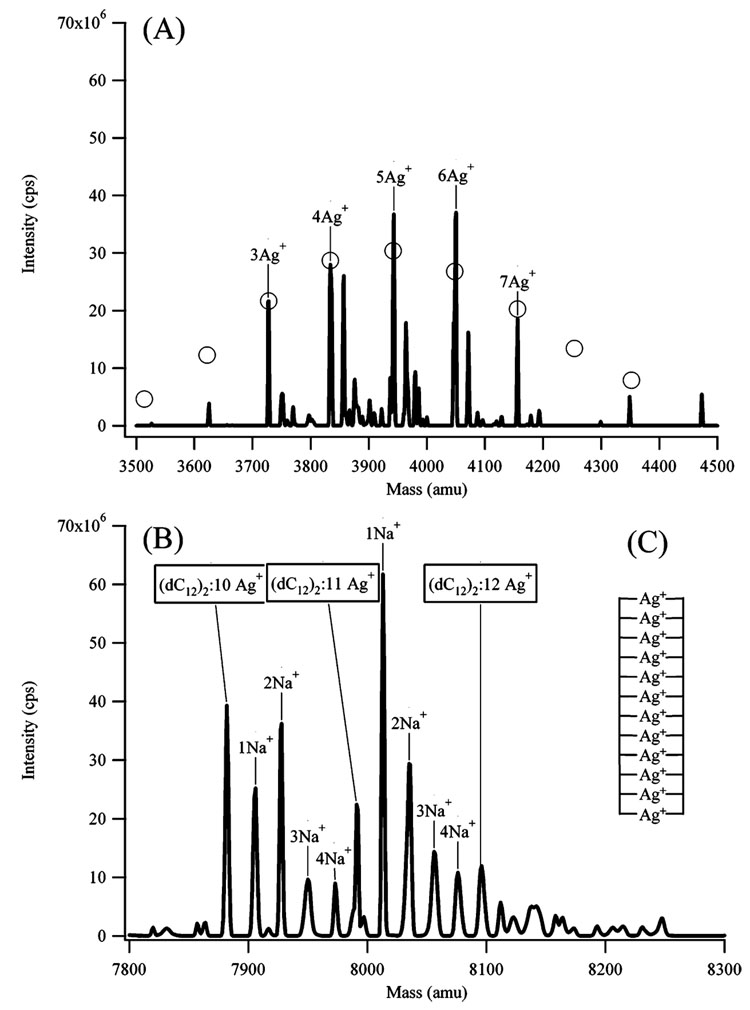
To provide more insight into the formation of the silver nanoclusters, the mode of binding of silver cations and nanoclusters with dC12 was studied. Ag+ binds preferentially with the bases, and circular dichroism spectra show the significant effect of Ag+ on the DNA conformation, as two strong peaks with negative ellipticity develop at 215 and 265 nm and the ellipticity of the peak at 290 nm decreases (Figure 8S). These results are consistent with prior studies of the effect of Ag+ on polynucleotides of uridine and inosine.24 In addition, the DNA absorption maximum shifts and the band changes shape upon Ag+ complexation (Figure 8S). To consider the possibility that Ag+ is cross-linking DNA strands, mass spectra were acquired. To facilitate desolvation, the solvent was 50% methanol:50% water, and this composition did not affect the structure of the dC12–Ag+ complex, as evidenced by the similarity of these CD spectra relative to those in water (Figure 8S). The mass spectra exhibit two prominent sets of peaks (Figure 5). At the lower masses, Ag+ complexes with single-stranded dC12 are present (Figure 5A). A Poisson fit of the intensities gives an average of 5.3 ± 0.5 Ag+:dC12, which is expected given the initial stoichiometry of 6 Ag+: oligonucleotide. The second set of peaks occurs in the mass range corresponding to (dC12)2 with 10–12 Ag+ (Figure 5b). This stoichiometry indicates that Ag+ is mediating interstrand interactions between 2 bases, and a suggested model is shown in Figure 8c. The mass spectra show significant amounts of Na+ in the duplex state relative to the single-stranded state. Attempts to reduce these Na+ adducts using freshly prepared solutions did not affect the Na+ concentration, and strongly bound Na+ adducts may be expected given the high charge density in the duplex state. No duplex states were observed after the reduction of the DNA-bound Ag+, which suggests that the nanoclusters are bound to single-stranded DNA.
Figure 5.
Electrospray ionization mass spectra of the dC12:Ag+ complexes. The peaks are labeled with the number of silver atoms attached to the dC12. In (A), the spectrum of the silver complexes with single-stranded dC12 is shown. The peaks to the right of the marked peaks correspond to Na+ adducts. The open circles associated with the peaks represent the predicted stoichiometry distribution based on Poisson statistics. The average number of bound silvers from this fit is 5.3 ± 0.5, which is reasonable given the initial stoichiometry of 6 Ag:1 dC12. In (B), the spectrum of the silver complexes with (dC12)2 is shown. The number of Ag+ associated with (dC12)2 is indicated by the boxed text. The Na+ adducts associated with each (dC12)2:Ag+ complex are indicated by the marked peaks. (C) The inset shows the proposed structure for the silver-mediated duplex state. Na+ adducts would stabilize such a structure with its high negative charge density.
The use of ions to promote DNA strand association is well-established. For example, cytosine-rich oligonucleotides form i-motif structures in which protons bridge the N3 of the bases.25 Metal ions also mediate cross-linking between the bases. This interaction was proposed to explain the development of strong circular dichroism signals and the thermal stability of poly-nucleotides in the presence of Ag+.24 The structural features of a silver cation chelated by two bases was elucidated by X-ray crystallography.26 Recently, it has been shown that base pairing between alternate nucleosides can be driven by metal ions in place of hydrogen bonding.27
A silver-cation-mediated duplex provides insight into how stoichiometry influences the fluorescence spectra. From 1/3 to 36 Ag+:dC12 (Figure 9S), the fluorescence intensities of all the bands reach their maximum at 6 Ag+:oligonucleotide. In a duplex state with this stoichiometry, the silver ions have the closest proximity prior to reduction, which would be expected to favor the formation of the nanoclusters (Figure 5c). At higher concentrations, the fluorescence intensities decrease, which suggests that the favored binding sites have been saturated and larger nanoparticles with lower fluorescence quantum yields are favored.
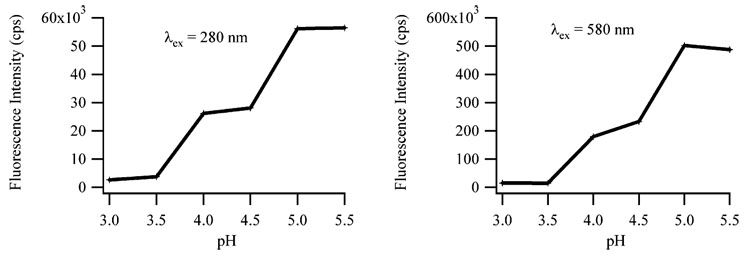
Silver cations bind preferentially with the bases, so complexation of the nanoclusters with the N3 of the cytosine base was probed using variations in the pH of the solution.7,28 Figure 6 shows the increase in the fluorescence for both the λex = 280 nm/λem = 665 nm and the λex = 580 nm/λem = 665 nm bands as the pH is increased from 3.0 to 5.5. The midpoint at ≈4 is similar to the pKa of the N3 of cytosine, which suggests that deprotonation of N3 is associated with nanocluster binding.11 The rates of change of these fluorescence peaks over this pH range are comparable, which suggests that the change in the intensity is due solely to inhibition of binding. Over this same pH range, the fluorescence intensities of the λex = 340 nm/λem = 485 nm and the λex = 440 nm/λem = 525 nm bands do not change with pH (Figure 10S).
Figure 6.
Fluorescence intensities of the λex = 280 nm/λem = 665 nm and the λex = 580 nm/λem = 665 nm bands (see Figure 2) as a function of pH. The midpoint of these approximately sigmoidal pH titration curves for each band corresponds to the pKa of the N3 of cytosine.
Significant pH effects are also evident in the absorption spectra (Figure 11S). At pH = 5.5, similar results are obtained as in water (Figure 4): a prominent band with λmax = 442 nm and additional weaker transitions. The key distinctions for the measurements at pH = 3 are the broadness of the transition, the blue-shift of the λmax to 414 nm, and the absence of additional peaks in the spectrum. Relative to the nanoparticle/dC12 spectrum (Figure 11S), the low-pH spectrum is similar with respect to the λmax and the width of the transition, which suggests that nanoparticles may be forming at low pH. This possibility is consistent with the fluorescence spectra in that inhibited binding of the nanoclusters at N3 promotes binding at alternate sites from which larger nanoparticles could form (Figure 9S).
Conclusions
The long-term goal of our work is to control the size and hence the spectral properties of silver nanoclusters to utilize their interesting optical and electrical properties. Our previous studies indicated that base specific interactions in DNA oligonucleotides can be used for the synthesis of the nanoclusters. Specifically, NMR spectra demonstrated that cytosine experiences the largest chemical shifts with silver nanoclusters. Thus, the present studies concern the interaction of both silver cations and nanoclusters with the oligonucleotide dC12. The mass spectra show that 1–7 atoms are bound to the DNA, so several combinations are possible for the sizes of the nanoclusters. This conclusion is supported by the number of peaks in both the fluorescence and absorption spectra. The initial reduction of the DNA-bound Ag+ is subsequently followed by oxidation to produce additional nanocluster emitters. The Ag+ mediates the interaction between bases that results in the formation of duplex structures. The binding mode of the red-emitting nanoclusters is with the N3 the cytosine base. These studies provide critical insight for our efforts to effect nanocluster formation via systematic variations in the base sequence.
Acknowledgment
J.T.P. gratefully acknowledges the support provided by the National Institutes of Health [NIH Grants R15GM071370 and P20 RR-016461 (from the National Center for Research Resource)] and the Henry Dreyfus Teacher-Scholar Awards Program. R.M.D. gratefully acknowledges support from NSF BES-0323453, NIH R01GM68732, and NIH P20GM072021. We thank B. Sengupta for assistance with the experiments.
Footnotes
Supporting Information Available: Supporting figures 1S–11S. This material is available free of charge via the Internet at http://pubs.acs.org.
References and Notes
- 1.Fedlheim D. Metal Nanoparticles: Synthesis, Characterization & Applications. Boca Raton, FL: CRC Press; 2001. [Google Scholar]
- 2.Niemeyer CM. Nanoparticles, proteins, and nucleic acids: Biotechnology meets materials science. Angew. Chem., Int. Ed. 2001;40(22):4128–4158. doi: 10.1002/1521-3773(20011119)40:22<4128::AID-ANIE4128>3.0.CO;2-S. [DOI] [PubMed] [Google Scholar]
- 3.Mao C, Solis DJ, Reiss BD, Kottmann ST, Sweeney RY, Hayhurst A, Georgiou G, Iverson B, Belcher AM. Virus-based toolkit for the directed synthesis of magnetic and semiconducting nanowires. Science. 2004;303(5655):213–217. doi: 10.1126/science.1092740. [DOI] [PubMed] [Google Scholar]
- 4.Gugliotti LA, Feldheim DL, Eaton BE. RNA-mediated metal–metal bond formation in the synthesis of hexagonal palladium nanoparticles. Science. 2004;304(5672):850–852. doi: 10.1126/science.1095678. [DOI] [PubMed] [Google Scholar]
- 5.Seeman NC. DNA nanotechnology: Novel DNA constructions. Annu. Rev. Biophys. Biomol. Struct. 1998;27(1):225–248. doi: 10.1146/annurev.biophys.27.1.225. [DOI] [PubMed] [Google Scholar]
- 6.Aldaye FA, Sleiman HF. Sequential self-assembly of a DNA hexagon as a template for the organization of gold nanoparticles. Angew. Chem., Int. Ed. 2006;45(14):2204–2209. doi: 10.1002/anie.200502481. [DOI] [PubMed] [Google Scholar]
- 7.Eichhorn G. Complexes of nucleosides and nucleotides. In: Eichhorn G, editor. Inorganic Biochemistry. Vol. 2. New York: Elsevier; 1973. Chapter 33. [Google Scholar]
- 8.Stoltenberg RM, Woolley AT. DNA-templated nanowire fabrication. Biomed. Microdevices. 2004;6(2):105–111. doi: 10.1023/b:bmmd.0000031746.46801.7d. [DOI] [PubMed] [Google Scholar]
- 9.Lee T-H, Gonzalez JI, Zheng J, Dickson RM. Single-molecule optoelectronics. Acc. Chem. Res. 2005;38(7):534–541. doi: 10.1021/ar040146t. [DOI] [PubMed] [Google Scholar]
- 10.Petty JT, Zheng J, Hud NV, Dickson RM. DNA-templated Ag nanocluster formation. J. Am. Chem. Soc. 2004;126(16):5207–5212. doi: 10.1021/ja031931o. [DOI] [PubMed] [Google Scholar]
- 11.Bloomfield VA, Crothers DM, Tinoco I., Jr . Nucleic Acids: Structures, Properties, and Functions. Sausalito, CA: University Science Books; 2000. p. 794. [Google Scholar]
- 12.Creighton JA, Blatchford CG, Albrecht MG. Plasma resonance enhancement of Raman-scattering by pyridine adsorbed on silver or gold sol particles of size comparable to the excitation wavelength. J. Chem. Soc., Faraday Trans. II. 1979;75:790–798. [Google Scholar]
- 13.Rabin I, Schulze W, Ertl G. Light emission during the agglomeration of silver clusters in noble gas matrixes. J. Chem. Phys. 1998;108(12):5137–5142. [Google Scholar]
- 14.Fedrigo S, Harbich W, Buttet J. Optical response of Ag2, Ag3, Au2, and Au3 in argon matrixes. J. Chem. Phys. 1993;99(8):5712–5717. [Google Scholar]
- 15.Bonacic-Koutecky V, Pittner J, Boiron M, Fantucci P. An accurate relativistic effective core potential for excited states of Ag atom: An application for studying the absorption spectra of Agn and Agn(+) clusters. J. Chem. Phys. 1999;110(8):3876–3886. [Google Scholar]
- 16.Ershov BG, Ionova GV, Kiseleva AA. Silver clusters: Calculations of the optical transitions and the formation and properties of “magic” positively charged cluster. Russ. J. Phys. Chem. 1995;69(2):239–248. [Google Scholar]
- 17.Henglein A, Mulvaney P, Linnert T. Chemistry of Agn aggregates in aqueous-solution–Nonmetallic oligomeric clusters and metallic particles. Faraday Discuss. 1991;92:31–44. [Google Scholar]
- 18.Henglein A, Linnert T, Mulvaney P. Reduction of Ag+ in aqueous polyanion solution–Some properties and reactions of long-lived oligomeric silver clusters and metallic silver particles. Ber. Bunsen-Ges. Phys. Chem. Chem. Phys. 1990;94(12):1449–1457. [Google Scholar]
- 19.Janata E. Structure of the trimer silver cluster Ag32+ J. Phys. Chem. B. 2003;107(30):7334–7336. [Google Scholar]
- 20.Bonacic-Koutecky V, Veyret V, Mitric R. Ab initio study of the absorption spectra of Ag-n (n = 5–8) clusters. J. Chem. Phys. 2001;115(22):10450–10460. [Google Scholar]
- 21.Treguer M, Rocco F, Lelong G, Le Nestour A, Cardinal T, Maali A, Lounis B. Fluorescent silver oligomeric clusters and colloidal particles. Solid State Sci. 2005;7(7):812–818. [Google Scholar]
- 22.Henglein A, Linnert T, Mulvaney P. Reduction of Ag+ in aqueous polyanion solution–Some properties and reactions of long-lived oligomeric silver clusters and metallic silver particles. Ber. Bunsen-Ges. Phys. Chem. Chem. Phys. 1990;94(12):1449–1457. [Google Scholar]
- 23.Ershov BG, Henglein A. Reduction of Ag+ on polyacrylate chains in aqueous solution. J. Phys. Chem. B. 1998;102(52):10663–10666. [Google Scholar]
- 24.Daune M, Kekker CA, Schachman HK. Complexes of silver ion with natural and synthetic polynucleotides. Biopolymers. 1966;4:51–76. [Google Scholar]
- 25.Guéron M, Leroy JL. The i-motif in nucleic acids. Curr. Opin. Struct. Biol. 2000;10(3):326–331. doi: 10.1016/s0959-440x(00)00091-9. [DOI] [PubMed] [Google Scholar]
- 26.Menzer S, Sabat M, Lippert B. Ag(I) modified base-pairs involving complementary (G, C) and noncomplementary (A, C) nucleobases. On the possible structural role of aqua ligands in metal-modified nucleobase pairs. J. Am. Chem. Soc. 1992;114(12):4644–4649. [Google Scholar]
- 27.Wagenknecht H-A. Metal-mediated DNA base pairing and metal arrays in artificial DNA: Towards new nanodevices. Angew. Chem., Int. Ed. 2003;42(28):3204–3206. doi: 10.1002/anie.200301661. [DOI] [PubMed] [Google Scholar]
- 28.Marzilli L. Metal-ion interactions with nucleic acids and nucleic acid derivatives. In: Lippard SJ, editor. Progress in Inorganic Chemistry. Vol. 23. New York: John Wiley and Sons; 1977. pp. 255–378. [Google Scholar]


