

Abstract
Brains of 18 children with dyslexia (5 girls, 13 boys) and 21 and without dyslexia (8 girls, 13 boys) were scanned before and after the children with dyslexia received instructional treatment. Both at Time 1 and Time 2 all children performed an fMRI phoneme mapping task during brain scanning—deciding whether letter(s) in pair of pronounceable nonwords could stand for the same sound. Results were analyzed with a seed point correlational method for functional connectivity from four seed points based on prior studies: inferior frontal gyrus, middle frontal gyrus, the occipital region, and cerebellum. At Time 1 before treatment, a significant difference in fMRI connectivity occurred between children with dyslexia and normal reading controls in the left inferior frontal gyrus and its correlations with right and left middle frontal gyrus, right and left supplemental motor area, left precentral gyrus, and right superior frontal gyrus. There were no significant differences for the seed regions placed in the middle frontal gyrus, occipital gyrus or cerebellum. Children with dyslexia had greater functional connectivity from the left inferior frontal gyrus seed point to the right inferior frontal gyrus than did the children without dyslexia. Compared to adults with and without dyslexia who differed in bilateral connectivity from left inferior frontal gyrus on the same task, the children with and without dyslexia differed in left side connectivity from left inferior frontal gyrus. At Time 2 after treatment, the children with dyslexia, who had participated in a three-week instructional program that provided explicit instruction in linguistic awareness, alphabetic principle (taught in a way to maximize temporal contiguity of grapheme-phoneme associations), decoding and spelling, and a writers’ workshop, did not differ from the children without dyslexia in any of the clusters in the group difference map identifying differences between dyslexics and good readers, showing that functional connectivity (and not just regions of interest) may normalize following instructional treatment.
Abnormal fMRI connectivity in Children with Dyslexia During a Phoneme Task: Before But Not After Treatment
New Issue in Functional Brain Imaging Research
A variety of brain imaging tools have documented structural (MRI or DTI), chemical (MRSI), functional, (rCBF, PET, fMRI), and temporal (EEG, ERP, MSI) differences between adults or children with dyslexia and good readers of comparable age (for review, see Berninger & Richards, 2002). These structural and functional differences between dyslexics and good readers are often associated with phonological processing (Eckert et al., 2003; Eden et al., 2004; Fulbright et al., 1999; Horwitz et al., 1998; Paulesu et al., 1996; Pugh 2000; Richards et al., 2002; Schulte-Körne et al., 1998; Shaywitz et al., 1998, 2003; Simos et al., 2000). This large and growing body of research also provides strong support for the definition of dyslexia adopted by the International Dyslexia Association (Lyon, Shaywitz, & Shaywitz, 2003) that dyslexia is unexpected difficulty in oral reading accuracy and fluency and spelling of neurobiological origin. For the most part, the functional studies have identified regions that differentiated those with and without dyslexia on the basis of (a) the largest spatial extent of significant activation when all brain regions are considered or (b) Regions of Interest (ROI). ROI’s are based on previous research or theory-driven hypotheses. Recently, some functional imaging studies have adopted a new approach that assesses functional connectivity, that is, which brain regions may be co-activated in time, suggesting that they are functionally connected neural networks. Although this special issue is mainly focused on electrophysiological studies, which are ideally suited for studying the temporal characteristics of processing, fMRI functional connectivity may provide additional information about the temporal coordination of brain regions during specific tasks.
Functional Connectivity Studies of Dyslexia
Functional connectivity is a powerful noninvasive technique used to investigate the distribution of neural networks in participants who are normal controls and who have well characterized clinical disorders. In the first PET functional connectivity study of dyslexia, Horwitz et al. (1998) investigated the angular gyrus and its connections during phonological processing. They found lack of coherence between measurements in the angular gyrus and parieto-temporal regions, suggesting functional disconnection between the brain regions involved in the phonological analysis process at the initial stages of phonological decoding.
When this method is applied to fMRI data, functionally connected regions of the brain can be characterized by low-frequency fluctuations in the BOLD signal when the subject is performing a continuous task (Hampson et al., 2002; Lowe et al., 1998). The BOLD response of a continuous task leads to coherent signal changes in anatomically disjoint, but functionally connected, brain structures and thus implies the existence of neuronal connections between these regions. In the first fMRI functional connectivity study, Pugh et al. (2000) showed functional disconnections between the angular gyrus and parietal regions in the left hemisphere specific to the phonological processing. In another fMRI study, Shaywitz et al. (2003) compared functional connections associated with the left occipitotemporal region between persistently poor adult readers and non-impaired readers. Functional connectivity between the occipitotemporal region and inferior frontal gyrus in the left hemisphere was found to be present in controls under a real-word reading condition. Poor readers, in contrast, exhibited functional connections between the left occipitotemporal region and right middle and inferior frontal gyri.
Effective connectivity studies assume unidirectional influences in fMRI connectivity. Using this approach, Bitan et al. (2005) found both common and unique functional connectivity in left cortex for a rhyme judgment and spelling task. The common connectivity was in inferior frontal gyrus and fusiform gyrus. The unique connectivity for rhyming was in lateral temporal cortex and for spelling was in intraparietal sulcus. They proposed that the inferior frontal gyrus plays a role in mediating task-specific changes in connectivity. This proposal is consistent with other findings that the inferior frontal gyrus may serve as the central executive for the networks in the language system (Richards et al., 2006-b).
Structural abnormalities in white matter pathways could interfere with neuronal transmission, which will directly affect the synchrony of the BOLD signal. Specific low-frequency temporal correlations between the brain regions involved in phonological processing should reflect these interregional dissociations and show functional differences in the interregional connection in the two populations. Stanberry et al. (2006) reported differences in fMRI connectivity in adults with and without dyslexia during phoneme mapping. Analysis of correlations in the low-frequency range showed that regions known to activate during an "on-off" phoneme-mapping task exhibited synchronous signal changes when the task was administered continuously (without any "off" periods). Results showed that three functional networks, which were defined on the basis of documented structural deficits in dyslexics (Eckert et al., 2003) and included regions associated with phonological and orthographic processing, differed significantly in spatial extent between good readers and dyslexics: left inferior frontal gyrus, right inferior frontal gyrus, and bilateral cerebellum.
Purpose of the Current Study
The purpose of this research is to extend previous research with children, which analyzed results using a traditional on-off paradigm (and focused on orthographic and morpheme mapping) (Richards et al., 2006a), to conduct a functional connectivity analysis of the phoneme mapping task. The goal was to compare results of functional connectivity during phoneme mapping in children with the previously published results of functional connectivity during phoneme mapping in adults (Stanberry et al., 2006). To make the task, first used by Aylward et al. (2003), comparable for the children and the adults, who performed the task continuously rather than in alternating on-off conditions (Stanberry et al. (2006)), we analyzed functional connectivity for only the “on” task condition of phoneme mapping in the children. The adults had not performed the off condition of letter string judgments to control for orthographic processes in phoneme mapping. Thus, the functional connectivity analyses in Stanberry et al. for adults and in this article for children for phoneme mapping are assessing the mapping of phonemes onto letters.
The phoneme task assessed knowledge of the alternations that characterize alphabetic principle in English—the same phoneme can be spelled by more than one grapheme (1- or 2- letter unit) (Venezky, 1970). These alternations are predictable for decoding but have to be memorized for spelling specific words. For example, c, k, ck, and ch can signal /k/ as in cat, kitten, chicks, and psychology. The phoneme task required the child to decide if the letter(s) in pink in each pronounceable, nonsense word could stand for the same sound in decoding the words. For example, the ck in ruck and c in gace could not stand for the same sound but the c in carm and ck in gick could.
Methods
Participants
Eighteen children with dyslexia (5 girls, 13 boys) and 21 good readers and spellers (8 girls, 13 boys) participated in this study. The children with dyslexia were recruited from a family genetics study and met the research inclusion criteria for dyslexia (Berninger et al., 2001-b, 2006): a) Verbal IQ of at least 90 (top 75% of the population and less likely to be confounded with neurogenetic disorders that are more frequent in the lower quartile of the IQ distribution), and (b) unexpectedly low reading and spelling achievement (below the population mean and at least one standard deviation below their Verbal IQ). However, the children who qualified tended to have reading and writing skills that were on average about 1 and 2/3 SD below their Verbal IQs (Berninger et al., 2006). Verbal IQ was used instead of Full Scale IQ based on prior research showing that Verbal IQ is a better predictor of reading achievement than Performance IQ (reviewed in Berninger et al., 2001). The controls met the inclusion criteria of reading and spelling above the population mean. Exclusion criteria for both children with and without dyslexia included left-handedness and non-removable metal, such as oral braces, and hearing or vision problems.
The children with and without dyslexia did not differ significantly in sex or age but there was a slight yet reliable difference in their average Verbal IQs which were above average (see Table 1 in Richards et al., 2006-a). The children with dyslexia were significantly below their Verbal IQ and the mean standard score for age on the Word Identification (reading real words) and Word Attack (reading pseudowords) subtests of the Woodcock Reading Mastery Test (Woodcock 1987) and on the Spelling subtest of the Wide Range Achievement Test, Third Edition (Wilkinson 1993). Participants without dyslexia differed significantly from those with dyslexia on these tests and were at or above the population mean on them. The controls had substantially higher phonological, orthographic, and rapid automatic naming and switching skills, all of which are markers of dyslexia (Berninger et al., 2001), as measured, respectively, by CTOPP Elision (Wagner and Torgesen 1999), PAL Expressive Orthographic Coding (Berninger 2001) and Wolf RAN (Letters) (Wolf 1986; Wolf and others 1986) and Wolf RAS (Numbers and Child fMRI Connectivity Phoneme Mapping submitted Letters) (Wolf 1986; Wolf et al., 1986). The Human Subjects Institutional Review Board where the study was conducted approved this study, and each participating child (as well as parent/guardian) gave written informed consent.
Table 1.
Cluster table results for the group difference map comparing dyslexics versus controls for seed point from left inferior frontal gyrus.
| Cluster Index | Voxels | P | −Log10(P) | Max Z | x (mm) | y (mm) | z (mm) | |
|---|---|---|---|---|---|---|---|---|
| 2 | 1333 | 6.26e-06 | 5.2 | 4.22 | 32 | 0 | 36 | Cluster includes: right middle frontal gyrus, right superior frontal gyrus, right suppl. motor area |
| 1 | 802 | 0.000747 | 3.13 | 3.83 | −32 | −2 | 38 | cluster includes: left middle frontal gyrus, left precentral gyrus, left suppl. motor area |
Acquisition of MRI and fMRI Scans and Imaging Task
Scan acquisition
Structural and functional MR imaging were performed on a 1.5 T MR imaging system (General Electric, Waukesha, version 5.8). Scanning included a 21-slice axial high resolution set of anatomical images in plane with functional data (TR/TE 200/2.2 ms; fast spoiled gradient echo pulse sequence; 6 mm thick with 1 mm gap; 256×256 matrix). This anatomical series was followed by four fMRI series using 2-dimensional gradient echo echoplanar pulse sequence (TR/TE 3000/50 ms, 21 slices; 6 mm thick with 1 mm gap, 64×64 matrix, 114 volumes total). Each functional MRI scan lasted 5 min and 42 s.
fMRI task
Before the scan the children were thoroughly trained on each task to ensure that they understood what they would be asked to do inside the scanner. During the fMRI scanning, there were four repetitions of the on task, each lasting 30 s each. In addition, a fixation condition (cross-hair), lasting 18 s, was presented at the beginning, in the middle, and at the end of the series in order to provide a standard baseline. A slide with instructions appeared for 6 s before each replication. Visual word pairs were presented for 6 s, with no interstimulus interval. Children indicated a ‘yes’ response by pressing a button held in the dominant hand. The button press had to occur during the 6-s stimulus presentation to be counted as correct. Half of the items had ‘yes’ as the correct answer. Stimuli were presented and responses were recorded using Eprime software (Psychology Software Tools, Pittsburgh, PA). The children viewed the visual stimuli through a pair of goggles that was connected via high resolution fiber optic cables to two Infocus projectors, which were, in turn, connected to the Eprime computer.
As explained earlier, only the on task stimuli were analyzed so that results for the children could be compared to the results for adults. For this task condition, a pair of nonsense words, each containing a letter or group of letters printed in pink, was presented visually, one above the other. The child pressed a button if the pink letters in the top pseudoword could represent the same sound as the pink letters in the bottom pseudoword (e.g. pleak-leeze), but did not press the button if the pink letters could not stand for the same word (e.g. pheak-panch).
fMRI Image Analysis
In this article we report the time series fMRI data analyzed for connectivity using a seed point correlation method similar to Greicius et al. (2003). The four methods most commonly used in functional connectivity are clustering, independent component analysis, principal component analysis, and seed voxel correlation analysis (see Stanberry et al., 2006). In the seed voxel method chosen for this analysis, functional connectivity results depend on the seed voxel or region selected.
Initially the fMRI data were analyzed using FSL software (FMRIB's Software Library, www.fmrib.ox.ac.uk/fsl) to preprocess the data and remove low frequency drifts. The following pre-statistics processing was applied using FSL (FMRIB's Software Library, www.fmrib.ox.ac.uk/fsl): motion correction using MCFLIRT (Jenkinson and others 2002); non-brain removal using BET (Smith 2002); spatial smoothing using a Gaussian kernel of FWHM 5mm; highpass temporal filtering (Gaussian-weighted LSF straight line fitting, with sigma=30.0s). Four ROI seed regions were chosen in the inferior frontal gyrus, middle frontal gyrus, the occipital region, and cerebellum based on the control group maps block design analysis and based on prior publications on the phoneme mapping task. In the control group fMRI map, the activation was bilateral for these regions but much stronger on the left side.
The fMRI signals within all voxels in the ROI were averaged for each time point. The resulting time series, representing the average intensity within the ROI was then used in a correlational analysis across the whole brain; only the part of the time series that corresponded to the “on” task of the phoneme task was used (after time shifting the data to account for hemodynamic lag). In other words, a correlation coefficient was calculated at each voxel in the brain for the phoneme task. The resultant individual correlation maps were co-registered to the standard brain and analysis (AVG152 provided by FSL) was carried out using FLIRT (Jenkinson and others 2002; Jenkinson and Smith 2001).
Group level
The correlation maps for the individual children were aggregated for the group in a random effects analysis. Higher-level analyses were carried out using FLAME (FMRIB's Local Analysis of Mixed Effects) (Beckmann et. al., 2003; Woolrich et al., 2004). FLAME uses sophisticated methods for modeling and estimating the inter-session or inter-subject random-effects component of the mixed-effects variance by using MCMC (Markov Chain Monte Carlo randomization) to get an accurate estimation of the true random-effects variance and degrees of freedom at each voxel. Z (Gaussianised T/F) statistic images were thresholded using clusters determined by Z>2.3 and a (corrected) cluster significance threshold of p=0.01 (Worsley and others 1992). The main contrast of interest was the comparison between dyslexics and controls for each seed ROI.
Results
Time 1 before treatment
A significant difference in fMRI connectivity occurred between children with dyslexia and normal reading controls in the left inferior frontal gyrus and its correlations with right and left middle frontal gyrus, right and left supplemental motor area, left precentral gyrus, and right superior frontal gyrus. Table 1 shows the cluster table results for this group difference map. The clusters in Table 1 represent the areas of brain where there was a significant difference between dyslexics and controls for the connectivity correlation value when the seed point was placed in the left inferior frontal gyrus. There were no significant differences for the seed regions placed in the middle frontal gyrus, occipital gyrus or cerebellum. Figure 1 also illustrates the difference in functional connectivity for the seed region in left inferior frontal gyrus. Note that the children with dyslexia had greater functional connectivity from the left inferior frontal gyrus seed point to the right inferior frontal gyrus than did the children without dyslexia.
Figure 1. Group difference map for dyslexics greater than controls.
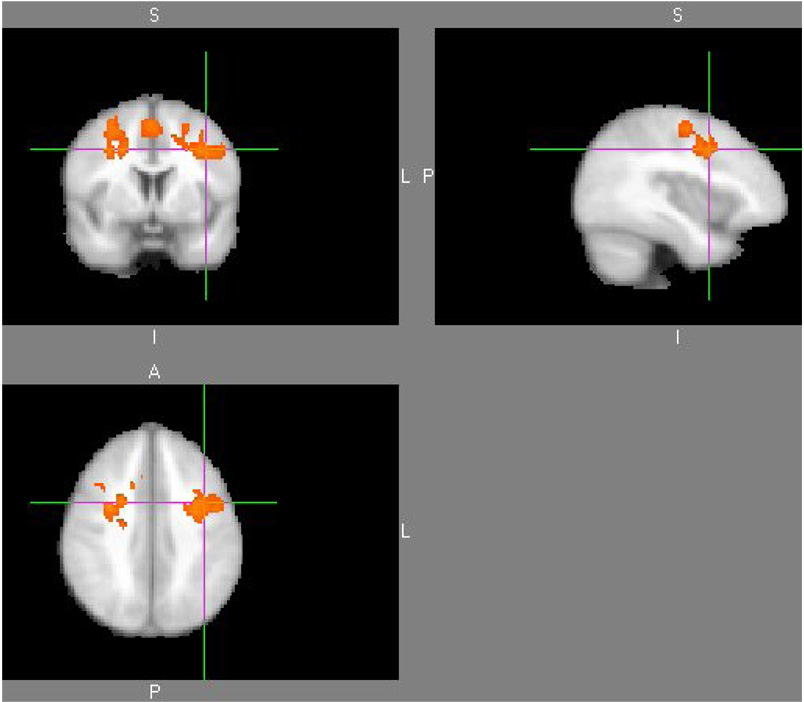
The individual maps used in this analysis were correlation maps created when the seed ROI in the left inferior frontal gyrus was compared to the rest of the brain voxels.
Time 2 after treatment
The children with dyslexia also participated in a three-week instructional program that provided explicit instructional in alphabetic principle as well as linguistic awareness training in a writers’ workshop (Berninger, Winn et al., in press, Study 1). Alphabetic principle was taught in a way to maximize temporal contiguity of grapheme-phoneme associations through rapid naming of graphemes and production of phonemes in pictured words. The brains of those with and without dyslexia were scanned both before and after the children with dyslexia received instructional treatment (for details, see Richards et al., 2006-a). Although the children with and without dyslexia differed significantly in functional connectivity from the left inferior frontal gyrus seed point before treatment, after treatment there were no significant clusters in the group difference map comparing those with and without dyslexia. Figure 2 shows the connectivity Z-score plot for a region of interest (ROI) where there was a significant cluster in the group difference map at time 1 for seed point placed in the left inferior frontal gyrus (IFG) and the ROI was placed in the right middle frontal gyrus. Figure 2 shows the effect of treatment because at time 1 there was a significant difference between controls and dyslexics but not at time 2 after treatment.
Figure 2. Connectivity Z-score plot for one example region of interest (ROI) where there was a significant cluster in the group difference map at time 1 for seed point placed in the left inferior frontal gyrus (IFG) and ROI was placed the right middle frontal gyrus.
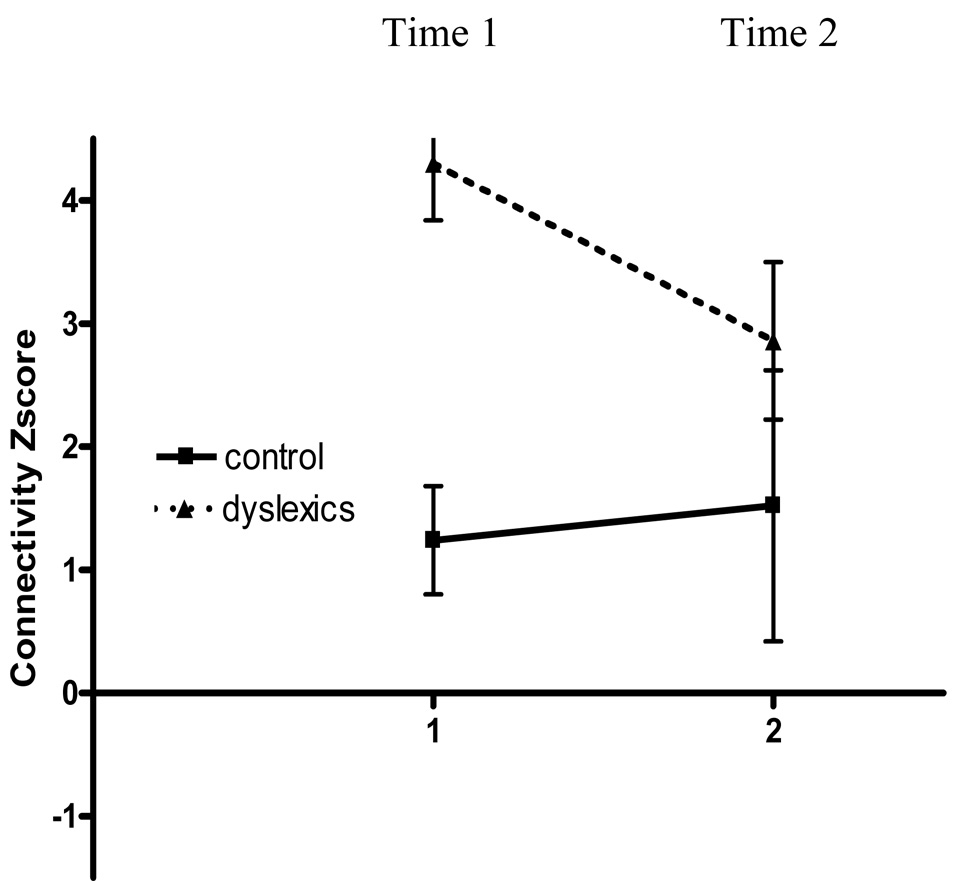
This plot shows that control values are relatively stable over time and that the score for children with dyslexia changes from time 1 (before treatment) to time 2 (after treatment) to become more like the control value. The connectivity Z-score was calculated with FSL FLAME software used to calculate the group maps. Error bars are shown as standard deviation.
Discussion
The results reported here for children for the seed region in the left inferior frontal gyrus, which may house an executive function for controlling the functional language system (Richards et al., 2006-b), were very different than those for adults with and without dyslexia (Stanberry et al., 2006). Stanberry et al. showed that the extent of the functional connectivity was significantly larger for controls than for dyslexics in the right inferior frontal triangularis, right middle occipital gyrus, right inferior occipital gyrus and right cerebellum (VI). However, the current results in children showed greater functional connectivity (from left IFG seed area) for dyslexics compared to controls in right and left middle frontal gyrus, the right and left supplementary motor area, the left precentral gyrus, and the right superior frontal gyrus. Why the aberrant connectivity of adults was exclusively from right IFG (triangularis) to right regions and for children was from left IFT to bilateral regions may reflect developmental issues and requires further research.
The left and right IFG may participate in an executive function panel for coordinating phonological and orthographic processing, respectively; in children deactivation of right IFG was associated with improvements in phonological decoding following instructional treatments (Richards et al., 2006-b). The left IFG and its connections to cerebellum may function as the phonological loop in working memory (see Richards et al., 2006-b). These results are consistent with the results of a recent phenotyping study that pinpointed many problems in children and adults with dyslexia to executive functions for language and the phonological loop of working memory (Berninger et al., 2006). These results are also interesting because Eckert et al. (2003) reported MRI structural differences between children with and without dyslexia in left and right IFG and cerebellum.
The authors acknowledge that with a TR of 3000ms it is difficult to remove all physiological artifacts. However, based on results presented at Human Brain Mapping Annual meeting 2007 poster numbers 296 and 330, our language connectivity results do NOT match the brain regional distribution shown to be cardiac or respiration related. In other words, our connectivity results appear to be language-related and not just cardiac or respiration-related correlations.
Functional connectivity did not differ between children with and without dyslexia from the right middle frontal gyrus (MFG) as a seed point on a phoneme-grapheme judgment task. That region has been implicated in working memory functions supporting writing tasks (Berninger & Winn, 2006). The phoneme task used in this study did not require writing. Likewise, functional connectivity did not differ between children with and without dyslexia in the right occipital gyrus as found in prior research with orthographic and morphological tasks (Richards 2005, 2006-a, 2006-b).
Taken together the results of this study, which may be the first functional connectivity study in children with dyslexia, show that children with dyslexia do differ from children without dyslexia in the temporal coordination of brain regions during a phonological task. This abnormal temporal connectivity may underlie asynchronization of the processes underlying reading that dyslexics exhibit (Breznitz, 2006). Children with dyslexia differed in functional connectivity from left inferior frontal gyrus to middle frontal gyrus (associated with working memory), consistent with a phenotyping study showing a phonological core deficit within each component of an impaired working memory architecture (Berninger, Abbott et al., 2006). This finding of impaired functional connectivity is also consistent with results showing that dyslexia is caused by impaired temporal coordination (Bowers, & Wolf, 1993; Breznitz, 2002). However, instructional intervention that is designed to improve time-sensitive procedural rather than time-free declarative knowledge of grapheme-phoneme correspondences (Berninger et al., 2001; Berninger & Abbott, 2003) may overcome that temporal deficit in children by decreasing the over-connectivity of brain regions in the executive panel of working memory— that is, the left and right inferior frontal gyrus, and their connections to other neural regions involved in temporal coordination such as the cerebellum—and increasing the connectivity between the left inferior frontal gyrus and middle frontal gyrus (working memory).
Footnotes
Grant P50 33812 from the National Institute of Child Health and Human Development (NICHD) supported this research.
Publisher's Disclaimer: This is a PDF file of an unedited manuscript that has been accepted for publication. As a service to our customers we are providing this early version of the manuscript. The manuscript will undergo copyediting, typesetting, and review of the resulting proof before it is published in its final citable form. Please note that during the production process errors may be discovered which could affect the content, and all legal disclaimers that apply to the journal pertain.
References
- Aylward EH, Richards TL, Berninger VW, Nagy WE, Field KM, Grimme AC, Richards AL, Thomson JB, Cramer SC. Instructional treatment associated with changes in brain activation in children with dyslexia. Neurology. 2003;61:212–219. doi: 10.1212/01.wnl.0000068363.05974.64. [DOI] [PubMed] [Google Scholar]
- Beckmann C, Jenkinson M, Smith SM. General multi-level linear modelling for group analysis in FMRI. Neuroimage. 2003;20:1052–1063. doi: 10.1016/S1053-8119(03)00435-X. [DOI] [PubMed] [Google Scholar]
- Berninger V. Process Assesement of the Learner (PAL) Test Battery for Reading and Writing Disabilities. San Antonio, TX: The Psychological Corporation; 2001. [Google Scholar]
- Berninger V, Abbott S. PAL Research Supported Reading and Writing Lessons. San Antonio, TX: The Psychological Corporation; 2003. [Google Scholar]
- Berninger V, Abbott R, Billingsley F, Nagy W. Processes underlying timing and fluency: Efficiency, automaticity, coordination, and morphological awareness. In: Wolf M, editor. Dyslexia, fluency, and the brain. Baltimore: York Press; 2001a. pp. 383–414. [Google Scholar]
- Berninger V, Abbott R, Thomson J, Raskind W. Language phenotype for reading and writing disability: A family approach. Scientific Studies in Reading. 2001b;5:59–105. [Google Scholar]
- Berninger V, Abbott R, Thomson J, Wagner R, Swanson HL, Raskind W. Modeling developmental phonological core deficits within a working memory architecture in children and adults with developmental dyslexia. Scientific Studies in Reading. 2006;10:165–198. [Google Scholar]
- Berninger VW, Richards TL. Brain literacy for educators and psychologists. New York: Academic Press; 2002. [Google Scholar]
- Berninger V, Winn W. Implications of advancements in brain research and technology for writing development, writing instruction, and educational evolution. In: MacArthur C, Graham S, Fitzgerald J, editors. Handbook of Writing Research. New York: Guilford; 2006. pp. 96–114. [Google Scholar]
- Berninger V, Winn W, Stock P, Abbott R, Eschen K, Cindy Lin, Noelia Garcia, Marcy Anderson-Youngstrom, Heather Murphy, Lovitt D, Trivedi P, Jones J, Dagmar Jones, Nagy W. Tier 3 specialized writing instruction for students with dyslexia. Reading and Writing. An Interdisciplinary Journal. (in press) [Google Scholar]
- Bitan T, Booth J, Choy J, Burman D, Gietlman D, Mesulam M. Shifts of effective connectivity within a language network during rhyming and spelling. Journal of Neuroscience. 2005;25:5397–5403. doi: 10.1523/JNEUROSCI.0864-05.2005. [DOI] [PMC free article] [PubMed] [Google Scholar]
- Bowers P, Wolf M. Theoretical links between naming speed, precise timing mechanisms, and orthographic skill in dyslexia. Reading and Writing. An International Journal. 1993;5:69–85. [Google Scholar]
- Breznitz Z. Asynchrony of visual-orthographic and auditory-phonological word recognition processes: An underlying factor in dyslexia. Journal of Reading and Writing. 2002;15:15–42. [Google Scholar]
- Breznitz Z. Fluency in reading. Synchronization of processes. Malwah, NJ: Lawrence Erlbaum; 2006. [Google Scholar]
- Eckert MA, Leonard CM, Richards TL, Aylward EH, Thomson J, Berninger VW. Anatomical correlates of dyslexia: frontal and cerebellar findings. Brain. 2003;126(Pt 2):482–494. doi: 10.1093/brain/awg026. [DOI] [PubMed] [Google Scholar]
- Eden GF, Jones KM, Cappell K, Gareau L, Wood FB, Zeffiro TA, Dietz NA, Agnew JA, Flowers DL. Neural changes following remediation in adult developmental dyslexia. Neuron. 2004;44:411–422. doi: 10.1016/j.neuron.2004.10.019. [DOI] [PubMed] [Google Scholar]
- Fulbright RK, Jenner AR, Mencl WE, Pugh KR, Shaywitz BA, Shaywitz SE, Frost SJ, Skudlarski P, Constable RT, Lacadie CM, et al. The cerebellum's role in reading: a functional MR imaging study. American Journal of Neuroradiology. 1999;20:1925–1930. [PMC free article] [PubMed] [Google Scholar]
- Greicius MD, Krasnow B, Reiss AL, Menon V. Functional connectivity in the resting brain: a network analysis of the default mode hypothesis. Proceedings of National Academy of Sciences U S A. 2003;100:253–258. doi: 10.1073/pnas.0135058100. [DOI] [PMC free article] [PubMed] [Google Scholar]
- Hampson M, Peterson B, Skudlarski P, Gatenby J, Gore J. Detection of functional connectivity using temporal correlations in MR images. Human Brain Mapping. 2002;15:247–262. doi: 10.1002/hbm.10022. [DOI] [PMC free article] [PubMed] [Google Scholar]
- Horwitz B, Rumsey JM, Donohue BC. Functional connectivity of the angular gyrus in normal reading and dyslexia. Proceedings of National Academy of Sciences U S A. 1998;95:8939–8944. doi: 10.1073/pnas.95.15.8939. [DOI] [PMC free article] [PubMed] [Google Scholar]
- Jenkinson M, Bannister P, Brady M, Smith S. Improved Optimisation for the Robust and Accurate Linear Registration and Motion Correction of Brain Images. Neuroimage. 2002;17:825–841. doi: 10.1016/s1053-8119(02)91132-8. [DOI] [PubMed] [Google Scholar]
- Jenkinson M, Smith S. A global optimisation method for robust affine registration of brain images. Medical Image Analysis. 2001;5:143–156. doi: 10.1016/s1361-8415(01)00036-6. [DOI] [PubMed] [Google Scholar]
- Lowe M, Mock B, Sorenson J. Functional connectivity in single and multislice echoplanar imaging using resting-state fluctuations. Neuroimage. 1998;7:119–132. doi: 10.1006/nimg.1997.0315. [DOI] [PubMed] [Google Scholar]
- Lyon GR, Shaywitz S, Shaywitz B. A definition of dyslexia. Annals of Dyslexia. 2003;53:1–14. [Google Scholar]
- Paulesu E, Frith U, Snowling M, Gallagher A, Morton J, Frackowiak RS, Frith CD. Is developmental dyslexia a disconnection syndrome? Evidence from PET scanning. Brain. 1996;119(Pt 1):143–157. doi: 10.1093/brain/119.1.143. [DOI] [PubMed] [Google Scholar]
- Pugh K, Mencl W, Shaywitz B, Shaywitz S, Fulbright R, Constable R, Skudlarski P, Marchione K, Jenner A, Fletcher J, Liberman A, Shankweiler D, Katz L, Lacadie C, Gore J. The angular gyrus in developmental dyslexia: Task-specific differences in functional connectivity within posterior cortex. Psychological Science. 2000;11:51–56. doi: 10.1111/1467-9280.00214. [DOI] [PubMed] [Google Scholar]
- Richards T, Aylward E, Berninger V, Field K, Parsons A, Richards A, Nagy W. Individual fMRI activation in orthographic mapping and morpheme mapping after orthographic or morphological spelling treatment in child dyslexics. Journal of Neurolinguistics. 2006a;19:56–86. [Google Scholar]
- Richards T, Aylward E, Raskind W, Abbott R, Field K, Parsons A, Richards A, Nagy W, Eckert M, Leonard C, Berninger V. Converging evidence for triple word form theory in children with dyslexia. Developmental Neuropsychology. 2006b;30:547–589. doi: 10.1207/s15326942dn3001_3. [DOI] [PubMed] [Google Scholar]
- Richards TL, Berninger VW, Aylward EH, Richards AL, Thomson JB, Nagy WE, Carlisle JF, Dager SR, Abbott RD. Reproducibility of proton MR spectroscopic imaging (PEPSI): comparison of dyslexic and normal-reading children and effects of treatment on brain lactate levels during language tasks. American Journal of Neuroradiology. 2002;23:1678–1685. [PMC free article] [PubMed] [Google Scholar]
- Richards T, Berninger V, Nagy W, Parsons A, Field K, Richards A. Brain activation during language task contrasts in children with and without dyslexia: Inferring mapping processes and assessing response to spelling instruction. Educational and Child Psychology. 2005;22(2):62–80. [Google Scholar]
- Schulte-Körne G, Grimm T, Nöthen MM, Müller-Myshok B, Cichon S, Vogt IR, Propping P, Remschmidt H. Evidence for linkage of spelling disability to chromosome 15. American Journal of Human Genetics. 1998;63:279–282. doi: 10.1086/301919. [DOI] [PMC free article] [PubMed] [Google Scholar]
- Shaywitz SE, Shaywitz BA, Fulbright RK, Skudlarski P, Mencl WE, Constable RT, Pugh KR, Holahan JM, Marchione KE, Fletcher JM, et al. Neural systems for compensation and persistence: young adult outcome of childhood reading disability. Biological Psychiatry. 2003;54:25–33. doi: 10.1016/s0006-3223(02)01836-x. [DOI] [PubMed] [Google Scholar]
- Shaywitz SE, Shaywitz BA, Pugh KR, Fulbright RK, Constable RT, Mencl WE, Shankweiler DP, Liberman AM, Skudlarski P, Fletcher JM, et al. Functional disruption in the organization of the brain for reading in dyslexia. Proceedings of National Academy of Sciences. 1998;95:2636–2641. doi: 10.1073/pnas.95.5.2636. [DOI] [PMC free article] [PubMed] [Google Scholar]
- Simos PG, Breier JI, Fletcher JM, Bergman E, Papanicolaou AC. Cerebral mechanisms involved in word reading in dyslexic children: A magnetic source imaging approach. Cerebral Cortex. 2000;10:809–816. doi: 10.1093/cercor/10.8.809. [DOI] [PubMed] [Google Scholar]
- Smith S. Fast Robust Automated Brain Extraction. Human Brain Mapping. 2002;17:143–155. doi: 10.1002/hbm.10062. [DOI] [PMC free article] [PubMed] [Google Scholar]
- Stanberry LI, Richards T, Berninger VW, Stock P, Nandy RR, Aylward E, Maravilla K, Cordes D. Low frequency signal changes reflect differences in functional connectivity between good readers and dyslexics during continuous phoneme mapping. Magnetic Resonance Imaging. 2006;24:217–229. doi: 10.1016/j.mri.2005.12.006. [DOI] [PubMed] [Google Scholar]
- Torgesen J, Wagner R, Rashotte C. Test of word reading efficiency. Austin, TX: ProEd; 1999. [Google Scholar]
- Venezky R. The structure of English orthography. The Hague: Mouton; 1970. [Google Scholar]
- Wagner R, Torgesen J. Comprehensive Test of Phonological Processing. Austin, TX: Pro-Ed; 1999. [Google Scholar]
- Wechsler D. Wechsler Individual Achievement Test (WIAT) 2nd Edition. San Antonio, TX: The Psychological Corporation; 2001. [Google Scholar]
- Wilkinson G. Wide range achievement test-3 (WRAT-3) Wilmington, DE: Jastak Associates; 1993. [Google Scholar]
- Wolf M. Rapid alternation stimulus naming in the developmental dyslexias. Brain and Language. 1986;27:360–379. doi: 10.1016/0093-934x(86)90025-8. [DOI] [PubMed] [Google Scholar]
- Wolf M, Bally V, Morris R. Automaticity, retrieval processes, and reading: A longitudinal study in average and impaired reading. Child Development. 1986;57:988–1000. doi: 10.1111/j.1467-8624.1986.tb00260.x. [DOI] [PubMed] [Google Scholar]
- Woodcock R. Woodcock reading mastery test - revised. Circle Pine, MN: American Guidance Service; 1987. [Google Scholar]
- Woolrich MW, Behrens TEJ, Beckmann CF, Jenkinson M, Smith SM. Multi-level linear modelling for FMRI group analysis using Bayesian inference. Neuroimage. 2004;21:1732–1747. doi: 10.1016/j.neuroimage.2003.12.023. [DOI] [PubMed] [Google Scholar]
- Worsley KJ, Evans AC, Marrett S, Neelin P. A three-dimensional statistical analysis for CBF activation studies in human brain. Journal of Cerebral Blood Flow and Metabolism. 1992;12:900–918. doi: 10.1038/jcbfm.1992.127. [DOI] [PubMed] [Google Scholar]