Abstract
Objective
To describe a considerably advanced method of array painting, which allows the rapid, ultra‐high resolution mapping of translocation breakpoints such that rearrangement junction fragments can be amplified directly and sequenced.
Method
Ultra‐high resolution array painting involves the hybridisation of probes generated by the amplification of small numbers of flow‐sorted derivative chromosomes to oligonucleotide arrays designed to tile breakpoint regions at extremely high resolution.
Results and discussion
How ultra‐high resolution array painting of four balanced translocation cases rapidly and efficiently maps breakpoints to a point where junction fragments can be amplified easily and sequenced is demonstrated. With this new development, breakpoints can be mapped using just two array experiments: the first using whole‐genome array painting to tiling resolution large insert clone arrays, the second using ultra‐high‐resolution oligonucleotide arrays targeted to the breakpoint regions. In this way, breakpoints can be mapped and then sequenced in a few weeks.
Keywords: array painting, array‐CGH, oligonucleotide array, transloction breakpoints
De novo balanced reciprocal translocations are associated with genomic disease in approximately 6% of ascertained cases.1 The clinical phenotype associated with these cases may be caused by direct disruption of a gene or genes at the breakpoint,2,3,4,5 by separation of cis‐regulatory elements from the genes they control,6,7,8 by the presence of unsuspected microdeletions or microduplications9,10 or perhaps by a chance association.
For the identification of gene disruption or separation of genes from their regulatory elements, it is necessary to map the breakpoints to very high resolution and ideally to the sequence level. To date, such high‐resolution analysis has been restricted to a relatively small number of studies, as the methods used have been time consuming or technically challenging. Generally, fluorescence in situ hybridisation (FISH) is used to map large insert clones to metaphase spreads of the patient. Identification of signals that are split by the rearrangement localises the breakpoint within the sequence of the clone. However, the resolution afforded by FISH is rarely sufficient to unequivocally identify gene disruption except in cases where the gene is larger than the FISH probe. For this reason, further higher resolution mapping is usually required. For example, McMullan et al4 used FISH to identify clones spanning the breakpoints of a patient with bilateral isolated ptosis carrying a balanced translocation between chromosomes 1 and 8. They then refined the breakpoints further using flow‐sorted derivative chromosomes as the target for sequence‐tagged site polymerase chain reaction (PCR) walking across the breakpoint regions, with primer pairs designed from the sequence of the spanning clones. Using forward and reverse primers that mapped closest to and on either side of the breakpoints, they were able to generate junction fragments by PCR and thus sequence the breakpoints. The gene ZFH‐4 was disrupted at the chromosome 8 breakpoint, and thus was identified as a candidate gene for ptosis. Other strategies for breakpoint mapping have included the separation of the derivative chromosomes from each other and from their normal homologues in somatic cell hybrids, which then allows the identification of altered restriction fragments at breakpoint junctions. The altered fragments can then be cloned and sequenced.2,3,11,12 Alternatively, inverse or vectorette PCR has been used to generate junction fragments for sequencing.7,13,14,15,16
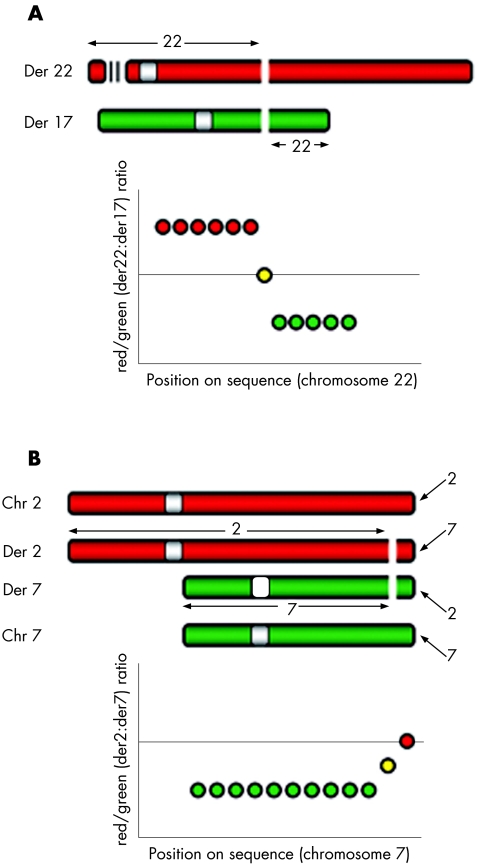
The development of array comparative genomic hybridisation (CGH)17 has greatly improved the efficiency with which unbalanced breakpoints can be mapped. Array‐CGH uses DNA microarrays as the target for comparative hybridisation of differentially fluorescence‐labelled test and reference genomes. Analysis of the fluorescence ratio of each probe on the array positioned on to the human reference sequence allows identification and mapping of gains and losses (and their breakpoints) across the genome. However, array‐CGH cannot be used for the analysis of rearrangements in which DNA is not lost or gained, such as in balanced translocations. Array painting18 is a variant of array‐CGH that overcomes this limitation. In array painting, the derivative chromosomes are separated from the rest of the genome by flow sorting18,19 or by the use of somatic cell hybrids.9 They are then differentially labelled and hybridised to the array. The differential labelling of the two derivative chromosomes results in the chromosomal material from one side of the translocation breakpoint being labelled in a different colour to the material on the other side of the breakpoint. When hybridised to an array, this translates to high ratios proximal to the breakpoint and low ratios distal to the breakpoint (or vice versa) so that the breakpoint region is easily mapped at a resolution provided by the array (fig 1). If a probe spans the breakpoint, it can be identified easily as an intermediate ratio is generated. Using array painting we have shown previously not only how breakpoints can be mapped efficiently but also that unsuspected karyotype complexity can be disclosed.10
Figure 1 Principles of array painting. (A) Expected ratios across the chromosome 22 breakpoint of case 1. (B). Expected ratios across the chromosome 7 breakpoint of case 2. Chr, chromosome; Der, derivative.
Although array painting using arrays constructed from large insert clones allows the rapid mapping of balanced translocation breakpoints, the resolution achieved is only equivalent to FISH and hence is rarely sufficient for unequivocal identification of gene disruption. Typically, breakpoints are mapped using large insert clones to a resolution of approximately 170 kb for bacteria artificial clones, and in some cases where fosmids or cosmids have been used, down to 40 kb. However, the resolution of array‐CGH or array painting can be increased by decreasing the size, or increasing the density, of the probes on the array. In this paper, we describe the use of array painting with ultra‐high resolution custom arrays designed to breakpoint spanning regions previously mapped using large insert clone arrays and FISH.10,20 The ultra‐high resolution arrays were constructed using isothermal oligonucleotide probes varying in size between 45 and 77 bp in length and with a spacing of as low as 1 bp in the repeat‐masked sequence. The arrays were used for further mapping of balanced translocation breakpoints using array painting. Furthermore, we show that this ultra‐high resolution mapping is sufficient to allow the direct design of primers for the PCR amplification of junction fragments and so enable the rapid sequencing of translocation breakpoints.
Methods
Patients
Three of the samples from patients with balanced translocation used in this study have been described previously,10 and comprised cases B1, C1 and C2 in that study. In addition, we analysed a translocation from a phenotypically normal person, case 2 in Baptista et al.20 Breakpoint spanning clones had been identified previously using FISH (table 1). Brief descriptions of the patients' histories are given below.
Table 1 Breakpoint positions estimated from ultra‐high resolution array painting and direct sequencing.
| Case | Chromosome | Spanning clone | Genomic region on array | Breakpoint estimated from array | Estimate size (bp) | Breakpoint position from sequence |
|---|---|---|---|---|---|---|
| 1 | 17 | RP11–46E17 | 35364797–35759534 | 35586230–35586285 | 55 | 35586264–35586265 |
| 22 | RP11–737D6 | 25986408–26360284 | 26187761–26188038 | 277 | 26187922–26187923 | |
| 2 | 2 | RP11–263G22 | 234710316–234819026 | 234717690–234721779 | 4089 | 234721701–234721710 |
| 7 | RP11–69O3 | 155000362–155155098 | 155080332–155083499 or | 3167 | 155083383–155083386 | |
| 155082971–155083499 | 528 | |||||
| 3 | 2 | RP11–680O16 | 236450000–236650000 | 236548539–236548680 | 141 | 236548579 236548580–236548586 deleted |
| 7 | CTA–471E18 | 30950000–31300000 | 30983401–30983890 | 489 | 30983604–30983607 | |
| 4 | 11 | RP11–2G8 | 37759156–37934090 | 37796297–37800407 | 4110 | 37800038 37800039–37800040 deleted |
| 17 | CTD–3083J7 | 12646560–12823755 | 12753019–12760242 | 7223 | 12755413 |
Case 1 (case c1 in Gribble et al10)
The patient was referred at the age of 2.5 years because of delayed speech development. He became withdrawn and unresponsive at the age of 4 years and, shortly thereafter, he showed severe autistic behaviour that persisted to the age of 13 years. Array analysis showed a simple balanced translocation between 22q12.1 and 17q21.1.
Case 2 (case c2 in Gribble et al10)
The patient sought genetic advice at the age of 29 years because of bilateral syndactyly of the hands and feet, bilateral Rieger anomaly of the anterior chamber of the eyes with secondary glaucoma, a congenital skin defect of the neck, folds of redundant skin over the trunk, polycystic ovaries and hirsutism. Array analysis showed a balanced reciprocal translocation between 2q37.1 and 7q36.3.
Case 3 (case b1 in Gribble et al10)
The patient was referred at the age of 8 months for mild developmental delay, a slightly beaked nose and adducted thumbs, and by 2 years of age had developed a dysmorphic appearance, was unable to walk unaided and did not utter intelligible words. Array analysis showed a balanced translocation between 2q37.3 and 7p15.1, but with an additional unsuspected duplication of 1.1–2.9 Mb in size at 3p26.2–26.3.
Case 4 (case 2 in Baptista et al20)
The subject was a clinically normal person carrying an apparently balanced reciprocal translocation. Detailed FISH analysis confirmed the straightforward nature of the balanced translocation between 11p13 and 17p13.1.
Flow‐sorted chromosomes
Derivative chromosomes were flow sorted as described previously18 and amplified using RepliG (Qiagen) following the manufacturer's instructions.
Breakpoint spanning oligonucleotide arrays
Breakpoint spanning oligonucleotide arrays were designed essentially as described previously21 for cases 2–4. Table 1 details the selected chromosomal regions tiled in the arrays. Briefly, the regions of interest were repeat masked, and oligonucleotides were selected from the forward strand at an interval spacing of 1 bp where possible. The oligonucleotides used were of variable lengths (between 45 and 72 bp) so as to maintain isothermal hybridisation characteristics, and only those probes that were unique in the genome were used for calculations. The array design for case 1 contained both 50‐mer fixed‐length probes and isothermal probes that ranged in length from 45 to 77 bp. Probes were generated from both strands, and replicated on the array three times. The data plotted for fig 2 are the average ratios for all replicates at a given position, including both strands. The arrays were constructed by maskless array synthesis technology (NimbleGen Systems, Reykjavik, Iceland), with up to 385 000 oligonucleotides being synthesised by photolithography using previously described methods.22,23 Sample labelling and hybridisation were carried out as described.21 Arrays were scanned at 5‐μm resolution using a GenePix4000B scanner (Axon Instruments, Molecular Devices, Sunnyvale, California, USA). Data were extracted from scanned images using NimbleScan V.2.0 extraction software (NimbleGen Systems). The raw data have been deposited in the National Center for Biotechnology Information's Gene Expression Omnibus (GEO, http://www.ncbi.nlm.nih.gov/geo/), and are accessible through the GEO Series accession number GSE4297.
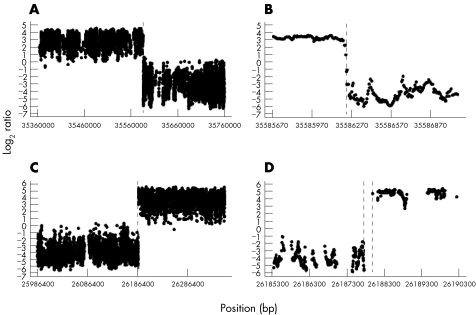
Figure 2 Ultra‐high resolution array painting of case 1. Log2 ratio plots for the chromosome 17 breakpoint (A, B) and the chromosome 22 breakpoint (C, D).
Amplification of junction fragments
Template DNA was prepared from lymphoblastoid cell lines established from the patients as described previously.24 Long‐range PCR was used to amplify junction fragments of unknown size. Template genomic DNA of 100–500 ng was amplified using 2.5 units of HotStarTaq (Qiagen, West Sussex, UK), 200 μM each of dTTP, dGTP, dCTP, dATP, and PCR buffer supplied with enzyme (contains TRIS‐Cl, potassium chloride, ammonium sulphate, 15 mM magnesium chloride; pH 8.7), Q solution supplied with enzyme, 0.1 units ProofStart enzyme (Qiagen), and forward and reverse primers (table 2) at a concentration of 800 nM (20 pmol/reaction). Primers were designed using Primer3.25 Cycling conditions were 1 cycle at 95°C for 15 min; 40 cycles of 95°C for 20 s, 57°C for 1 min, 68°C for 10 min; and 1 cycle at 68°C for 10 min.
Table 2 Polymerase chain reaction primers used to amplify junction fragmentsE.
| Case | Derivative (der) | Primer | Product size (bp) |
|---|---|---|---|
| 1 | der 17 (1) | ACCTCTAATACAGCTTCTTAGCCAAAAT | 1900 |
| der 17 (2) | AAGAAGGTTAGATACTTCTGTAGAGCACTG | ||
| der 22 (1) | AGTAATTATTCTTCATTATGGCCTCCTC | 1100 | |
| der 22 (2) | TACTCACAGAAATATGTGGAGTTTATCTTC | ||
| 2 | der 2 (1) | AGATTAATTCTCCAGTATTTCACATTCTC | 5000 |
| der 2 (2) | CTCATCCTATCACTGATGAAAGTAACAGT | ||
| der 7 (1) | GTTGAAGACTTACTATCGTTTCAGATATTC | 1500 | |
| der 7 (2) | GAAATCATTAAACTCTTTTTATTTGTCTCA | ||
| 3 | der 2 (1) | ATATACACCATAACAGAAATGACACAGAAG | 1800 |
| der 2 (2) | CTGGGAAATGTAAGTTACTTCAGAGAGAG | ||
| der 7 (1) | TATGAATCCTTTATTACTTGGCTATTCTGT | 900 | |
| der 7 (2) | TAGAAACTGTGCAACTAAAAAGTTTGATAA | ||
| 4 | der 11 (1) | AGAAGAAAGATGAGAAGTACAAGTACCAAG | 1500 |
| der 11 (2) | TTATTATCAGAAGATTGGGTCATAATATCC | ||
| der 17 (1) | ATGTGTTCTCATTGTTCAACTCCTACTTAT | 750 | |
| der 17 (2) | GGCTGCATGAGTGGAAGAAG |
Sequencing
Amplified junction fragment DNA was prepared for sequencing using the ExoSAP method (Amersham Biosciences, Buckinghamshire, UK). Cleaned fragments were sequenced from both ends using the di‐deoxy chain‐terminator method,26 with V.3.1 Bigdye terminator chemistry.27 The resulting sequencing reactions were analysed on 3700 ABI sequencing machines (Applied Biosystems, Foster City, California, USA).
Sequence alignment and analysis
All sequence analyses were performed using Build 35 of the human genome. The Smith–Waterman28 algorithm was used to perform local alignments between the breakpoint sequences. Each breakpoint sequence was aligned against the direct, reverse, complement and reverse complement sequence of its translocation partner. In addition, a pairwise comparison between the two breakpoint sequences (5 kb of sequence at either side of the breakpoint) was performed by “BLAST 2 Sequences”.29 The default parameters, but an expectation value of 0.01 and no low‐complexity filter, were used.
Results
We applied ultra‐high resolution array painting to map the breakpoints in four cases of reciprocal translocation. In array painting, the flow sorting of the derivative chromosomes results in the DNA on either side of the breakpoints being differentially labelled. Thus, on the array, a transition from high to low ratios (or vice versa) defines the breakpoint (shown in fig 1A for the translocation in case 1). Our application of array painting to ultra‐high resolution arrays allowed us to refine the mapping of each of the breakpoints to within intervals, which ranged from 55 to 7223 bp in the four cases studied and enabled the direct amplification and sequencing of junction fragments for all breakpoints.
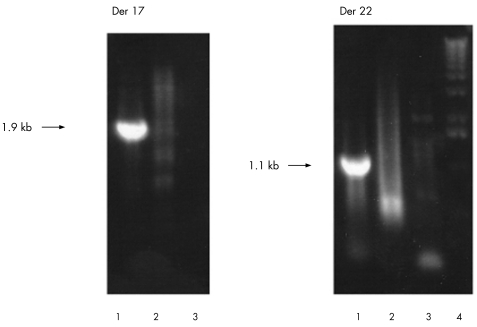
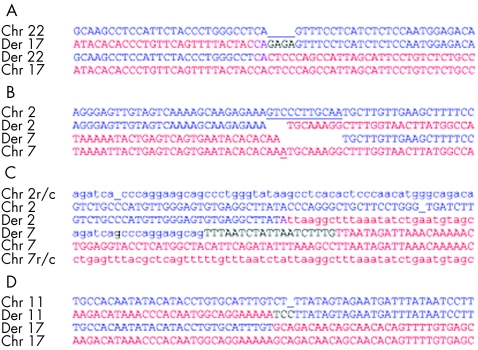
For example, the array results for case 1, a translocation between chromosomes 17 and 22, are shown in fig 2. A clear transition from high (derivative 17) to low ratios (derivative 22) are seen for chromosome 17 oligonucleotides. Several probes show an intermediate reduction in value as the breakpoint is crossed. The median probes in this region are at 35586230–35586280 and 35586235–35586285, and hence we estimate the breakpoint to lie between base pairs 35586230 and 35586285 on chromosome 17, a region of 55 bp. Similarly, a clear transition from low (derivative 22) to high ratios (derivative 17) are seen for chromosome 22 oligonucleotides. The lack of probes with intermediate values is most probably due to the breakpoint lying in the region between probes 26187761–26187811 and 26187988–26188038, where probes could not be designed. Thus, we estimate that the breakpoint lies between base pairs 26187761 and 26188038, a region of 277 bp. Using these estimates for the breakpoints, paired forward and reverse primers on either side of each breakpoint (table 1) were designed, which generated products of 1900 bp for the chromosome 17 breakpoint and 1100 bp for the chromosome 22 breakpoint (fig 3). The sequence spanning the junctions was aligned using BLAST,30 with the reference sequence for chromosomes 17 and 22 to identify the breakpoint junctions (summarised in fig 4A). The breakpoint occurred in a region containing two shared bases (CA) in the reference sequences at positions 35586264–35586265 bp on chromosome 17 and 26187922–26187923 bp on chromosome 22. These two bases were present in the junction fragments of both derivative chromosomes and hence the breakpoint could have occurred either before, within or after these bases. An insertion of four bases (GAGA) was found at the derivative 17 breakpoint.
Figure 3 Long‐range polymerase chain reaction products generated across the breakpoints of case 1. (1) Genomic DNA from case 1; (2) genomic DNA from a normal person; (3) negative control; and (4) size marker. Der, derivative.
Figure 4 Breakpoint junction fragment sequences. (A) case 1; (B) case 2; (C) case 3—r/c reverse complement; and (D) case 4. The reference sequences are labelled in red and blue text. Underlined bases indicate deletions. Black letters indicate bases inserted at the breakpoint or elsewhere in the derivative sequence. Where the precise breakpoint cannot be determined from the reference sequences because of shared bases, these are indicated in purple. Chr, chromosome; Der, derivative.
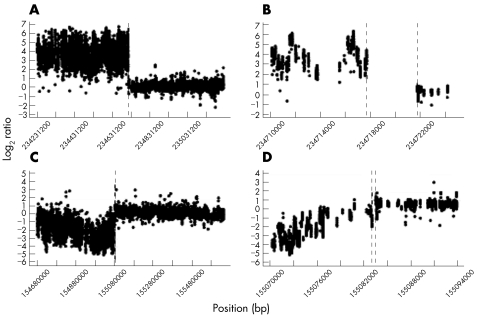
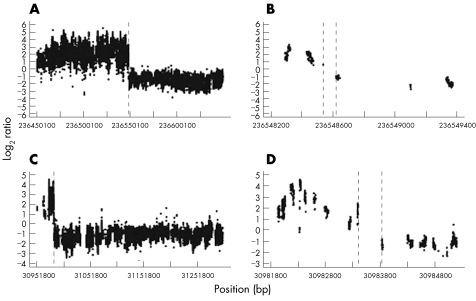
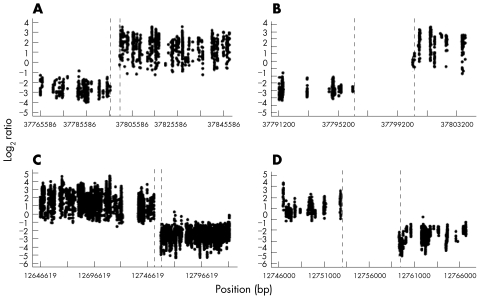
Ultra‐high resolution array‐painting profiles for cases 2, 3 and 4 are shown in figs 5, 6 and 7, respectively. In all cases, the resolution of breakpoint mapping by array painting was sufficient to enable the designing of primers for the direct amplification and sequencing of the junction fragments. Table 1 shows the mapping results for cases 2, 3 and 4, table 2, the designed primers, and fig 4B–D summarises the sequencing results which are available in detail in supplemental information available at http://jmg.bmjjournals.com/supplemental.
Figure 5 Ultra‐high resolution array painting of case 2. Log2 ratio plots for the chromosome 2 breakpoint (A, B) and the chromosome 7 breakpoint (C, D).
Figure 6 Ultra‐high resolution array painting of case 3. Log2 ratio plots for the chromosome 2 breakpoint (A, B) and the chromosome 7 breakpoint (C, D).
Figure 7 Ultra‐high resolution array painting of case 4. Log2 ratio plots for the chromosome 11 breakpoint (A, B) and the chromosome 17 breakpoint (C, D).
The ultra‐high resolution array painting results for case 2 showed a different pattern compared with the other cases. For this translocation, the derivative chromosomes could not be separated from their normal homologues, as the rearrangement involved the reciprocal transfer of only a small amount of material so that the derivatives are not appreciably different in size from their normal counterparts. The derivative chromosome 2 sort thus contains equal amounts of the normal chromosome 2 and the derivative chromosome 2 harbouring the translocated chromosome 7 segment (fig 1B). Similarly, the derivative chromosome 7 sort contains equal amounts of the normal chromosome 7 and the derivative chromosome 7 harbouring the translocated chromosome 2 segment. Thus, for chromosome 7 material, the derivative 2 sort contains only the small region of 7q36.3–7qter, whereas the derivative 7 sort contains two copies of 7pter‐7q36.3, but only one copy of 7q36.3–7qter. Analysing the chromosome 7 probes on the array, we expect the signal for probes proximal to the breakpoint to be derived from the two copies of chromosome 7 from the derivative 7 sort, but distal to the breakpoint the signal will be equally derived from the single copy of this region in both sorted fractions (one from derivative 2 in the derivative 2 sort and the other from the normal chromosome 7 homologue in the derivative 7 sort). Thus, for chromosome 7 we expect ratios to be low proximal to the breakpoint but at a 1:1 ratio distal to the breakpoint. Similarly, for chromosome 2 we expect ratios to be high proximal to the breakpoint, but again become approximately 1:1 distal to the breakpoint. From the ultra‐high resolution array‐painting results (fig 5), we estimate the chromosome 2 breakpoint to lie between base pairs 234717690 and 234721779, an interval of 4089 bp. The chromosome 7 breakpoint was less clear as the transition at the breakpoint was gradual. Conservatively, we estimated the breakpoint to be between 155080332 and 155083499 (3167 bp), which could possibly be refined to between 155082971 and 155083499 (528 bp). Sequencing of the PCR‐amplified junction fragments for this case confirmed the breakpoints to be at 234721701–234721710 bp on chromosome 2 and 155083383–155083386 bp on chromosome 7.
Interspersed repetitive elements around the breakpoints were identified by extracting the RepeatMasker output for the corresponding genomic region using the UCSC Table Browser data retrieval tool.31 In case 1, the chromosome 17 breakpoint was not spanned by a repeat, whereas the chromosome 22 breakpoint was spanned by a short interspersed element (SINE) of the MIR family. In case 2, a long interspersed element (LINE) of the L2 family was detected 2 bp upstream of the chromosome 2 breakpoint, whereas the chromosome 7 breakpoint was spanned by a LINE of the L1 family. The breakpoints of the translocation in case 3 were not spanned by repeats; however, the chromosome 7 breakpoint resided 3 bp upstream of an L2 repeat and 7 bp downstream of a LINE of the CR1 family. Finally, both breakpoints of the translocation in case 4 were spanned by L1 repeats.
Discussion
In this study, we have shown that the combination of array painting with ultra‐high resolution DNA microarrays allows mapping of chromosome translocation breakpoints at a resolution sufficient for the direct amplification and sequencing of junction fragments. We were able to map the translocation breakpoints to within intervals that ranged from 55 to 7223 bp.
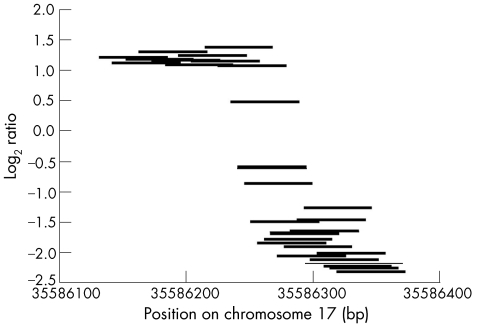
The maskless array synthesis technology used in this study is particularly flexible and hence is well suited for the construction of custom arrays to targeted regions of the genome.22,23 As the arrays can comprise up to 385 000 oligonucleotides, it is well within the capacity of the array design to tile probes across breakpoint intervals identified from spanning large insert clones (ie, approximately 170 kb for bacteria artificial clones) with overlapping probes and a spacing of as low as 1 bp. However, as unique probes are required for accurate reporting of the sequence copy number, the practical probe density becomes reduced in repeat‐rich regions. The effect of this sequence limitation can be seen in the high‐resolution array profiles (figs 2, 5–7), where data points occur in clusters. If a breakpoint falls within a region between clusters of probes, the mapping resolution becomes reduced to this interval. Such probe‐free intervals can be quite large; in case 4, the derivative 17 breakpoint was mapped to within an interval of 7223 bp. However, long‐range PCR is capable of amplifying products at least as long as 10 kb and, hence, even in this worst case we were able to generate junction fragments using the mapping information from the ultra‐high resolution array painting. For cases where the breakpoint is covered by multiple probes (eg, case 1, chromosome 17 breakpoint), extremely accurate estimates of the breakpoint can be made. For this chromosome 17 breakpoint, four probes showed intermediate ratios decreasing in value as the breakpoint is crossed (fig 8). Interpolating the midpoint of these clones gives an estimate for the breakpoint of 35586260, which is only 4–5 bp from the sequenced breakpoint of 35586264–35586265 bp on chromosome 17.
Figure 8 Ultra‐high resolution array painting of case 1. Log2 ratio plots for individual probes around and spanning the chromosome 17 breakpoint.
The efficient generation of breakpoint sequences will enable not only the identification of disrupted genes at breakpoints that are potentially linked to the phenotype but also a study of molecular mechanisms involved in the generation of the rearrangement. In the cases studied here, two of the eight translocation breakpoints directly disrupt a gene. In case 3, the chromosome 2 breakpoint disrupts Centaurin γ 2, a gene affecting the endocytic compartment and actin cytoskeleton dynamics.32 In case 4, a balanced translocation in a clinically normal patient, the chromosome 17 breakpoint falls within a predicted gene with no known function (ENSG00000006740).
However, for the remaining cases where a gene does not appear to be disrupted, the breakpoint sequence facilitates identification of genes that might be affected by direct disruption of, or separation from, cis‐regulatory elements. In case 1, the chromosome 17 breakpoint interrupted a region highly conserved among the sequenced mammalian genomes. The breakpoint localises about 2 kb upstream of the Rap guanine nucleotide exchange factor‐like 1 gene. Rap guanine nucleotide exchange factor‐like 1 (RAPGEFL1) is involved in signal transduction mediated by G‐protein‐coupled receptors, and in neurite formation and growth, as determined by gene ontology annotations. The chromosome 22 breakpoint disrupts a region mostly conserved in humans and mice. The nearest gene localises about 280 kb downstream and is a putative tumour suppressor, meningioma 1.33 Another gene within 500 kb from the chromosome 22 breakpoint is phosphatidylinositol transfer protein, β, which encodes a cytoplasmic protein that catalyses the transfer of phosphatidylinositol and phosphatidylcholine between membranes.34
The breakpoint on 2q37.1 of case 2 is situated at about 11 kb distal to the transient receptor potential cation channel, subfamily M, member 8 gene and about 20 kb proximal to the secreted phosphoprotein 24 precursor (SPP2) gene. Transient receptor potential cation channel, subfamily M, member 8 (TRPM8) is a transmembrane protein acting as an androgen‐dependent Ca2+‐permeable channel that is up regulated in prostate cancer.35 In polycystic ovary syndrome, there is markedly increased production of androgens by ovarian theca cells. Therefore, affected expression of TRPM8 could contribute to the development of polycystic ovaries and hirsutism in case 2. The 7q36.3 breakpoint mapped about 11.5 kb proximal to the Sonic hedgehog (SHH) gene. SHH has been implicated as the key inductive signal in the anteroposterior patterning in the limbs.36 Preaxial polydactyly in humans is caused by a mutation in a cis‐acting regulator of SHH within the limb region 1 homologue (LMBR1) gene that resides about 1 Mb away.37 In a family with partial or complete soft‐tissue syndactyly of the hands and feet, the underlying locus was mapped to 7q36.38 Taken together, these data suggest that the 7q36.3 breakpoint might have had a role in the development of bilateral syndactyly of the hands and feet in the patient.
As regards to the mechanism that might be involved in the generation of these rearrangments, an initial analysis of the four rearrangements described in this study failed to find considerable shared homology at any of the breakpoints. Although LINEs were detected at or near five of eight breakpoints, this occurrence could be entirely random because of the high frequency of LINEs in the human genome; approximately 21% of the human genome is composed of LINEs (National Center for Biotechnology Information Build 36.1). A larger set of translocation breakpoints is required to determine whether the occurrence of repetitive elements near translocation breakpoints is relevant. Overall, we suggest that each of these rearrangements occurred through non‐homologous end joining.
Our method uses flow sorting to separate the derivative chromosomes from the rest of the genome. Chromosome sorting is not widely available, and many groups use microdissection as an alternative for collecting specific chromosomes. Array painting using large insert clone arrays has been shown using microdissected chromosomes and,39,40 hence, it should be possible to apply material collected in this way to ultra‐high resolution arrays. Our demonstration of breakpoint mapping of balanced rearrangements using ultra‐high resolution arrays complements other recent studies using this technology to analyse unbalanced rearrangements.41,42,43
Conclusion
The array painting of translocation breakpoints using custom ultra‐high resolution oligonucleotide arrays allows the direct design of PCR primers for amplification of junction fragments and subsequent sequencing across the breakpoints in balanced translocations. The whole process involving chromosome sorting, array painting, primer design, junction amplification and, finally, breakpoint sequencing can be achieved in a much shorter time and with less effort than the strategies previously used. In particular, the whole mapping process can be reduced to just two array hybridisations: a genomewide array to identify the breakpoint regions at relatively low resolution and any unexpected complexity in the derivative chromosomes, followed by a custom second array, which is designed for ultra‐high resolution analysis of the breakpoint regions. This improved technology for the sequencing of translocation breakpoints should lead to a better understanding of the mechanisms involved in these rearrangements and how they might cause phenotypic effects.
Acknowledgements
We thank John Crolla, Pat Jacobs and Peggy Eis for critical reading of the manuscript. This work was supported by the Wellcome Trust.
Abbreviations
CGH - comparative genomic hybridisation
FISH - fluorescence in situ hybridisation
LINE - long interspersed element
PCR - polymerase chain reaction
SINE - short interspersed element
Footnotes
Competing interests: None declared.
References
- 1.Warburton D. De novo balanced chromosome rearrangements and extra marker chromosomes identified at prenatal diagnosis: clinical significance and distribution of breakpoints. Am J Hum Genet 199149995–1013. [PMC free article] [PubMed] [Google Scholar]
- 2.Bodrug S E, Ray P N, Gonzalez I L.et al Molecular analysis of a constitutional X‐autosome translocation in a female with muscular dystrophy. Science 19872371620–1624. [DOI] [PubMed] [Google Scholar]
- 3.Budarf M L, Collins J, Gong W.et al Cloning a balanced translocation associated with DiGeorge syndrome and identification of a disrupted candidate gene. Nat Genet 199510269–278. [DOI] [PubMed] [Google Scholar]
- 4.McMullan T W, Crolla J A, Gregory S G.et al A candidate gene for congenital bilateral isolated ptosis identified by molecular analysis of a de novo balanced translocation. Hum Genet 2002110244–250. [DOI] [PubMed] [Google Scholar]
- 5.Millar J K, Wilson‐Annan J C, Anderson S.et al Disruption of two novel genes by a translocation co‐segregating with schizophrenia. Hum Mol Genet 200091415–1423. [DOI] [PubMed] [Google Scholar]
- 6.Krebs I, Weis I, Hudler M.et al Translocation breakpoint maps 5 kb 3′ from TWIST in a patient affected with Saethre‐Chotzen syndrome. Hum Mol Genet 199761079–1086. [DOI] [PubMed] [Google Scholar]
- 7.Spitz F, Montavon T, Monso‐Hinard C.et al A t(2;8) balanced translocation with breakpoints near the human HOXD complex causes mesomelic dysplasia and vertebral defects. Genomics 200279493–498. [DOI] [PubMed] [Google Scholar]
- 8.Velagaleti G V, Bien‐Willner G A, Northup J K.et al Position effects due to chromosome breakpoints that map approximately 900 kb upstream and approximately 1.3 Mb downstream of SOX9 in two patients with campomelic dysplasia. Am J Hum Genet 200576652–662. [DOI] [PMC free article] [PubMed] [Google Scholar]
- 9.Ciccone R, Giorda R, Gregato G.et al Reciprocal translocations: a trap for cytogenetists? Hum Genet 2005117571–582. [DOI] [PubMed] [Google Scholar]
- 10.Gribble S M, Prigmore E, Burford D C.et al The complex nature of constitutional de novo apparently balanced translocations in patients presenting with abnormal phenotypes. J Med Genet 2005428–16. [DOI] [PMC free article] [PubMed] [Google Scholar]
- 11.Kurahashi H, Shaikh T H, Hu P.et al Regions of genomic instability on 22q11 and 11q23 as the etiology for the recurrent constitutional t(11;22). Hum Mol Genet 200091665–1670. [DOI] [PubMed] [Google Scholar]
- 12.van Bakel I, Holt S, Craig I.et al Sequence analysis of the breakpoint regions of an X; 5 translocation in a female with Duchenne muscular dystrophy. Am J Hum Genet 199557329–336. [PMC free article] [PubMed] [Google Scholar]
- 13.Bonaglia M C, Giorda R, Borgatti R.et al Disruption of the ProSAP2 gene in a t(12;22)(q24.1;q13.3) is associated with the 22q13.3 deletion syndrome. Am J Hum Genet 200169261–268. [DOI] [PMC free article] [PubMed] [Google Scholar]
- 14.Vervoort V S, Viljoen D, Smart R.et al Sorting nexin 3 (SNX3) is disrupted in a patient with a translocation t(6;13)(q21;q12) and microcephaly, microphthalmia, ectrodactyly, prognathism (MMEP) phenotype. J Med Genet 200239893–899. [DOI] [PMC free article] [PubMed] [Google Scholar]
- 15.Mills K I, Sproul A M, Ogilvie D.et al Amplification and sequencing of genomic breakpoints located within the M‐bcr region by Vectorette‐mediated polymerase chain reaction. Leukemia 19926481–483. [PubMed] [Google Scholar]
- 16.Willett‐Brozick J E, Savul S A, Richey L E.et al Germ line insertion of mtDNA at the breakpoint junction of a reciprocal constitutional translocation. Hum Genet 2001109216–223. [DOI] [PubMed] [Google Scholar]
- 17.Pinkel D, Segraves R, Sudar D.et al High resolution analysis of DNA copy number variation using comparative genomic hybridization to microarrays. Nat Genet 199820207–211. [DOI] [PubMed] [Google Scholar]
- 18.Fiegler H, Gribble S M, Burford D C.et al Array painting: a method for the rapid analysis of aberrant chromosomes using DNA microarrays. J Med Genet 200340664–670. [DOI] [PMC free article] [PubMed] [Google Scholar]
- 19.Veltman I M, Veltman J A, Arkesteijn G.et al Chromosomal breakpoint mapping by arrayCGH using flow‐sorted chromosomes. Biotechniques 2003351066–1070. [DOI] [PubMed] [Google Scholar]
- 20.Baptista J, Prigmore E, Gribble S M.et al Molecular cytogenetic analyses of breakpoints in apparently balanced reciprocal translocations carried by phenotypically normal individuals. Eur J Hum Genet 2005131205–1212. [DOI] [PubMed] [Google Scholar]
- 21.Selzer R R, Richmond T A, Pofahl N J.et al Analysis of chromosome breakpoints in neuroblastoma at sub‐kilobase resolution using fine‐tiling oligonucleotide array CGH. Genes Chromosomes Cancer 200544305–319. [DOI] [PubMed] [Google Scholar]
- 22.Nuwaysir E F, Huang W, Albert T J.et al Gene expression analysis using oligonucleotide arrays produced by maskless photolithography. Genome Res 2002121749–1755. [DOI] [PMC free article] [PubMed] [Google Scholar]
- 23.Singh‐Gasson S, Green R D, Yue Y.et al Maskless fabrication of light‐directed oligonucleotide microarrays using a digital micromirror array. Nat Biotechnol 199917974–978. [DOI] [PubMed] [Google Scholar]
- 24.Fiegler H, Carr P, Douglas E J.et al DNA microarrays for comparative genomic hybridization based on DOP‐PCR amplification of BAC and PAC clones. Genes Chromosomes Cancer 200336361–374. [DOI] [PubMed] [Google Scholar]
- 25.Rozen S, Skaletsky H J. Primer3 on the WWW for general users and for biologist programmers. In: Krawetz S, Misener S, eds. Bioinformatics methods and protocols: methods in molecular biology. Totowa, NJ: Humana Press, 2000365–386. [DOI] [PubMed]
- 26.Sanger F, Nicklen S, Coulson A R. DNA sequencing with chain‐terminating inhibitors. Proc Natl Acad Sci USA 1977745463–5467. [DOI] [PMC free article] [PubMed] [Google Scholar]
- 27.West A P, Clee C M, Rogers J. The Sanger Institute high‐throughput sequencing pipeline. In: Kieleczawa J, ed Automation in the sequencing lab. Sudbury, MA: Jones and Bartlett, 2005
- 28.Smith T F, Waterman M S. Identification of common molecular subsequences. J Mol Biol 1981147195–197. [DOI] [PubMed] [Google Scholar]
- 29.Tatusova T A, Madden T L. BLAST 2 Sequences, a new tool for comparing protein and nucleotide sequences. FEMS Microbiol Lett 1999174247–250. [DOI] [PubMed] [Google Scholar]
- 30.Kent W J. BLAT—the BLAST‐like alignment tool. Genome Res 200212656–664. [DOI] [PMC free article] [PubMed] [Google Scholar]
- 31.Karolchik D, Hinrichs A S, Furey T S.et al The UCSC Table Browser data retrieval tool. Nucleic Acids Res 200432D493–D496. [DOI] [PMC free article] [PubMed] [Google Scholar]
- 32.Nie Z, Stanley K T, Stauffer S.et al AGAP1, an endosome‐associated, phosphoinositide‐dependent ADP‐ribosylation factor GTPase‐activating protein that affects actin cytoskeleton. J Biol Chem 200227748965–48975. [DOI] [PubMed] [Google Scholar]
- 33.Lekanne Deprez R H, Riegman P H, Groen N A.et al Cloning and characterization of MN1, a gene from chromosome 22q11, which is disrupted by a balanced translocation in a meningioma. Oncogene 1995101521–1528. [PubMed] [Google Scholar]
- 34.Tanaka S, Yamashita S, Hosaka K. Cloning and expression of human cDNA encoding phosphatidylinositol transfer protein beta. Biochim Biophys Acta 19951259199–202. [DOI] [PubMed] [Google Scholar]
- 35.Tsavaler L, Shapero M H, Morkowski S.et al Trp‐p8, a novel prostate‐specific gene, is up‐regulated in prostate cancer and other malignancies and shares high homology with transient receptor potential calcium channel proteins. Cancer Res 2001613760–3769. [PubMed] [Google Scholar]
- 36.Riddle R D, Johnson R L, Laufer E.et al Sonic hedgehog mediates the polarizing activity of the ZPA. Cell 1993751401–1416. [DOI] [PubMed] [Google Scholar]
- 37.Lettice L A, Horikoshi T, Heaney S J.et al Disruption of a long‐range cis‐acting regulator for Shh causes preaxial polydactyly. Proc Natl Acad Sci USA 2002997548–7553. [DOI] [PMC free article] [PubMed] [Google Scholar]
- 38.Dundar M, Gordon T M, Ozyazgan I.et al A novel acropectoral syndrome maps to chromosome 7q36. J Med Genet 200138304–309. [DOI] [PMC free article] [PubMed] [Google Scholar]
- 39.Liehr T, Starke H, Senger G.et al Overrepresentation of small supernumerary marker chromosomes (sSMC) from chromosome 6 origin in cases with multiple sSMC. Am J Med Genet A 200614046–51. [DOI] [PubMed] [Google Scholar]
- 40.Vermeesch J R, Melotte C, Salden I.et al Tetrasomy 12pter‐12p13.31 in a girl with partial Pallister‐Killian syndrome phenotype. Eur J Med Genet 200548319–327. [DOI] [PubMed] [Google Scholar]
- 41.Stallings R L, Nair P, Maris J M.et al High‐resolution analysis of chromosomal breakpoints and genomic instability identifies PTPRD as a candidate tumor suppressor gene in neuroblastoma. Cancer Res 2006663673–3680. [DOI] [PubMed] [Google Scholar]
- 42.Strefford J C, van Delft F W, Robinson H M.et al Complex genomic alterations and gene expression in acute lymphoblastic leukemia with intrachromosomal amplification of chromosome 21. Proc Natl Acad Sci USA 20061038167–8172. [DOI] [PMC free article] [PubMed] [Google Scholar]
- 43.Urban A E, Korbel J O, Selzer R.et al High‐resolution mapping of DNA copy alterations in human chromosome 22 using high‐density tiling oligonucleotide arrays. Proc Natl Acad Sci USA 20061034534–4539. [DOI] [PMC free article] [PubMed] [Google Scholar]


