

Abstract
Background
Coenzyme Q10 (CoQ10) is a provitamin synthesized via the HMG-CoA reductase pathway, and thus may serve as a potential marker of intrinsic HMG-CoA reductase activity. HMG-CoA reductase inhibitors (statins) decrease CoQ10, although it is unclear whether this is due to reductions in lipoproteins, which transport CoQ10.
Objectives
We evaluated whether baseline plasma CoQ10 concentrations predict the lipid-lowering response to high-dose atorvastatin, and to what extent CoQ10 changes following atorvastatin therapy depend on lipoprotein changes.
Methods
Individuals without dyslipidemia or known cardiovascular disease (n=84) received atorvastatin 80 mg daily for 16 weeks. Blood samples collected at baseline and after 4, 8, and 16 weeks of treatment were assayed for CoQ10.
Results
Individuals with higher baseline CoQ10:LDL-C ratios displayed diminished absolute and percent LDL-C reductions at 8 and 16 weeks of atorvastatin treatment (P<0.001 to 0.01). After 16 weeks of atorvastatin, plasma CoQ10 decreased 45% from 762±301 ng/ml to 374±150 ng/ml (P<0.001). CoQ10 changes were correlated with LDL-C and apolipoprotein B changes (r=0.27-0.38, P=0.001-0.02), but remained significant when normalized to all lipoproteins. CoQ10 changes were not associated with adverse drug reactions.
Conclusion
Baseline CoQ10:LDL-C ratio was associated with the degree of LDL-C response to atorvastatin. Atorvastatin decreased CoQ10 concentrations in a manner that was not completely dependent on lipoprotein changes. The utility of CoQ10 as a predictor of atorvastatin response should be further explored in patients with dyslipidemia.
Keywords: Coenzyme Q10, HMG CoA-reductase inhibitors, lipids, pharmacology, biomarkers
INTRODUCTION
HMG-CoA reductase inhibitors (statins) are commonly used to treat dyslipidemia. Atorvastatin is the most commonly prescribed statin worldwide. We and others have described remarkable interpatient variability in the lipid-lowering response to atorvastatin at both low and high doses,1, 2 an important consideration given that higher doses of statins are indicated in some patient populations.3, 4 Attempts to define predictors of the lipid-lowering response or clinical outcome, such as through use of genetic polymorphisms5 or inflammatory markers,6 have been helpful but not completely informative. Identifying patients that might benefit from a statin through the use of biomarkers could have significant implications for clinical outcomes, public health, and resource utilization.
Much like cholesterol, coenzyme Q10 (CoQ10) is a downstream product of the mevalonate pathway (Figure 1). HMG-CoA reductase, the target of statins, is the rate-limiting enzyme of the mevalonate pathway. The literature is replete with reports that statins reduce circulating CoQ10,7 presumably a consequence of inhibiting HMG-CoA reductase. Since cholesterol and CoQ10 share the same biosynthetic pathway, circulating CoQ10 in untreated patients may reflect intrinsic HMG-CoA reductase activity. Thus, patients with different levels of HMG-CoA reductase activity, as evidenced by different baseline CoQ10 concentrations, may exhibit variable lipid-lowering responses to HMG-CoA reductase inhibitors. The usefulness of baseline plasma CoQ10 concentrations has not been investigated as a predictor of statin efficacy.
Figure 1.
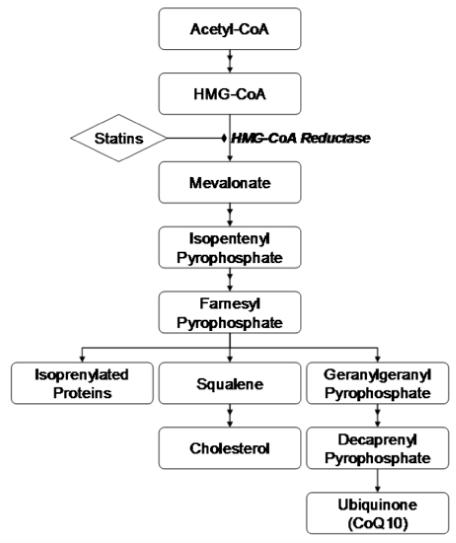
CoQ10 Biosynthetic Pathway.
Beyond the potential for CoQ10 to serve as a marker of effectiveness, several critical issues remain concerning changes in CoQ10 following statin therapy. The effect of high-dose statins on CoQ10 when used for prolonged duration is unknown. A recent survey of the effects of statins on circulating CoQ10 revealed that the only study to test atorvastatin 80 mg, the highest available dose, was 30 days in duration and enrolled 34 individuals, while the longest study (1 year) only investigated atorvastatin 10-20 mg.8, 9 Additionally, many studies have not corrected for reductions in lipoprotein or apolipoprotein concentrations — an important consideration given that a large percentage of circulating CoQ10 is transported by low-density lipoprotein cholesterol (LDL-C) and other apolipoprotein B containing proteins, as well as highdensity lipoprotein cholesterol (HDL-C).7 Failure to account for these changes may explain the inconsistent relationship between plasma CoQ10 levels and muscle side effects in response to statins.
To address these issues surrounding statin efficacy and safety as related to CoQ10, we investigated 1) the relationship between baseline CoQ10 and lipid-lowering responses to high-dose atorvastatin, 2) CoQ10 responses to high-dose atorvastatin, corrected for lipid changes, and 3) the relationship between CoQ10 changes and adverse drug reactions.
METHODS
Participants and Study Protocol
The study population and protocol have been previously described.1 Briefly, individuals were eligible for participation if they did not have any of the following: known coronary disease, symptomatic carotid artery disease, peripheral vascular disease, diabetes, history of aneurysm, dyslipidemia requiring drug therapy, Framingham 10-year risk > 20%, malignancy, pregnancy, liver transaminases > 2 times the upper limit of normal, active alcohol abuse, history of unexplained muscle pain, or previous treatment with prescription lipid-lowering drugs. Women of child bearing potential had to agree to a reliable form of birth control throughout the study, and pregnancy tests were performed at every study visit.
Once eligibility was met, participants underwent a 2-week control phase in which no atorvastatin was administered. Subsequently, participants received atorvastatin 80 mg daily for 16 weeks. Participants were counseled to maintain current levels of diet and activity at every study visit. Participants were seen every 4 weeks during the treatment phase and blood was drawn for biochemical analysis of the early (4-week), intermediate (8-week), and late (16-week) effects of atorvastatin on various biomarkers. Study visits were performed at approximately the same time each visit (∼8:00 am to 10:30 am) to minimize diurnal variation in biomarker concentrations. Furthermore, baseline, 8-week, and 16 week lipoprotein analyses were performed in the fasting state. All visits were performed at the University of Florida General Clinical Research Center (GCRC). All participants provided written informed consent, and the study protocol was approved by the University of Florida institutional review board and GCRC Scientific Advisory Committee.
Measurement of Plasma CoQ10
The concentrations of CoQ10 in plasma were measured by liquid chromatography tandem mass spectrometry (LC/MS/MS) by modification of the method described by Hansen and colleagues.10 Briefly, plasma samples were mixed with internal standard (ubiquinone-9, CoQ9) and a solution of 1,4-benzoquinone, which was used to completely oxidize ubiquinol (CoQ10H2) to ubiquinone (CoQ10). After 15 minutes, 1-propanol (1 mL) was added and the samples were vortex-mixed for 2 minutes and centrifuged (2000 × g) for 10 minutes at 4°C. The supernatant was transferred to autosampler vials and 10 μL was injected into the system. Chromatography was performed on a Thermo Scientific Hypersil Gold C18 column (50 × 2.1 mm, 5 μm) using a mobile phase of isopropanol and methanol (20:80, v/v) delivered isocratically at a flow rate of 0.5 mL/min. The LC/MS/MS system consisted of a Thermo TSQ Quantum mass spectrometer, Surveyor autosampler, and Surveyor MS pump (Thermo, San Jose, CA). The LC/MS/MS was equipped with an atmospheric pressure chemical ionization source operated in the positive ionization mode. The ion transitions selectively monitored were mass-to-charge ratio (m/z) 863.7 to 197 and m/z 795.6 to 197 for CoQ10 and CoQ9, respectively. The lower limit of quantitation was 50 ng/ml. The respective within and between assay variability was 7.8% and 7.5% at 150 ng/ml and 8.7% and 7.5% at 1500 ng/ml.
Statistical Analysis
Data are presented as means and standard deviations unless otherwise stated. Baseline CoQ10 measurements were calculated as the averaged CoQ10 concentration from the beginning and end of the 2-week run-in period to serve as a control on differences within subjects. Repeated measures analysis of variance (RANOVA) was performed to test the effect of atorvastatin on changes in CoQ10, total cholesterol, LDL-C, HDL, triglycerides, apolipoprotein A, and apolipoprotein B concentrations over the course of the study. Changes in the ratio of CoQ10 to each apo-/lipoprotein fraction were also evaluated using RANOVA. Correlation between changes in CoQ10 concentrations and apo-/lipoprotein fractions were evaluated using Spearman’s correlations. Spearman’s correlations and multivariable linear regression were performed to determine whether baseline CoQ10 concentrations and CoQ10:LDL-C ratios (normalized by 10-4 to be unitless) predicted the LDL-C-lowering response (percent and absolute changes) to atorvastatin at 8 weeks and 16 weeks. Percent and absolute changes in LDL-C were assessed as dependent variables, as there is epidemiological support that both surrogate endpoints are important depending on the clinical outcome studied.11, 12 The multivariable model was constructed from the following variables using the stepwise procedure (entered if P<0.1, retained if P<0.05): baseline CoQ10, LDL-C, CoQ10:LDL-C ratio, triglycerides, HDL-C, total cholesterol, apolipoprotein A, apolipoprotein B, age, sex, race, body mass index (BMI), and smoking. Analyses were based on intention to treat and were performed with the last observation carried forward in the presence of missing data. The threshold for significance was P<0.05. All statistical analyses were performed using SAS version 9.1 (SAS Institute, Cary, NC).
RESULTS
Of the 84 enrolled participants, the majority of patients had complete biochemistry data on lipoprotein concentrations and plasma CoQ10 concentrations at all time points of interest. A schematic of reasons for incomplete data is shown in Figure 2. The mean age (±SD) of study participants was 31±13 years, 63% were women, and 71% were white. Baseline lipid profiles and changes in these parameters over 16 weeks are shown in Table 1.
Figure 2. Overview of Data Flow for Study Duration.
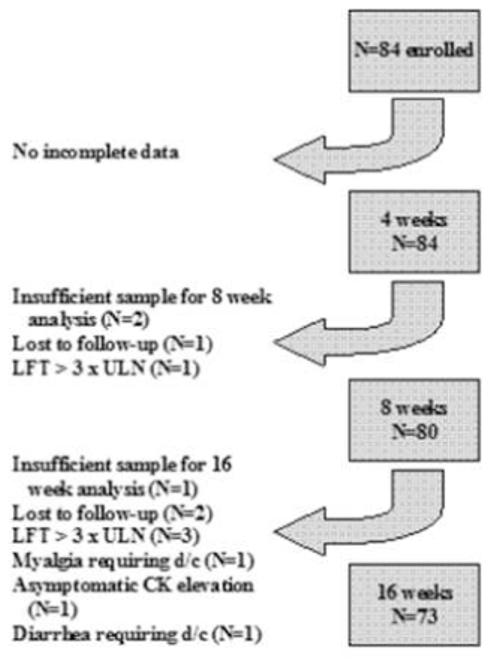
Abbreviations: LFT, liver function test; ULN, upper limit of normal; CK, creatine kinase; d/c, discontinuation
Table 1.
Lipid Profile Changes in Response to Atorvastatin 80 mg
| Baseline | Week 8 | Week 16 | P-value | |
|---|---|---|---|---|
| Total cholesterol, mg/dL | 183±39 | 119±26 | 117±26 | <0.0001 |
| LDL-C, mg/dL | 102±31 | 46±18 | 45±20 | <0.0001 |
| HDL-C, mg/dL | 61±17 | 59±15 | 58±16 | 0.25 |
| Triglycerides, mg/dL | 100±57 | 72±37 | 70±44 | <0.0001 |
| Apolipoprotein A, mg/dL | 149±34 | 147±26 | 143±27 | 0.54 |
| Apolipoprotein B, mg/dL | 83±24 | 49±15 | 47±15 | <0.0001 |
| Data expressed as mean±SD | ||||
Treatment with atorvastatin 80 mg significantly modulated all parameters of the lipid profile except for HDL-C and apolipoprotein A concentrations. Specifically, atorvastatin resulted in the following changes after 8 weeks: total cholesterol -18.6%, LDL-C -54.9%, HDLC -0.3%, triglycerides -18.6%, apolipoprotein A -1.2%, and apolipoprotein B -42.2%. Similar changes were observed after 16 weeks of therapy, which are shown in Table 1.
Absolute and relative changes in individuals’ plasma CoQ10 concentrations over time are shown in Figure 3A-B. Changes in plasma CoQ10 concentrations were seen as early as 4 weeks, and persisted at lower levels than baseline in almost all individuals thereafter. Average plasma CoQ10 concentrations at baseline, and after 4, 8, and 16 weeks of atorvastatin 80 mg daily were 762±301, 414±182, 392±150, and 374±150 ng/mL corresponding to reductions of 44±18%, 46±15%, and 45±20% from baseline (P<0.0001).
Figure 3. Changes in CoQ10 Concentrations After 4, 8, and 16 Weeks of Atorvastatin.
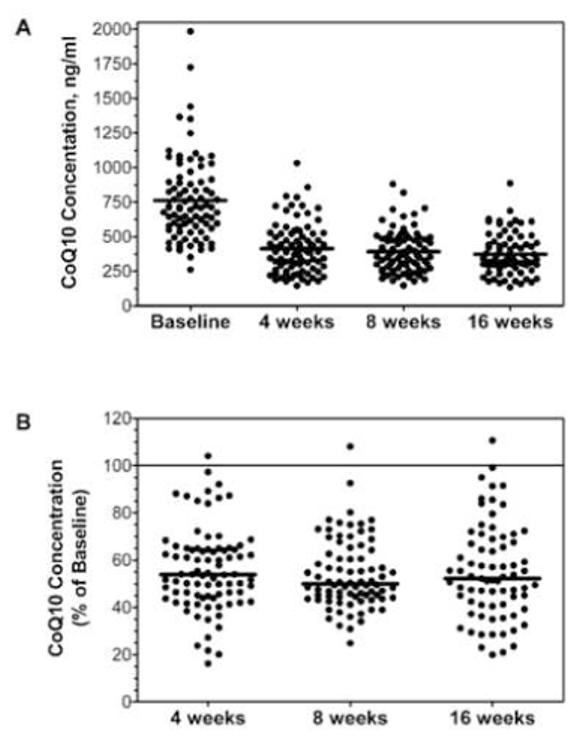
Each dot represents an individual study participant and the lines represent the mean values. Absolute values of CoQ10 concentrations are shown in panel A. The reduction in CoQ10 relative to baseline is shown in panel B.
Baseline CoQ10 and baseline LDL-C were correlated (r=0.31, P=0.004). The percent reductions in LDL-C after 8 weeks and 16 weeks of atorvastatin treatment were significantly correlated with baseline CoQ10:LDL-C ratio (8 week: r=0.42, P<0.0001; 16 week: r=0.29, P=0.01), such that higher baseline CoQ10:LDL-C ratio was associated with diminished response (Figure 4A-B). This relationship was likewise significant for the 8 week absolute change (r=0.56, P<0.001) and 16 week absolute change (r=0.49, P <0.001) in LDL-C (Figure 4C-D).
Figure 4. Percent (panels A and B) and Absolute (panels C and D) Changes in LDL-C After 8, and 16 Weeks of Atorvastatin According to Baseline CoQ10:LDL-C Ratio.
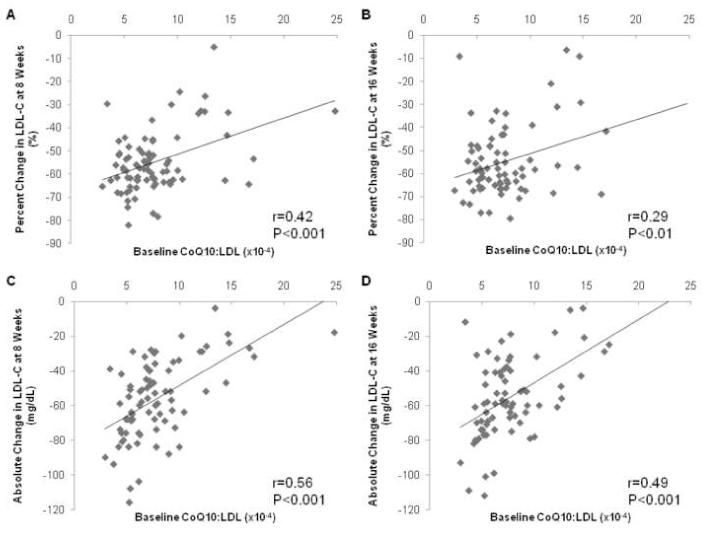
LDL-C values are expressed in mg/dL.
Multivariable linear regression examining baseline CoQ10, LDL-C, CoQ10:LDL-C ratio, and other clinical variables, revealed that baseline CoQ10:LDL-C ratio was the only predictor of percent reduction in LDL-C after 8 weeks and 16 weeks of atorvastatin therapy (Table 2). Multivariable regression for the absolute reduction in LDL-C revealed that baseline LDL-C and CoQ10 were independently associated with the LDL-C response at 8 weeks. Baseline LDL-C and body mass index were predictive of the absolute change at 16 weeks (Table 2).
Table 2.
Baseline Predictors of LDL-C Response After 8 and 16 Weeks of Atorvastatin from Linear Regression Analysis
| Baseline Variable | Parameter Estimate |
Standard Error |
Partial R2 |
P-value | |
|---|---|---|---|---|---|
| Predictors of Percent Change in LDL-C | |||||
| 8 weeks | Baseline CoQ10:LDL-C ratio | 1.56 | 0.39 | 0.17 | 0.0002 |
| 16 weeks | Baseline CoQ10:LDL-C ratio | 1.36 | 0.58 | 0.07 | 0.03 |
| Predictors of Absolute Change in LDL-C | |||||
| 8 weeks | Baseline CoQ10 (ng/mL) | 0.019 | 0.005 | 0.05 | 0.0004 |
| Baseline LDL-C (mg/dL) | -0.637 | 0.05 | 0.65 | <0.0001 | |
| 16 weeks | Body mass index (kg/m2) | 0.756 | 0.34 | 0.03 | 0.03 |
| Baseline LDL-C (mg/dL) | -0.598 | 0.06 | 0.57 | <0.0001 | |
The correlation between absolute and percent changes in CoQ10 concentrations with changes in lipid parameters were examined, revealing no significant correlations between 8-week changes in CoQ10 concentrations and changes in any lipid parameter (data not shown). However, the absolute and percent changes in CoQ10 at 16 weeks were significantly correlated with changes in LDL-C cholesterol and apolipoprotein B at 16 weeks (Figure 5A-D). Specifically, the correlation coefficients between 16-week percent changes in CoQ10 and LDL-C, and CoQ10 and apolipoprotein B, respectively, were 0.27 (P=0.02) and 0.29 (P=0.02). The correlation coefficients between 16-week absolute changes in CoQ10 and LDL-C, and CoQ10 and apolipoprotein B, respectively, were 0.30 (P=0.01) and 0.38 (P=0.001).
Figure 5. Correlation Between Percent and Absolute Change in CoQ10 Concentrations and LDL-C Concentrations (panels A and C) and Apolipoprotein B Concentrations (panels B and D) at 16 weeks.
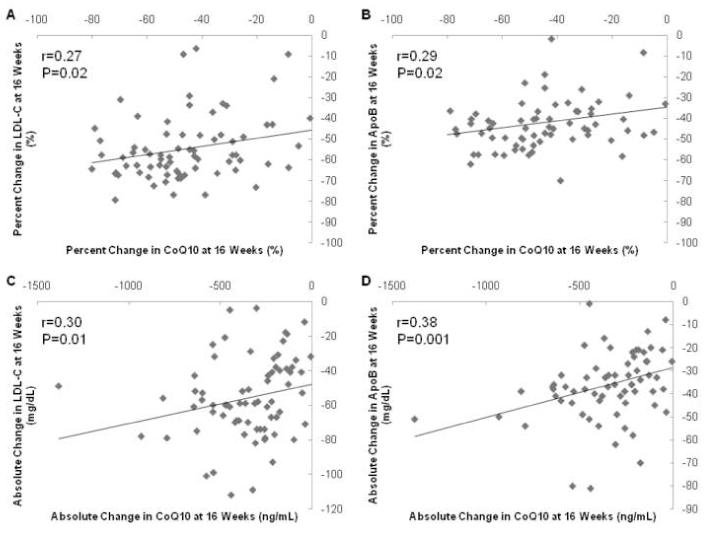
CoQ10 concentrations expressed as ng/mL, apo-/lipoprotein concentrations expressed as mg/dL.
Because CoQ10 is partially transported by lipoproteins, changes in plasma CoQ10 corrected for changes in lipid parameters are shown in Figure 6. Of note, atorvastatin effects on CoQ10 adjusted for lipid parameter changes were all significant. However, the magnitudes and directions of the effects differed depending on the lipid parameter of interest. For example, while the ratio of CoQ10 to total cholesterol, HDL-C, triglycerides, apolipoprotein A, and apolipoprotein B decreased significantly, the ratio of CoQ10 to LDL-C increased significantly. In addition, there was wide variability in the magnitude of CoQ10 change (%) depending on the lipid parameter included (-47 to +30%; Figure 6).
Figure 6. Normalized CoQ10 Changes in Response to Atorvastatin 80 mg.
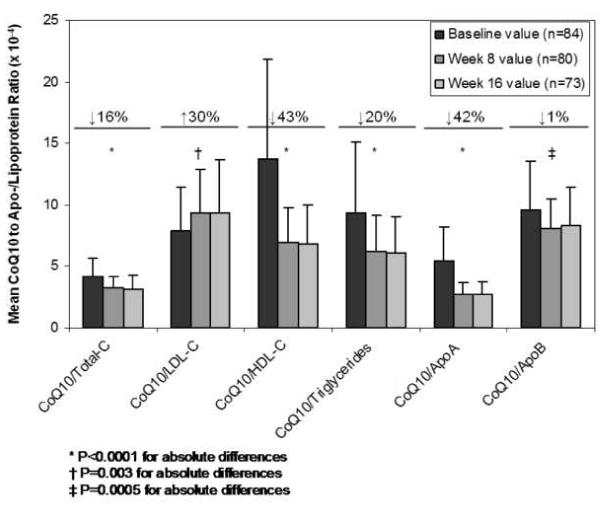
The ratio of CoQ10 to apo-/lipoprotein concentrations are depicted for each time point (baseline, 8 weeks, and 16 weeks). Percentages reflect the mean of individual percent changes in the normalized CoQ10 concentration from baseline to 16 weeks.
Atorvastatin therapy was generally well-tolerated. Liver transaminases increased to greater than 3 times the upper limit of the reference range resulting in study discontinuation in 4 participants. Transaminases returned to baseline within 1 month of discontinuation in all 4 patients. Myalgia requiring discontinuation of treatment occurred in 1 person; there was no concurrent elevation in circulating CK in this participant. CoQ10 was lowered to 729 ng/ml at 4 weeks and 882 ng/ml at 8 weeks, corresponding to 46% and 34% reductions in this individual, which was similar to the rest of the sample. Asymptomatic CK elevation leading to discontinuation by the physician monitor occurred in 1 participant. Moderate diarrhea prompting discontinuation occurred in 1 patient 9 weeks after initiation of atorvastatin.
DISCUSSION
Studies have consistently demonstrated that statin therapy decreases circulating CoQ10 concentrations, signaling a potential relationship between HMG-CoA reductase, CoQ10, and statin therapy.7 The relationship between baseline CoQ10 concentrations and likelihood for therapeutic efficacy in statin-treated patients has not previously been described. Furthermore, the effect of high-dose statin therapy on CoQ10 levels is not well known, and it is unclear if reductions in CoQ10 are meaningful when considering concomitant changes in lipoproteins, given that circulating CoQ10 is transported by LDL-C and other lipoproteins. We investigated these questions in the current study.
No study to date of which we are aware has investigated baseline plasma CoQ10 concentrations as a potential predictor of likelihood of response to statins. We hypothesized that pre-treatment CoQ10 levels may be a surrogate for upstream HMG-CoA reductase activity in vivo. To the extent that statins work to lower LDL-C through inhibition of HMG-CoA reductase, we investigated whether baseline CoQ10 was independently associated with LDL-C response after treatment with atorvastatin 80 mg at either 8 weeks or 16 weeks. Interestingly, it was found that higher pre-treatment CoQ10:LDL-C ratios were associated with a diminished LDL-C lowering effect of atorvastatin. This relationship suggests that higher CoQ10 levels at baseline relative to LDL-C may signal a mevalonate pathway that is preferentially shunted toward prenylation protein biosynthesis (e.g., geranylgeranyl pyrophosphate pathway predominance) rather than cholesterol biosynthesis (Figure 1), resulting in attenuated inhibition of hepatic cholesterol production. This finding could provide mechanistic insight into the variability around statin responses. The clinical relevance of statin response variability is tremendous considering that even in large, well-conducted clinical studies in which adequate LDL-C levels are achieved; the relative risk reduction in clinical endpoints is similar to placebo in approximately 70% of statin-treated patients.13
We also demonstrated that atorvastatin 80 mg daily lowered average plasma CoQ10 concentrations by approximately 45% over the course of 16 weeks. To our knowledge, only one other study has investigated the effect of maximally dosed atorvastatin on circulating CoQ10 and demonstrated a comparable reduction at 30 days (52% reduction).8 Interestingly, the longer duration of our study also demonstrated that the effect of high-dose atorvastatin on CoQ10 was evident as early as 1 month after treatment (44% lower) and remained at a consistently lower level at 8 weeks (46% lower) and 16 weeks (45% lower) relative to baseline. While the relationship between CoQ10 changes and statin myopathy has been equivocal, it is important to note that the majority of studies to explore this relationship have been of short duration. Our data demonstrate that no attenuation in the early effects of atorvastatin on CoQ10 concentrations occurs over time; the long-term impact of these changes on muscle physiology is unknown.
In this investigation, we also observed a significant correlation between 16-week absolute and percent changes in CoQ10 and LDL-C and apolipoprotein B. The 16-week correlations between CoQ10 and percent changes in these lipid parameters were of similar magnitude (r=0.27 to 0.29). Correlations with absolute changes were slightly stronger (r=0.30 to 0.38). These findings are consistent with previous observations that LDL-C (the major apolipoprotein B-containing lipoprotein) is a major carrier of circulating CoQ10.14 Of particular interest, there were no significant correlations between CoQ10 changes and any lipid parameter at 8 weeks of treatment, suggesting an early disconnect between the CoQ10- and lipid-modifying effects of atorvastatin that converges over time. This divergence may have some relevance to the early “pleiotropic” effects of statins and should be further investigated.
Finally, it has been proposed that decreases in CoQ10 are merely a consequence of reduced lipoprotein concentrations because CoQ10 is shuttled by various lipoproteins. Thus, we explored the effect of high-dose atorvastatin on CoQ10 concentrations “corrected” for lipoprotein and apolipoprotein concentrations. Of interest, atorvastatin still significantly modulated CoQ10 concentrations when corrected for lipid changes. However, both the magnitude and directions of these effects were highly variable depending on the lipid parameter tested. Corrected CoQ10 changes ranged from a nearly 50% decrease to a 30% increase. Of particular relevance, the CoQ10:LDL-C ratio was significantly raised after statin therapy, perhaps highlighting a more significant LDL-C-lowering effect of atorvastatin vis-à-vis effects on CoQ10.
Several studies suggested that CoQ10 changes following statin therapy are negligible when normalized to circulating lipoproteins, particularly LDL-C and total cholesterol, implying that CoQ10 changes are dependent on lipoprotein changes.15-23 However, 2 studies described increases in the CoQ10:LDL-C ratio, similar to the changes we observed, although CoQ10 did not decrease in 1 of these studies.24-27 We also observed a lower level of correlation between CoQ10 and lipoprotein changes than other studies, perhaps as a result of the higher dose used in this study.16, 25 Our findings have particular relevance given that even recent studies of the effect of statins on plasma CoQ10 do not adjust for changes in other lipid parameters,28 and the ability of these “corrected” CoQ concentrations to predict statin myopathy is unknown. We were not able to assess the relationship between lipid-corrected CoQ10 changes and muscle toxicity as only 1 participant experienced myalgia requiring discontinuation (CK negative).
Because circulating CoQ10 is transported by lipoporteins, it is possible that baseline CoQ10 is not a marker of intrinsic HMG-CoA reductase activity or specific predictor of statin response. Rather, it may just be a marker of lipoprotein concentrations, and changes in CoQ10 may be a predictable consequence of lipid lowering through non-specific upregulation of hepatic LDL receptors. If this were the case, non-statin agents that influence LDL receptor expression through HMG-CoA reductase-independent mechanisms should have similar effects on CoQ10 concentrations as statins. However, in a study evaluating ezetimibe, simvastatin, and the combination, no CoQ10 changes were observed in the ezetimibe group despite a reduction in LDL-C, while the simvastatin and combination groups demonstrated significant CoQ10 reductions.25 Similarly, fibrates also did not seem to affect CoQ10, but in the absence of a major effect on LDL-C, it is difficult to draw conclusions regarding fibrates in particular.29 Taken in sum, these findings suggest basal CoQ10 to be a potential marker of HMG-CoA reductase activity and likely predictor of statin-specific responses.
Several limitations of our study should be acknowledged. First, our study investigated the effects of atorvastatin on circulating CoQ10 in healthy individuals. While this allowed for characterization of atorvastatin effects with minimal confounding by concomitant disease or drug use, patients with cardiovascular disease often have concomitant conditions (e.g., advanced age, renal dysfunction, interacting medications) that increase predisposition to myopathic syndromes when treated with statins. Therefore, while our study remains the largest and longest study of atorvastatin 80 mg effects on plasma CoQ10 levels to date, investigation of these effects in a cardiovascular disease population is warranted. Secondly, as with most statin studies of CoQ10 we did not measure muscle CoQ10 or mitochondrial dysfunction in the population. CoQ10 plasma concentrations do not necessarily reflect skeletal muscle or liver tissue concentrations of CoQ10. Nonetheless, muscle biopsies to examine effects of atorvastatin on CoQ10 were beyond the scope of the present investigation, and are likely to be too cumbersome for clinical translation. Thirdly, while CoQ10 is in part endogenously produced, dietary intake contributes to total CoQ10 concentrations. While we did not quantify dietary CoQ10 intake through questionnaires, participants in our study were instructed to maintain a consistent diet at every visit over the 16-week duration. Finally, the mechanism of our finding that baseline CoQ10 concentrations associate with LDL-C response to atorvastatin is unknown. While we hypothesize that higher pre-treatment plasma CoQ10 concentrations reflect a molecular predominance of prenylation protein production (over cholesterol production) that could explain attenuated cholesterol-response to maximally dosed atorvastatin, this hypothesis should be tested in other prospective studies with various statins and doses. Validation of this hypothesis in hypercholesterolemic populations is warranted.
CONCLUSION
Baseline CoQ10:LDL-C ratio may represent a novel biomarker for statin response, based on our observation that patients with higher pretreatment CoQ10:LDL-C ratio demonstrated a diminished reduction in LDL-C. Additionally, treatment with high-dose atorvastatin significantly decreases plasma CoQ10 concentrations. This effect is not fully explained by changes in circulating lipoproteins, suggesting that atorvastatin may inhibit endogenous CoQ10 production. Taken together, these findings may have important implications for statin safety and effectiveness.
ACKNOWLEDGEMENTS
We thank Cheryl Galloway for her laboratory assistance. This study was supported by American Heart Association Florida—Puerto Rico Affiliate Scientist Development grant 043278B (IZ), an American College of Clinical Pharmacy Kos Dyslipidemia Research Award (IZ), University of Florida General Clinical Research Center grant M01 RR00082, NIH T35 HL007930, and NIH C06 grant RR17568.
Abbreviations
- CoQ10
coenzyme Q10
- LDL-C
low-density lipoprotein cholesterol
- high-density lipoprotein cholesterol
HDL-C: BMI, body mass index
- CK
creatine kinase
- RANOVA
repeated-measures analysis of variance
Footnotes
Publisher's Disclaimer: This is a PDF file of an unedited manuscript that has been accepted for publication. As a service to our customers we are providing this early version of the manuscript. The manuscript will undergo copyediting, typesetting, and review of the resulting proof before it is published in its final citable form. Please note that during the production process errors may be discovered which could affect the content, and all legal disclaimers that apply to the journal pertain.
Conflict of interest: None of the authors have any conflicts of interest related to the contents of this manuscript.
REFERENCES
- 1.Zineh I, Welder GJ, DeBella AE, Arant CB, Wessel TR, Schofield RS. Atorvastatin effect on circulating and leukocyte-produced CD40 ligand concentrations in people with normal cholesterol levels: a pilot study. Pharmacotherapy. 2006;26:1572–7. doi: 10.1592/phco.26.11.1572. [DOI] [PubMed] [Google Scholar]
- 2.Pedro-Botet J, Schaefer EJ, Bakker-Arkema RG, Black DM, Stein EM, Corella D, Ordovas JM. Apolipoprotein E genotype affects plasma lipid response to atorvastatin in a gender specific manner. Atherosclerosis. 2001;158:183–93. doi: 10.1016/s0021-9150(01)00410-5. [DOI] [PubMed] [Google Scholar]
- 3.Cannon CP, Braunwald E, McCabe CH, Rader DJ, Rouleau JL, Belder R, Joyal SV, Hill KA, Pfeffer MA, Skene AM. Intensive versus moderate lipid lowering with statins after acute coronary syndromes. N Engl J Med. 2004;350:1495–504. doi: 10.1056/NEJMoa040583. [DOI] [PubMed] [Google Scholar]
- 4.LaRosa JC, Grundy SM, Waters DD, Shear C, Barter P, Fruchart JC, Gotto AM, Greten H, Kastelein JJ, Shepherd J, Wenger NK. Intensive lipid lowering with atorvastatin in patients with stable coronary disease. N Engl J Med. 2005;352:1425–35. doi: 10.1056/NEJMoa050461. [DOI] [PubMed] [Google Scholar]
- 5.Zineh I. Pharmacogenetics of response to statins. Curr Atheroscler Rep. 2007;9:187–94. doi: 10.1007/s11883-007-0018-3. [DOI] [PMC free article] [PubMed] [Google Scholar]
- 6.Sattar N, Murray HM, McConnachie A, Blauw GJ, Bollen EL, Buckley BM, Cobbe SM, Ford I, Gaw A, Hyland M, Jukema JW, Kamper AM, Macfarlane PW, Murphy MB, Packard CJ, Perry IJ, Stott DJ, Sweeney BJ, Twomey C, Westendorp RG, Shepherd J. C-reactive protein and prediction of coronary heart disease and global vascular events in the Prospective Study of Pravastatin in the Elderly at Risk (PROSPER) Circulation. 2007;115:981–9. doi: 10.1161/CIRCULATIONAHA.106.643114. [DOI] [PubMed] [Google Scholar]
- 7.Marcoff L, Thompson PD. The role of coenzyme Q10 in statin-associated myopathy: a systematic review. J Am Coll Cardiol. 2007;49:2231–7. doi: 10.1016/j.jacc.2007.02.049. [DOI] [PubMed] [Google Scholar]
- 8.Rundek T, Naini A, Sacco R, Coates K, DiMauro S. Atorvastatin decreases the coenzyme Q10 level in the blood of patients at risk for cardiovascular disease and stroke. Arch Neurol. 2004;61:889–92. doi: 10.1001/archneur.61.6.889. [DOI] [PubMed] [Google Scholar]
- 9.Davidson M, McKenney J, Stein E, Schrott H, Bakker-Arkema R, Fayyad R, Black D. Comparison of one-year efficacy and safety of atorvastatin versus lovastatin in primary hypercholesterolemia. Atorvastatin Study Group I. Am J Cardiol. 1997;79:1475–81. doi: 10.1016/s0002-9149(97)00174-4. [DOI] [PubMed] [Google Scholar]
- 10.Hansen G, Christensen P, Tuchsen E, Lund T. Sensitive and selective analysis of coenzyme Q10 in human serum by negative APCI LC-MS. Analyst. 2004;129:45–50. doi: 10.1039/b308690a. [DOI] [PubMed] [Google Scholar]
- 11.Alsheikh-Ali AA, Maddukuri PV, Han H, Karas RH. Effect of the magnitude of lipid lowering on risk of elevated liver enzymes, rhabdomyolysis, and cancer: insights from large randomized statin trials. J Am Coll Cardiol. 2007;50:409–18. doi: 10.1016/j.jacc.2007.02.073. [DOI] [PubMed] [Google Scholar]
- 12.Grundy SM, Cleeman JI, Merz CN, Brewer HB, Jr., Clark LT, Hunninghake DB, Pasternak RC, Smith SC, Jr., Stone NJ. Implications of recent clinical trials for the National Cholesterol Education Program Adult Treatment Panel III guidelines. Circulation. 2004;110:227–39. doi: 10.1161/01.CIR.0000133317.49796.0E. [DOI] [PubMed] [Google Scholar]
- 13.Libby P. The forgotten majority: unfinished business in cardiovascular risk reduction. J Am Coll Cardiol. 2005;46:1225–8. doi: 10.1016/j.jacc.2005.07.006. [DOI] [PubMed] [Google Scholar]
- 14.Tomasetti M, Alleva R, Solenghi MD, Littarru GP. Distribution of antioxidants among blood components and lipoproteins: significance of lipids/CoQ10 ratio as a possible marker of increased risk for atherosclerosis. Biofactors. 1999;9:231–40. doi: 10.1002/biof.5520090218. [DOI] [PubMed] [Google Scholar]
- 15.Mortensen SA, Leth A, Agner E, Rohde M. Dose-related decrease of serum coenzyme Q10 during treatment with HMG-CoA reductase inhibitors. Mol Aspects Med. 1997;18(Suppl):S137–44. doi: 10.1016/s0098-2997(97)00014-9. [DOI] [PubMed] [Google Scholar]
- 16.Mabuchi H, Higashikata T, Kawashiri M, Katsuda S, Mizuno M, Nohara A, Inazu A, Koizumi J, Kobayashi J. Reduction of serum ubiquinol-10 and ubiquinone-10 levels by atorvastatin in hypercholesterolemic patients. J Atheroscler Thromb. 2005;12:111–9. doi: 10.5551/jat.12.111. [DOI] [PubMed] [Google Scholar]
- 17.Shin MJ, Chung N, Lee JH, Jang Y, Park E, Jeon KI, Chung JH, Seo BY. Effects of simvastatin on plasma antioxidant status and vitamins in hypercholesterolemic patients. Int J Cardiol. 2007;118:173–7. doi: 10.1016/j.ijcard.2006.03.089. [DOI] [PubMed] [Google Scholar]
- 18.Elmberger PG, Kalen A, Lund E, Reihner E, Eriksson M, Berglund L, Angelin B, Dallner G. Effects of pravastatin and cholestyramine on products of the mevalonate pathway in familial hypercholesterolemia. J Lipid Res. 1991;32:935–40. [PubMed] [Google Scholar]
- 19.Paiva H, Thelen KM, Van Coster R, Smet J, De Paepe B, Mattila KM, Laakso J, Lehtimaki T, von Bergmann K, Lutjohann D, Laaksonen R. High-dose statins and skeletal muscle metabolism in humans: a randomized, controlled trial. Clin Pharmacol Ther. 2005;78:60–8. doi: 10.1016/j.clpt.2005.03.006. [DOI] [PubMed] [Google Scholar]
- 20.Laaksonen R, Ojala JP, Tikkanen MJ, Himberg JJ. Serum ubiquinone concentrations after short- and long-term treatment with HMG-CoA reductase inhibitors. Eur J Clin Pharmacol. 1994;46:313–7. doi: 10.1007/BF00194398. [DOI] [PubMed] [Google Scholar]
- 21.Laaksonen R, Jokelainen K, Sahi T, Tikkanen MJ, Himberg JJ. Decreases in serum ubiquinone concentrations do not result in reduced levels in muscle tissue during shortterm simvastatin treatment in humans. Clin Pharmacol Ther. 1995;57:62–6. doi: 10.1016/0009-9236(95)90266-X. [DOI] [PubMed] [Google Scholar]
- 22.Laaksonen R, Jokelainen K, Laakso J, Sahi T, Harkonen M, Tikkanen MJ, Himberg JJ. The effect of simvastatin treatment on natural antioxidants in low-density lipoproteins and high-energy phosphates and ubiquinone in skeletal muscle. Am J Cardiol. 1996;77:851–4. doi: 10.1016/S0002-9149(97)89180-1. [DOI] [PubMed] [Google Scholar]
- 23.de Lorgeril M, Salen P, Bontemps L, Belichard P, Geyssant A, Itti R. Effects of lipid-lowering drugs on left ventricular function and exercise tolerance in dyslipidemic coronary patients. J Cardiovasc Pharmacol. 1999;33:473–8. doi: 10.1097/00005344-199903000-00018. [DOI] [PubMed] [Google Scholar]
- 24.Bleske BE, Willis RA, Anthony M, Casselberry N, Datwani M, Uhley VE, Secontine SG, Shea MJ. The effect of pravastatin and atorvastatin on coenzyme Q10. Am Heart J. 2001;142:E2. doi: 10.1067/mhj.2001.116762. [DOI] [PubMed] [Google Scholar]
- 25.Berthold HK, Naini A, Di Mauro S, Hallikainen M, Gylling H, Krone W, Gouni-Berthold I. Effect of ezetimibe and/or simvastatin on coenzyme Q10 levels in plasma: a randomised trial. Drug Saf. 2006;29:703–12. doi: 10.2165/00002018-200629080-00007. [DOI] [PubMed] [Google Scholar]
- 26.Ghirlanda G, Oradei A, Manto A, Lippa S, Uccioli L, Caputo S, Greco AV, Littarru GP. Evidence of plasma CoQ10-lowering effect by HMG-CoA reductase inhibitors: a double-blind, placebo-controlled study. J Clin Pharmacol. 1993;33:226–9. doi: 10.1002/j.1552-4604.1993.tb03948.x. [DOI] [PubMed] [Google Scholar]
- 27.Human JA, Ubbink JB, Jerling JJ, Delport R, Vermaak WJ, Vorster HH, Lagendijk J, Potgieter HC. The effect of Simvastatin on the plasma antioxidant concentrations in patients with hypercholesterolaemia. Clin Chim Acta. 1997;263:67–77. doi: 10.1016/s0009-8981(97)06557-1. [DOI] [PubMed] [Google Scholar]
- 28.Rundek T, Naini A, Sacco R, Coates K, DiMauro S. Atorvastatin Decreases the Coenzyme Q10 Level in the Blood of Patients at Risk for Cardiovascular Disease and Stroke. Arch Neurol. 2004;61:889–92. doi: 10.1001/archneur.61.6.889. [DOI] [PubMed] [Google Scholar]
- 29.Asano A, Kobayashi J, Murase Y, Nohara A, Kawashiri MA, Inazu A, Shimizu M, Mabuchi H. Effects of fenofibrate therapy on plasma ubiquinol-10 and ubiquinone-10 levels in Japanese patients with hyperlipidemia and type 2 diabetes mellitus. Pharmacotherapy. 2006;26:447–51. doi: 10.1592/phco.26.4.447. [DOI] [PubMed] [Google Scholar]