

Abstract
Multifunctional colloidal core-shell nanoparticles of magnetic nanocrystals (of iron oxide or FePt) or gold nanorods encapsulated in silica shells doped with the fluorescent dye, Tris(2,2′-bipyridyl)dichlororuthenium(II) hexahydrate (Rubpy) were synthesized. The as-prepared magnetic nanocrystals are initially hydrophobic and were coated with silica using a microemulsion approach, while the as-prepared gold nanorods are hydrophilic and were coated with silica using a Stöber-type of process. Each approach yielded monodisperse nanoparticles with uniform fluorescent dye-doped silica shells. These colloidal heterostructures have the potential to be used as dual-purpose tags—exhibiting a fluorescent signal that could be combined with either dark-field optical contrast (in the case of the gold nanorods), or enhanced contrast in magnetic resonance images (in the case of magnetic nanocrystal cores). The optical and magnetic properties of the fluorescent silica-coated gold nanorods and magnetic nanocrystals are reported.
1. Introduction
Colloidal nanoparticles are useful tools for studying biological systems [1-3]. Their size is similar to biological macromolecules [3,4] and their surfaces provide a bioconjugation scaffold to tether biocompatible coatings [2,5,6] and biologically-relevant recognition molecules like nucleic acids [6,7], peptide fragments [4], and antibodies [2,3,8]. Nanoparticles can be used to map cellular components and monitor and track them in real time [5,9] and can also be used as drug delivery vehicles [10,11] and therapeutic agents [12-14]. For example, superparamagnetic iron oxide nanoparticles are commercially available as magnetic resonance imaging (MRI) contrast agents [15,16]; although higher contrast is still desired and new magnetic nanoparticles are being studied and developed for these purposes [17-21]. Recently, colloidal nanomaterials have been synthesized with complicated structure and composition, designed to exhibit multiple functionality—for example, nanoparticles that both fluoresce and respond to magnetic fields [22,23]. These multifunctional nanoparticles provide the opportunity for multiple imaging and therapeutic modalities from a single unit [23-25] for unprecedented opportunities for medical advancement.
Examples of multifunctional nanoparticles include FePt-Au heterodimers with the FePt domain for magnetic resonance imaging (MRI) contrast and Au as a docking point for thiolated polyethylene glycol and neutravidin ligands [26], and gold nanoshells on a silica-coated iron oxide core for both MRI and photothermal therapy [12]. For combined MR and fluorescence imaging, a variety of multifunctional nanomaterials have been made, including fluorescent semiconductor nanocrystals doped with magnetic impurity atoms [22], fluorescent dye-doped silica-coated magnetic Fe3O4 nanoparticles [27,28] and fluorescent dye-doped silica particles decorated with paramagnetic gadolinium [29] or iron oxide particles [30] on their surfaces. Silica has been utilized rather extensively as a nanoparticle material for biological applications [31,32] because it provides both a surface for bioconjugation and a host matrix for fluorescent molecules that can improve dye photostability and biocompatibility [33-44]. Furthermore, several strategies to coat colloidal nanocrystals with silica have also been developed in recent years [33,47-49], which makes silica an interesting material to integrate into multifunctional heterostructure nanoparticles for biological applications.
Here, we report the coating of FePt and Fe2O3 nanocrystals and Au nanorods with uniform silica shells embedded with fluorescent dye. The nanocrystals or nanorods are first synthesized and then coated with silica. Two different coating techniques were utilized because the FePt and Fe2O3 nanocrystals are initially passivated with hydrophobic ligands and are only dispersible in organic solvents, while the Au nanorods are coated with hydrophilic ligands are disperse only in polar solvents. Both coating techniques yielded uniform silica shells with incorporated dye. The optical absorbance and luminescence of these multifunctional colloidal heterostructure nanoparticles are reported. The magnetic properties of the Fe2O3 and FePt core dye-doped silica shell nanoparticles are also reported and their potential suitability for use as MRI contrast agents is described.
2. Experimental section
2.1 Materials and Supplies
All chemicals were used as received. Platinum acetylacetonate (Pt(acac)2, 97%), iron pentacarbonyl (Fe(CO)5, 99.999%), oleylamine (70%), oleic acid (99%), Igepal CO-520, Tris(2,2′-bipyridyl)dichlororuthenium(II) hexahydrate (Rubpy, 99.95%), fluorescein 5(6)- isothiocyanate (FITC, >90%), tetraethyl orthosilicate (TEOS, 98%), hydrogen tetrachloroaurate(III) hydrate (99.9+%), sodium borohydride (98+%), silver nitrate (99+%), hexadecylcetyltrimethylammonium bromide (CTAB, batch number H6269, 99%), ascorbic acid (99+%), poly(allylamine hydrochloride) (PAH, MW 15,000), and octadecyltrimethoxysilane (OTMOS, 90%) were purchased from Sigma-Aldrich. Ethanol (ACS grade), 2-propanol (ACS grade), and chloroform (ACS grade) were purchased from Fisher Scientific. Dioctyl ether (>97%), poly(vinylpyrollidone) (PVP, MW 10,000), and cyclohexane (ACS grade) were purchased from Fluka. Poly(styrenesulfonic acid) sodium salt (PSS, MW 18,000) was purchased from Polysciences, Inc. Sodium Chloride (NaCl, 99%) was purchased from Mallinckrodt. Ammonium hydroxide (NH4OH, aqueous solution (30%)) was purchased from EMD Chemicals. 3-aminopropyltriethoxysilane (APTES) was purchased from Gelest. Doubly-distilled deionized water (DI-H2O) was used in all preparations. FePt and Fe2O3 nanocrystals were synthesized under inert (N2) atmosphere using standard glovebox and Schlenk line techniques with continuous stirring using a Teflon-coated magnetic stir bar.
2.2 FePt and Fe2O3 Nanocrystal Synthesis
FePt nanocrystals were prepared as previously described [50]. In a 50 mL three neck flask, 0.197 g (0.50 mmol) Pt(acac)2 and 10 mL of dioctyl ether were degassed under reduced pressure (200 mTorr) and at elevated temperature (45°C) for 1 hour. This solution was heated to 120°C under N2 flow at atmospheric pressure. Next, 0.15 mL (1.15 mmol) Fe(CO)5, 1.45 mL (4.40 mmol) oleylamine, and 1.35 mL (4.25 mmol) oleic acid were prepared in three separate syringes in a fume hood and injected into the reaction solution sequentially. [Caution must be taken when preparing Fe(CO)5, as it is extremely volatile and potentially hazardous (refer to MSDS before use)]. The temperature was raised (~15°C/min) to 240 °C and maintained for 1 hour, before heating to reflux (~297°C) and stirring for an additional hour. The reaction flask was cooled to room temperature.
Fe2O3 nanocrystals were prepared as previously described [51]. In a 25 mL three neck flask, 10 mL of dioctyl ether and 960μL (4.56 mmol) of oleic acid were heated to 100 °C under N2 flow at atmospheric pressure. Next, 0.2 mL (1.52 mmol) of Fe(CO)5 was injected into this solution and the temperature was raised to 300°C. The solution was refluxed for one hour before removing the reaction flask from the heating mantle and allowing it to cool to room temperature. The flask was then opened to air to oxidize the as-made Fe nanocrystals.
FePt and Fe2O3 nanocrystals were purified as follows. After reaching room temperature, the reaction solution was centrifuged for 5 minutes at 8000 rpm (8228 g). The precipitate—consisting of solid byproducts and poorly capped nanocrystals—was discarded. Excess ethanol was then added to the supernatant and this mixture was centrifuged for 10 minutes at 8000 rpm (8228 g) to precipitate the nanocrystals. The supernatant was discarded. The nanocrystals were further purified in two additional washing steps by redispersing in hexane followed by the addition of ethanol as an antisolvent and then centrifugation. Nanocrystals were stored as a concentrated (~10 mg/mL) dispersion in hexane for later use.
2.3 Gold Nanorod Synthesis
Au nanorods were synthesized as previously described [52]. Colloidal Au seed particles were first prepared by mixing an aqueous solution of CTAB (0.1 M, 9.75 mL) with hydrogen tetrachloroaurate(III) hydrate (0.01 M, 250 μL) and then adding sodium borohydride (0.01 M, 600 μL) to reduce the gold and induce seed nucleation. 12 μL of this seed solution was then injected into an aqueous growth solution of CTAB (0.1 M, 9.5 ml), silver nitrate (0.01 M, 75 μL), hydrogen tetrachloroaurate(III) hydrate (0.01 M, 500 μL), and ascorbic acid (0.1 M, 55 μL). This solution was stirred at room temperature for 24 hours.
2.4 Rubpy-doped silica coating of FePt and Fe2O3 nanocrystals and Au nanorods
FePt and Fe2O3 nanocrystals were encapsulated within a Rubpy doped amorphous silica (SiO2) shell in inverse micelle microemulsion media [34,47,53]. 4 mL of Igepal CO-520 was added to 80 mL of cyclohexane in a 250 mL Erlenmeyer flask and stirred at room temperature for 5 minutes. 2 mL of a cyclohexane dispersion of FePt or Fe2O3 nanocrystals (5 mg/mL) was added to the 80 mL cyclohexane mixture and stirred for 5 minutes. 1.75 mg of Rubpy dissolved in 0.65 mL of aqueous NH4OH solution (30% by volume) was added dropwise to the nanocrystal dispersion, followed by the dropwise addition of 0.75 mL of tetraethyl orthosilcate (TEOS). The mixture was stirred for 48 hours. The Rubpy-doped SiO2-coated nanocrystals (FePt@SiO2(Rubpy) or Fe2O3@SiO2(Rubpy)) were then purified by extraction: 30 mL of methanol was added to induce phase separation between cyclohexane-rich and methanol-rich phases and the methanol-rich phase containing the nanocrystals was collected. The solvent was then partially evaporated from the nanoparticle dispersion on a rotary evaporator. Once the dispersion appeared turbid it was removed from the rotary evaporator and centrifuged for 15 minutes at 8000 rpm (8228 g). The supernatant was discarded. Excess Rubpy and surfactant were removed by redispersing the particles in 1:1 vol% methanol:hexane and then centrifuging at 8000 rpm (8228 g) for 15 minutes and discarding the supernatant. This washing procedure was repeated 5 times. The silica-coated nanocrystals were stored as a concentrated dispersion for further characterization in ethanol or DI-H2O.
The as-prepared CTAB-coated Au nanorods disperse only in polar solvents and cannot be coated with silica in inverse micelle microemulsions. Therefore, the nanorods were coated using a modification of a previously published strategy, which utilizes the adsorption of a polyelectrolyte layer followed by a modified Stöber method for silica deposition [48,54]. 10 mL of as-synthesized Au nanorods were centrifuged at 8000 rpm (8228 g) for 15 minutes and redispersed in 5 mL of DI-H2O to be coated. PSS coating: the Au nanorod dispersion was added dropwise to a 5 mL aqueous solution of 111 μM PSS and 6 mM NaCl and stirred for 3 hours. The PSS-coated Au nanorods were collected by centrifugation at 8000 rpm (8228 g) for 15 minutes. The supernatant was discarded and the nanorods were redispersed in 5 mL of DI-H2O. PAH coating: the aqueous dispersion of PSS coated Au nanorods was then added dropwise to 5 mL of aqueous 133 μM PAH and 6 mM NaCl solution and stirred for 3 hours. The nanorods were precipitated by centrifugation at 8000 rpm (8228 g) for 15 minutes. The supernatant was discarded and the nanorods were then redispersed in 5 mL of DI-H2O. PVP coating: the dispersion of PSS/PAH-coated Au nanorods was then added dropwise to 5 mL of aqueous 400 μM PVP solution and stirred overnight. The nanorods were precipitated by centrifugation at 8000 rpm (8228 g) for 15 minutes and the supernatant was discarded. The nanorods were redispersed in 0.1 mL of DI-H2O. This aqueous dispersion of PSS/PAH/PVP polyelectrolyte-coated Au nanorods was added dropwise to 0.5 mL of isopropyl alcohol under vigorous stirring. 0.46 mL of DI-H2O was then added. Separately, Rubpy was dissolved in aqueous 30 vol% NH4OH at a concentration of 2 mg/mL. 384 μL of the NH4OH/Rubpy solution was mixed with 9.62 mL of isopropyl alcohol. 0.72 mL of this NH4OH/Rubpy/isopropyl alcohol solution and 0.1 mL of a 0.97 vol% TEOS in isopropyl alcohol solution were added to the Au nanorod dispersion and stirred for 12 hours. The silica coated Au nanorods were collected by centrifuging at 8000 rpm (8228 g) for 15 minutes and the supernatant was discarded. Excess Rubpy was removed by redispersing the particles in ethanol or DI-H2O and then centrifuging at 8000 rpm (8228 g) for 15 minutes and discarding the supernatant. This washing procedure was repeated 5 times. The silica-coated Au nanorods were stored as a concentrated dispersion for further characterization in ethanol or DI-H2O.
In some cases, the surfaces of the silica-coated nanocrystals and nanorods were further treated by exposure to OTMOS using procedures described in the literature [47]. The silica-coated magnetic nanocrystals or Au nanorods were dispersed in 3 mL of ethanol at a concentration of 1 mg/mL and mixed with 30 μL of 30 vol% NH4OH aqueous solution. Approximately 150 μL of 10 vol% OTMOS in chloroform was added dropwise to the nanoparticle dispersion, followed by 24 hrs of stirring. The nanoparticles were collected by centrifugation at 8000 rpm (8228 g) for 8 minutes. The nanoparticles were washed by an additional step consisting of redispersion in 1:1 vol% chloroform:ethanol and centrifuging at 8000 rpm (8228 g) for 8 minutes. The supernatant was discarded.
2.5 FITC-doped Silica coating of Fe2O3 and Au nanorods
Fe2O3 nanocrystals were encapsulated in silica shells doped with the dye FITC using the same inverse micelle microemulsion coating method described for the Rubpy-doped silica coatings with the exception that the dye was not dissolved in the aqueous ammonium hydroxide solution and in the final reaction step, TEOS was not immediately added. Rather, FITC was first covalently linked to the silane coupling agent APTES by dissolving 10 mg of FITC in 48 μL of APTES (a 1:4 molar ratio). Cyclohexane was then added to create a 10 vol% FITC/APTES in cyclohexane solution. This FITC/APTES/cyclohexane solution was stirred for 24 hours in the glovebox in the dark prior to use.
4 mL of Igepal CO-520 was added to 80 mL of cyclohexane in a 250 mL Erlenmeyer flask and stirred at room temperature for 5 minutes. Then 2 mL of a cyclohexane dispersion of Fe2O3 nanocrystals (5 mg/mL) were added to the 80 mL cyclohexane mixture and stirred for an additional 5 minutes. 750 μL of the FITC/APTES/cyclohexane solution was added dropwise to the nanocrystal dispersion, followed by the dropwise addition of 0.65 mL of aqueous ammonium hydroxide solution (30% by volume). Because the hydrolysis rate of APTES is five times slower than that of TEOS [40], the reaction was stirred for 24 hours prior to the TEOS addition to ensure that the APTES bound to the FITC was hydrolyzed and would be incorporated in the SiO2 shell. Then 0.75 mL of TEOS was added dropwise to the solution and then the mixture was stirred for 48 hours.
Similarly, FITC was incorporated in the silica coating on the Au nanorods by first making a FITC/APTES/ethanol solution. FITC was covalently linked to APTES by dissolving 10 mg of FITC in 48 μL of APTES (a 1:4 molar ratio). Anhydrous ethanol was then added to create a 10 vol% FITC/APTES in ethanol solution. This FITC/APTES/ethanol solution was stirred for 24 hours in the glovebox in the dark prior to use.
0.1 mL of PSS/PAH/PVP polyelectrolyte-coated Au nanorods in DI-H2O was added dropwise to 0.5 mL of isopropyl alcohol under vigorous stirring. 0.46 mL of DI-H2O was then added. Separately, 384 μL of the aqueous 30 vol% ammonium hydroxide was mixed with 9.62 mL of isopropyl alcohol, and 0.72 mL of this NH4OH//isopropyl alcohol solution was added dropwise to the Au nanorod dispersion. Also in a separate flask, 100 μL of FITC/APTES/ethanol solution was mixed with 9.9 mL of isopropyl alcohol. 200 μL of this FITC/APTES/ethanol/isopropyl alcohol solution was added to the nanorod dispersion, and the reaction was stirred for 24 hours before adding 0.1 mL of a 0.97 vol% TEOS in isopropyl alcohol solution. The Au nanorod dispersion was stirred for 12 hours.
2.6 Transfer Printing FePt@SiO2(Rubpy) Nanoparticles Arrays
Langmuir Blodgett films of OTMOS coated FePt@SiO2(Rubpy) nanoparticles were made using a system 2 KSV minitrough filled with DI-H2O. A 0.5 mg/ml solution of OTMOS coated FePt@SiO2(Rubpy) nanoparticles in chloroform was spread drop-wise onto the water surface and the solvent was allowed to evaporate for 10 minutes (total dispersion volumes ranged from 300 to 600 μl). Films were then compressed at a rate of 5 mm/min until reaching a surface pressure of 37 mN/m. Pre-patterned poly(dimethylsiloxane) (PDMS) stamps were carefully brought into contact with the water surface to transfer the nanoparticle film to the PDMS stamp. The PDMS stamp coated with the nanoparticle monolayer was then gently brought into conformal contact with clean silicon or glass substrates. After 30 seconds of contact, the PDMS stamps were slowly removed leaving behind densely packed arrays of FePt@SiO2(Rubpy) nanoparticles.
2.7 Sample Characterization
Nanoparticles were imaged using transmission electron microscopy (TEM) and scanning electron microscopy (SEM). TEM was performed using either a Phillips EM208 TEM with 80 kV accelerating voltage or a JEOL 2010F HRTEM with the field emission gun operated at 200 kV. Images were digitally acquired. TEM samples were prepared by dropcasting the nanoparticles (uncoated FePt or Fe2O3 were dispersed in hexane, uncoated gold nanorods were dispersed in DI-H2O, and the Rubpy-doped silica coated nanoparticles were dispersed in ethanol) onto carbon-coated copper 200 mesh TEM grids (Electron Microscopy Sciences). EDS data were acquired on the JEOL 2010F TEM with an Oxford Inca EDS detector. SEM images were obtained from nanoparticles dropcast on silicon substrates using a Zeiss Supra 40 SEM with an in-lens arrangement at 3 keV working voltage and 5 mm lens to detector distance.
The optical properties of the nanoparticles were determined using optical fluorescence microscopy and UV-visible absorbance and photoluminescence (PL) spectroscopy. Absorbance and photoluminescence spectra were acquired at room temperature using a Varion Cary 50 Bio UV/Vis Spectrophotometer and Varion Cary Eclipse Fluorescence Spectrophotometer, with samples dispersed in water in quartz cuvettes with a 1 cm path length. Optical fluorescence microscopy was performed with a Leica DM IRBE microscope with 40X or 100X oil objective, 100 Watt Hg lamp, and 1.5” × 1.5” cover slides. The samples where excited with blue light and the emission was imaged with a black and white Leica DFC350 FX camera after filtering with a 515 nm long pass FITC filter.
The magnetization properties were measured on a superconducting quantum interference device (SQUID) magnetometer (Quantum Design). Samples were prepared by transferring 3 to 7 mg of dry SiO2 encapsulated nanocrystals into gelatin capsules (Capsuline #4) and filling the remainder of the capsule with cotton. At applied fields of ~5 T, the magnetic signal from the FePt@SiO2(Rubpy) or Fe2O3@SiO2(Rubpy) nanoparticles was two orders of magnitude larger than the contribution from the sample holder and background; therefore, background subtraction was not necessary.
T1 and T2 relaxation times of the FePt@SiO2(Rubpy) and Fe2O3@SiO2(Rubpy) nanoparticles were measured by performing MRI of aqueous nanocrystal dispersions at The University of Texas at Austin Imaging Research Center on a General Electric Signa EXCITE 3 T scanner. 2 mL snap shut centrifuge tubes were completely filled with varying nanoparticle concentrations in DI-H2O and inserted into tight fitting holes bored into solid 3” H × 6” D cylindrical shaped high density hard polymer material. The sample holder was then positioned in the center of the standard GE-product head coil. Images of all samples were obtained by prescribing a set of 2-mm-thick slices in a quasi-coronal orientation that was nearly normal to vertical axis of the sample tubes. 128×128 images were then obtained in a 160-mm field-of-view to yield 1.25-mm pixels. Imaging data was analyzed by measuring the mean intensity values averaged over a 5×5-pixel region on one slice near the center of each tube. T1 was obtained by running inversion-prepared spin-echo sequences at minimum echo time (TE = 50 ms), and inversion times (TI) varying from 50 to 1750 ms in eight roughly linear steps. The resulting intensity values were fit to the function using the “fminsearch” non-linear 0 optimization routine in Matlab (Mathworks Inc, Natick MA) and a least-square-error metric. T2 was obtained by running spin-echo sequences with TE varying from 50 to 2000 ms in eight roughly logarithmic steps, and fitting the data to an exponential decay function using non-linear optimization with a least-square-error metric.
3. Results and discussion
3.1 Synthesis and structural analysis
The as-made FePt and Fe2O3 nanocrystals are hydrophobic and disperse in organic solvents; whereas, the Au nanorods are hydrophilic and disperse only in polar solvents. Therefore, different silica coating methods were needed for these different classes of nanomaterials. Figure 1 illustrates the two coating strategies used. Magnetic nanocrystals were coated in microemulsion media and Au nanorods were coated using a modified Stöber method in a polar mixture of alcohol and water.
Fig. 1.

Illustration of the two different silica coating strategies used for magnetic nanocrystals and Au nanorods. (Top row) As-prepared CTAB-covered Au nanorods were first primed with the adsorption of a polyelectrolyte layer and then coated with silica using a modified Stöber method in a mixture of water and alcohol. The polyelectrolyte layers are represented with different colors, and the silica shell is shown in tan. (Bottom row) Hydrophobic Fe2O3 and FePt nanocrystals were coated with silica in microemulsion reaction media. The surfactant (squiggly lines) stabilizes inverse micelles (gray dots) and controls the silica deposition (tan circles) and prevents aggregation of the nanocrystals (black dots).
Figure 2 shows TEM images of FePt and Fe2O3 nanocrystals, and Au nanorods, before and after coating with Rubpy-doped silica shells. Both of the silica-coating approaches—the microemulsion approach and the Stöber approach—provide uniform silica coatings. One important key to obtaining size- and shape-monodisperse coated nanoparticles is to begin with core nanocrystals (and nanorods) that are monodisperse. Silica deposits heterogeneously on the surface of the core nanocrystals at a steady and uniform rate on particles throughout the dispersion; therefore, the final size distribution of coated nanoparticles will be narrow provided that the initial nanocrystal size distribution is narrow.
Fig. 2.

TEM images of (A, B, C) FePt and (D,E,F) Fe2O3 nanocrystals and (G,H,I) Au nanorods before and after coating with Rubpy-doped silica. The average diameters of the FePt and Fe2O3 nanocrystals are 6.6 nm and 6.5 nm, respectively. The Au nanorods have an average length of 44 nm and width of 15 nm (aspect ratio = 3). The FePt composition was determined by EDS to be 40% Fe and 60% Pt.
The inverse micelle microemulsion method provides a method for coating hydrophobic nanocrystals because the nanoparticles disperse initially in the continuous organic phase of the inverse microemulsion. The silica coating chemistry, however, occurs in the aqueous reaction compartments within the inverse micelles. It is interesting and perhaps somewhat unexpected that this coating approach works, as the nanocrystals must interface with the aqueous compartments of the inverse micellar media to a significant extent to enable heterogeneous silica deposition on their surfaces. The microemulsion method provides a high yield of silica-coated FePt and Fe2O3 nanocrystals with uniform shell thickness. Using the recipe described here, 10 mg of nanocrystals were coated with uniform silica shell thickness. The shell thickness could be tuned from 3 nm to 20 nm by varying the concentration of TEOS, similar to what has been previously described [47]. The presence of Rubpy does not affect the silica deposition chemistry.
CTAB-coated Au nanorods required significantly different silica coating chemistry than the FePt and Fe2O3 nanocrystals. First of all, CTAB-coated Au nanorods do not disperse in organic solvents. Secondly, CTAB inhibits silica deposition [48] and can lead to mesoporous coatings [24]. It is not possible to remove CTAB from the nanorod surface without destroying the nanorods; therefore, the only way to coat CTAB-coated Au nanorods with a uniform, continuous silica coating is to first protect the surface with another surfactant layer. Pastoriza-Santos et al. [48] found that a series of polyelectrolyte layers does this well, and this was the strategy applied to achieve the silica coatings on the Au nanorods shown in Figure 2. Once the Au nanorod surface is modified with a polyelectrolyte coating, the nanorods can be coated using a modification of the Stöber method [54]. The polyelectrolyte layer also provides good nanorod dispersibility in isopropanol, as needed for the Stöber-based silica coating method. Rubpy was found to increase the silica deposition rate, and the silica shells were about a factor of two thicker when Rubpy was present than when it was not added during the silica deposition step. The coating recipe described in the experimental section produces 20 nm thick shells, but thicker SiO2 shells were also possible with subsequent addition of TEOS/isopropyl alcohol solution after coating with a first layer of silica; for example, 40 nm thick shells were obtained by adding 0.1 mL of TEOS/isopropyl alcohol solution 3 hours after the first TEOS/isopropyl alcohol solution was added.
The as-synthesized silica-coated nanoparticles disperse only in polar solvents. To render them hydrophobic, a hydrocarbon monolayer was adsorbed to the particle surface by exposure to OTMOS. OTMOS chemisorbs to the silica surface via the siloxane moiety to leave a C18 hydrocarbon brush layer exposed on the particle surface. Figure 2 shows TEM images of OTMOS surface-modified Rubpy-doped silica-coated nanoparticles. This data indicates that the silica surface can be easily modified with siloxyl terminated ligands, thus providing a platform for various surface functionalities, including biological molecules [55,56].
3.2 Optical properties
The FePt@SiO2(Rubpy), Fe2O3@SiO2(Rubpy) and Aunr@SiO2(Rubpy) nanoparticles all fluoresce, indicating that the dye is indeed incorporated in the silica shell. Figure 3 shows examples of dispersions of these nanoparticles under room light and under excitation by a black light source. The emission is visible by the eye.
Fig. 3.

Photographs of FePt and Fe2O3 nanocrystals and Au nanorods coated with Rubpy-doped silica shells under (A) room light and (B) under a black lamp (λexc = 365 nm). All three different kinds of nanoparticles are fluorescent.
Figure 4 shows absorbance and PL emission spectra of the FePt@SiO2(Rubpy), Fe2O3@SiO2(Rubpy) and Aunr@SiO2(Rubpy) nanoparticles. Rubpy exhibits an absorption peak at 458 nm, which appears in all of the samples. The Aunr@SiO2(Rubpy) nanoparticles show two additional absorption peaks at 522 nm and 782 nm, which correspond to the transverse and longitudinal plasmon bands of the Au nanorods [52]. The red absorbance band of the Au nanorods has been of significant interest for in vivo medical optical imaging [58-63] because biological tissue is relatively transparent to light with these wavelengths [57].
Fig. 4.

Room temperature (A) absorbance and (B) PL emission spectra (λexc= 458 nm) of FePt@SiO2(Rubpy), Fe2O3@SiO2(Rubpy) and Aunr@SiO2(Rubpy) nanoparticles dispersed in water. Free Rubpy dissolved in water and silica spheres with Rubpy made in the absence of the core magnetic nanocrystals or Au nanorods (SiO2(Rubpy)) were also measured for comparison.
Rubpy emits 610 nm light and all of the Rubpy-doped silica coated nanoparticles emit light with a peak wavelength near 610 nm. The emission peaks of the FePt@SiO2(Rubpy), Fe2O3@SiO2(Rubpy) and Aunr@SiO2(Rubpy) nanoparticles are slightly blueshifted from the peak emission wavelength of Rubpy free in solution, as has been observed previously for Rubpy embedded in silica [35]. This data further confirms that Rubpy is embedded into the silica shell and is not free in solution or physisorbed on the particle surface.
Two additional tests were carried out to ensure that the emitting Rubpy was indeed embedded in the silica shell and was not free in solution or adsorbed to the particle surface. First, a control experiment was performed in which nanocrystals were coated with silica shells in the absence of Rubpy and were then dispersed in a solution of free Rubpy. This dispersion was washed following the standard procedures used here and there was no visible PL emission from these washed particles. This “wash test” indicated that Rubpy physisorption on the silica surface is weak and adsorbed dye molecules are easily removed during the purification procedure.
As another test, FePt@SiO2(Rubpy) nanoparticles were floated on a Langmuir Blodgett trough and then transferred using a polydimethylsiloxane (PDMS) stamp to either a glass substrate for fluorescence microscopy imaging or a silicon substrate for SEM imaging. Pre-patterned PDMS stamps containing micrometer-sized features were fabricated using previously published soft-lithography techniques [64]. Figure 5A shows an SEM image of 20 μm diameter stamped circular features with 5 micrometer spacing. Each of these disks is composed of a monolayer of FePt@SiO2(Rubpy) nanoparticles. The inset shows a high magnification SEM image of the nanoparticles within one of the circular features in Fig. 5A. The nanoparticles exhibit close-packed order in the stamped film layer. Figures 5B-5G show optical fluorescence microscopy imaging of FePt@SiO2(Rubpy) printed into various geometrical patterns, including square and circular features of various dimensions, spacing, and periodicities. The fluorescence images confirm that Rubpy embedded in the silica coating is emitting light. It is also worth noting that the patterned structures can be printed on any substrate, including plastics, glass and metals using any of the multifunctional nanoparticles described here. This makes it possible to envision potential schemes for bioassays, dual mode imaging, and even micrometer-size optical and electronic data storage using these kinds of features patterned with such nanomaterials with novel optical and magnetic response.
Fig. 5.

(A) SEM and (B-G) fluorescence microscopy images of FePt@SiO2(Rubpy) nanoparticles patterned using PDMS stamps. High resolution SEM imaging of the circular patterns of FePt@SiO2(rubpy) nanoparticles in (A) are shown in the inset, which reveal the individual particles.
The fluorescent dye fluorescein isothiocyanate (FITC) could also be embedded into the silica shells using similar coating strategies as developed for the Rubpy-doped silica shells. Figure 6 shows data for Fe2O3@SiO2(FITC) and Aunr@SiO2(FITC) nanoparticles. The TEM images show that both the iron oxide nanocrystals and the Au nanorods could be coated uniformly with the FITC-doped silica shells. The absorbance and PL spectra confirm FITC incorporation into the silica coatings, as the characteristic FITC absorption and emission peaks are present in the spectra in Figure 6. FITC incorporation in the silica-coated nanocrystals shows that the coating methods can be extended to other dyes with different emission wavelengths.
Fig. 6.

(A-C) Fe2O3@SiO2(FITC) and (D-F) Aunr@SiO2(FITC) nanoparticles: (A,D) TEM images, (B,E) absorbance spectra and (C,F) PL emission spectra (λexc = 492 nm). The absorbance peak at ~505 nm corresponds to the absorbance peak of FITC. The absorbance peak in (E) at ~730 nm corresponds to the longitudinal plasmon peak of the core Au nanorods. Note that there is also an absorption feature at ~520 nm, which is the transverse plasmon peak of the Au nanorods, which overlaps slightly with the FITC absorbance peak at ~505 nm. The emission peak at ~523 nm in (F) is the PL emission from the FITC dye [40].
3.3 Magnetic resonance imaging (MRI) properties of FePt@SiO2(Rubpy) and Fe2O3@SiO2(Rubpy) nanoparticles
The magnetic/fluorescent heterostructure nanoparticles synthesized here might be used as dual-mode contrast agents for magnetic resonance and optical fluorescence imaging. For MRI, there are two important materials-dependent parameters, the longitudinal and transverse spin relaxation times, T1 and T2 [65,66]. These parameters were measured for the FePt@SiO2(Rubpy) and Fe2O3@SiO2(Rubpy) nanoparticles in water at room temperature.
Both FePt@SiO2(Rubpy) and Fe2O3@SiO2(Rubpy) nanoparticles exhibited T1(meas) values nearly identical to the values measured for pure water (T1(H2O) =1759 msec), as expected for superparamagnetic nanoparticles in this size range at high field [67,68]. T2 on the other hand exhibited increased relaxation due to the nanoparticles. Figure 7 shows plotted as a function of dispersed Fe concentration for the FePt@SiO2(Rubpy) and Fe2O3@SiO2(Rubpy) nanoparticles. The T2 relaxivity, r2, indicates how strongly the paramagnet influences the proton spin relaxation of the surrounding water and is determined from the concentration dependence of R2 [66,67,69]:
Fig. 7.
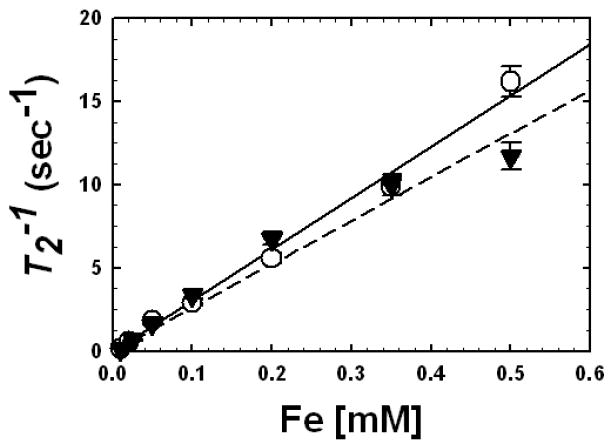
T2 relaxivities measured as a function of Fe concentration in water dispersions of (○) FePt@SiO2(Rubpy) or (▼) Fe2O3@SiO2(Rubpy) nanoparticles [66]. The core diameters and silica shell thicknesses were 6.6 and 7.9 nm for FePt@SiO2(Rubpy) and 6.5 and 6.4 nm for the Fe2O3@SiO2(Rubpy) nanoparticles. From Eqn (1), linear fits ((—), FePt@SiO2(Rubpy) and (- - -), Fe2O3@SiO2(Rubpy)) were used to determine r2: 30.7 mM-1s-1for FePt@SiO2(Rubpy) and 26.1 mM-1s-1for Fe2O3@SiO2(Rubpy).
| (1) |
Linear fits to the data in Figure 7 give values of r2 = 30.7 ± 2.0 mM−1s−1 for FePt@SiO2(Rubpy) and r2 = 26.1 ± 1.6 mM−1s−1 for Fe2O3@SiO2(Rubpy). These r2 values are similar to those of ultrasmall superparamagnetic iron oxide particles (44.1 mM-1s-1 [70]), and slightly lower than commercially available superparamagnetic iron oxide (SPIO) MRI contrast agents (70~150 mM-1s-1 [71]) and other water-soluble iron oxide (WSIO) nanocrystals with diameters between 6 and 9 nm studied in the literature (82.0–116.0 mM-1s-1 [21,30,72]). However, r2 scales approximately as the inverse of the separation distance between the paramagnet surface (i.e., the magnetic nanocrystal core) and the water protons [73], and thinner shells would enhance r2 and bring it within the neighborhood of new manganese ferrite nanoparticles of MnFe2O4 [21,74], and bimagnetic FePt-iron oxide [75] nanoparticles that have recently been the subject of interest as new high T2 contrast agents for MRI.
Magnetization measurements were performed on the FePt@SiO2(Rubpy) and Fe2O3@SiO2(Rubpy) nanoparticles to gain some insight into the difference in r2 values measured for the two different types of nanoparticles. Figure 8 shows room temperature field sweeps of the magnetization of FePt@SiO2(Rubpy) and Fe2O3@SiO2(Rubpy) nanoparticles. Both nanoparticles are superparamagnetic and behave like paragmagnets at room temperature. At room temperature, the magnetization on a per Fe atom basis of the iron oxide cores is 1.2 times higher than the FePt cores (Figure 8). But r2 for the FePt@SiO2(Rubpy) nanoparticles was slightly higher than r2 for the Fe2O3@SiO2(Rubpy) nanoparticles, despite the fact that the FePt@SiO2(Rubpy) nanoparticles also had slightly thicker silica shells (7.9 nm vs. 6.4 nm).
Fig. 8.

Magnetization of (○) FePt@SiO2(Rubpy) and (▼) Fe2O3@SiO2(Rubpy) nanoparticles: (A) measured at room temperature at different applied magnetic fields and (B) measured under a applied field of 3 T as a function of temperature cooled under the applied field (i.e., field-cooled conditions). The magnetization at 3 T of Fe2O3@SiO2(Rubpy) and FePt@SiO2(Rubpy) at room temperature are 0.24 μB/Fe atom (1347 μB/particle) and 0.20 μB/Fe atom (785 μB/particle), respectively.
The reason for the difference in r2 between these materials requires further study. But apart from the difference in room temperature saturation magnetization, there is also a very significant qualitative difference in the magnetic properties of the Fe2O3@SiO2(Rubpy) and FePt@SiO2(Rubpy) nanoparticles. The FePt nanocrystals exhibit two distinct magnetic behaviors in the field sweeps in Figure 8A: at low field (<~0.1 T), the material exhibits a high susceptibility similar to that the Fe2O3 nanoparticles, but at high fields (>~0.1 T), the magnetization does not saturate (even at fields greater than 5 T) and the magnetization exhibits a low susceptibility. The two distinct magnetic behaviors could indicate two distinctly different material regions within the FePt nanoparticle (Fe-rich and Pt-rich regions or FexOx and Pt-rich regions), similar to what has been observed in annealed or partially annealed FePt nanocrystals [47,76,77]. The possibility of an Fe-rich and Pt-rich region within the FePt core could result from the particle growth process, in which a Pt nanocrystal is first formed, followed by heterogeneous Fe deposition and subsequent Fe-Pt alloying during the particle growth process [25,50,78]. An Fe-rich shell surrounding a Pt-rich core could increase the local magnetic field gradient at the surface of the FePt@SiO2 nanoparticles, increasing the proton dephasing rate and causing a higher r2 [65,79]. Because the SQUID measurements correspond to the volume average of the nanoparticles, they are not sensitive to the local field gradients at the surface of the particle. The lower bulk magnetization of the FePt on a per Fe basis compared to that of Fe2O3 at 3T may be compensated by the spatial configuration of the crystal to produce larger field gradients in the surrounding water molecules.
The magnetization of the iron oxide particles saturates at fields of less than 1 T. The temperature dependence of the magnetization is also qualitatively different for the two materials. Field-cooled and zero field-cooled (FC and ZFC) magnetization measured under an applied field of 3T overlapped for both materials, confirming that the particles are superparamagnets. A blocking temperature of 5 K was measured for the FePt@SiO2(Rubpy) and the blocking temperature of the Fe2O3@SiO2(Rubpy) nanoparticles was less than 5K and was not determined. The magnetization of the FePt core particles exhibits a much stronger temperature dependence than the Fe2O3 core particles, and once the temperature drops below ~280K, the FePt magnetization overtakes the magnetization of the iron oxide particles. This phenomenon may also relate to the r2 properties of the materials, but requires further study.
3.4 Magnetic separations
Figure 9 shows 3 mg of FePt@SiO2(Rubpy) nanoparticles magnetically separated in an aqueous dispersion using a SmCo magnet. The response to the external magnetic field indicates that the nanoparticles might be suitable for targeted drug delivery using magnetic fields [80]. Additionally, the nanoparticles redisperse after removing the magnetic field, which could be advantageous for inexpensive purification procedures, such as protein separations and water treatments that would enable the materials to be recycled [81,82]. For example, Fe3O4 nanocrystals have been shown to be good absorbers of arsenic from contaminated water [83] and these fluorescent/magnetic nanoparticles might be used for such a purpose.
Fig. 9.
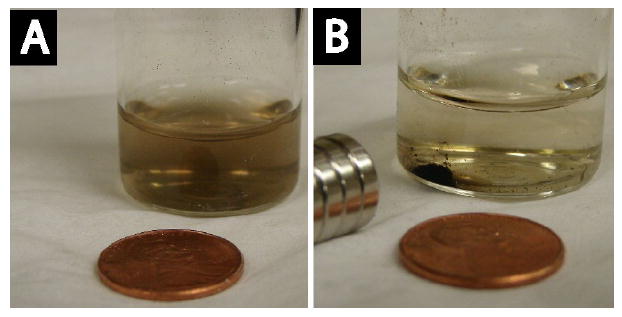
Photographs of dilute aqueous dispersions of FePt@SiO2(Rubpy) nanoparticles (A) before and (B) after exposure to a SmCo magnet. The magnet pulls the colloidal nanoparticles to the side of the vial. The separation occurs in less than 4 hours.
Conclusion
The data presented here show that various nanocrystals and nanorods can be conformally coated with fluorescent dye-doped silica. Silica is a useful material for biological applications in particular because it provides a biocompatible host for the dye molecules, which has been shown to aid in the photostability of the dye, and also serves as a convenient surface for bioconjugation. However, this study also shows that significantly different silica coating chemistry can be required for nanoparticles depending on their initial surface coatings. In some cases, like the CTAB-coated Au nanorods, the nanocrystals must be “primed” for silica deposition. Nonetheless, despite these challenges, multifunctional nanoparticles can be designed and synthesized with the addition of dye-doped silica. Specifically, the FePt@SiO2(Rubpy) and Fe2O3@SiO2(Rubpy) nanoparticles synthesized in this study might serve as dual-mode imaging contrast agents that are suitable for fluorescence and magnetic resonance imaging. Preliminary proton relaxivity measurements confirm that these materials are indeed suitable for MRI imaging. Further studies, however, are required to understand the details of how the relaxivity relates to the magnetic properties of the core nanocrystals and the silica shell thickness.
Footnotes
Publisher's Disclaimer: This is a PDF file of an unedited manuscript that has been accepted for publication. As a service to our customers we are providing this early version of the manuscript. The manuscript will undergo copyediting, typesetting, and review of the resulting proof before it is published in its final citable form. Please note that during the production process errors may be discovered which could affect the content, and all legal disclaimers that apply to the journal pertain.
References
- 1.Duguet E, Vasseur S, Mornet S, Devoisselle JM. Nanomed. 2006;1:157–168. doi: 10.2217/17435889.1.2.157. [DOI] [PubMed] [Google Scholar]
- 2.Jaiswal JK, Goldman ER, Mattoussi H, Simon SM. Nat Methods. 2004;1:73–78. doi: 10.1038/nmeth1004-73. [DOI] [PubMed] [Google Scholar]
- 3.Michalet X, Pinaud FF, Bentolila LA, Tsay JM, Doose S, Li JJ, Sundaresan G, Wu AM, Gambhir SS, Weiss S. Science. 2005;307:538–544. doi: 10.1126/science.1104274. [DOI] [PMC free article] [PubMed] [Google Scholar]
- 4.Winter JO, Liu TY, Korgel BA, Schmidt CE. Adv Mater. 2001;13:1673–1677. [Google Scholar]
- 5.Dubertret B, Skourides P, Norris DJ, Noireaux V, Brivanlou AH, Libchaber A. Science. 2002;298:1759–1762. doi: 10.1126/science.1077194. [DOI] [PubMed] [Google Scholar]
- 6.Chu TC, Shieh F, Lavery LA, Levy M, Richards-Kortum R, Korgel BA, Ellington AD. Biosens Bioelectron. 2006;21:1859–1866. doi: 10.1016/j.bios.2005.12.015. [DOI] [PubMed] [Google Scholar]
- 7.Alivisatos P. Nat Biotechnol. 2004;22:47–52. doi: 10.1038/nbt927. [DOI] [PubMed] [Google Scholar]
- 8.Xing Y, Chaudry Q, Shen C, Kong KY, Zhau HE, Wchung L, Petros JA, O’Regan RM, Yezhelyev MV, Simons JW, Wang MD, Nie S. Nat Protocols. 2007;2:1152–1165. doi: 10.1038/nprot.2007.107. [DOI] [PubMed] [Google Scholar]
- 9.Fu AH, Gu WW, Boussert B, Koski K, Gerion D, Manna L, Le Gros M, Larabell CA, Alivisatos AP. Nano Lett. 2007;7:179–182. doi: 10.1021/nl0626434. [DOI] [PMC free article] [PubMed] [Google Scholar]
- 10.Hu S-H, Liu T-Y, Huang H-Y, Liu D-M, Chen S-Y. Langmuir. 2008;24:239–244. doi: 10.1021/la701570z. [DOI] [PubMed] [Google Scholar]
- 11.Smith DK, Rasch MR, Korgel BA. Nanomed. 2007;2:943–949. doi: 10.2217/17435889.2.6.943. [DOI] [PubMed] [Google Scholar]
- 12.Ji XJ, Shao RP, Elliott AM, Stafford RJ, Esparza-Coss E, Bankson JA, Liang G, Luo ZP, Park K, Markert JT, Li C. J Phys Chem C. 2007;111:6245–6251. doi: 10.1021/jp0702245. [DOI] [PMC free article] [PubMed] [Google Scholar]
- 13.Gobin AM, Lee MH, Halas NJ, James WD, Drezek RA, West JL. Nano Lett. 2007;7:1929–1934. doi: 10.1021/nl070610y. [DOI] [PubMed] [Google Scholar]
- 14.Sokolov K, Nida D, Descour M, Lacy M, Levy A, Hall B, Dharmawardhane S, Ellington A, Korgel B, Richards-Kortum R. Adv Cancer Res. 2007;96:299–344. doi: 10.1016/S0065-230X(06)96011-4. [DOI] [PubMed] [Google Scholar]
- 15.Huh YM, Jun YW, Song HT, Kim S, Choi JS, Lee JH, Yoon S, Kim KS, Shin JS, Suh JS, Cheon J. J Am Chem Soc. 2005;127:12387–12391. doi: 10.1021/ja052337c. [DOI] [PubMed] [Google Scholar]
- 16.Jun YW, Huh YM, Choi JS, Lee JH, Song HT, Kim S, Yoon S, Kim KS, Shin JS, Suh JS, Cheon J. J Am Chem Soc. 2005;127:5732–5733. doi: 10.1021/ja0422155. [DOI] [PubMed] [Google Scholar]
- 17.Bulte JWM, Kraitchman DL. NMR Biomed. 2004;17:484–499. doi: 10.1002/nbm.924. [DOI] [PubMed] [Google Scholar]
- 18.Qin J, Laurent S, Jo YS, Roch A, Mikhaylova M, Bhujwalla ZM, Muller RN, Muhammed M. Adv Mater. 2007;19:1874–1878. [Google Scholar]
- 19.Song HT, Choi JS, Huh YM, Kim S, Jun YW, Suh JS, Cheon J. J Am Chem Soc. 2005;127:9992–9993. doi: 10.1021/ja051833y. [DOI] [PubMed] [Google Scholar]
- 20.Hu FQ, Wei L, Zhou Z, Ran YL, Li Z, Gao MY. Adv Mater. 2006;18:2553–2556. [Google Scholar]
- 21.Lee JH, Huh YM, Jun Y, Seo J, Jang J, Song HT, Kim S, Cho EJ, Yoon HG, Suh JS, Cheon J. Nat Med. 2007;13:95–99. doi: 10.1038/nm1467. [DOI] [PubMed] [Google Scholar]
- 22.Santra S, Yang HS, Holloway PH, Stanley JT, Mericle RA. J Am Chem Soc. 2005;127:1656–1657. doi: 10.1021/ja0464140. [DOI] [PubMed] [Google Scholar]
- 23.Quarta A, Di Corato R, Manna L, Ragusa A, Pellegrino T. IEEE T Nanobiosci. 2007;6:298–308. doi: 10.1109/tnb.2007.908989. [DOI] [PubMed] [Google Scholar]
- 24.Lin YS, Wu SH, Hung Y, Chou YH, Chang C, Lin ML, Tsai CP, Mou CY. Chem Mater. 2006;18:5170–5172. [Google Scholar]
- 25.Lee DC, Smith DK, Heitsch AT, Korgel BA. Annu Rep Prog Chem Sect C Phys Chem. 2007;103:351–402. [Google Scholar]
- 26.Choi JS, Jun YW, Yeon SI, Kim HC, Shin JS, Cheon J. J Am Chem Soc. 2006;128:15982–15983. doi: 10.1021/ja066547g. [DOI] [PubMed] [Google Scholar]
- 27.Zhang LH, Liu BF, Dong SJ. J Phys Chem B. 2007;111:10448–10452. doi: 10.1021/jp0734427. [DOI] [PubMed] [Google Scholar]
- 28.Lu CW, Hung Y, Hsiao JK, Yao M, Chung TH, Lin YS, Wu SH, Hsu SC, Liu HM, Mou CY, Yang CS, Huang DM, Chen YC. Nano Lett. 2007;7:149–154. doi: 10.1021/nl0624263. [DOI] [PubMed] [Google Scholar]
- 29.Kim JS, Rieter WJ, Taylor KML, An H, Lin WL, Lin WB. J Am Chem Soc. 2007;129:8962–8963. doi: 10.1021/ja073062z. [DOI] [PMC free article] [PubMed] [Google Scholar]
- 30.Lee JH, Jun YW, Yeon SI, Shin JS, Cheon J. Angew Chem Int Ed. 2006;45:8160–8162. doi: 10.1002/anie.200603052. [DOI] [PubMed] [Google Scholar]
- 31.Wang L, O’Donoghue MB, Tan WH. Nanomed. 2006;1:413–426. doi: 10.2217/17435889.1.4.413. [DOI] [PubMed] [Google Scholar]
- 32.Yan JL, Estevez MC, Smith JE, Wang KM, He XX, Wang L, Tan WH. Nano Today. 2007;2:44–50. [Google Scholar]
- 33.Santra S, Tapec R, Theodoropoulou N, Dobson J, Hebard A, Tan WH. Langmuir. 2001;17:2900–2906. [Google Scholar]
- 34.Santra S, Wang KM, Tapec R, Tan WH. J Biomed Optics. 2001;6:160–166. doi: 10.1117/1.1353590. [DOI] [PubMed] [Google Scholar]
- 35.Bagwe RP, Yang CY, Hilliard LR, Tan WH. Langmuir. 2004;20:8336–8342. doi: 10.1021/la049137j. [DOI] [PubMed] [Google Scholar]
- 36.Yao G, Wang L, Wu YR, Smith J, Xu JS, Zhao WJ, Lee EJ, Tan WH. Anal Bioanal Chem. 2006;385:518–524. doi: 10.1007/s00216-006-0452-z. [DOI] [PubMed] [Google Scholar]
- 37.Bottini M, Cerignoli F, Mills DM, D’Annibale F, Leone M, Rosato N, Magrini A, Pellecchia M, Bergamaschi A, Mustelin T. J Am Chem Soc. 2007;129:7814–7823. doi: 10.1021/ja070245c. [DOI] [PMC free article] [PubMed] [Google Scholar]
- 38.Ow H, Larson DR, Srivastava M, Baird BA, Webb WW, Wiesner U. Nano Lett. 2005;5:113–117. doi: 10.1021/nl0482478. [DOI] [PubMed] [Google Scholar]
- 39.Zhao XJ, Bagwe RP, Tan WH. Adv Mater. 2004;16:173–176. [Google Scholar]
- 40.Wang L, Tan WH. Nano Lett. 2006;6:84–88. doi: 10.1021/nl052105b. [DOI] [PMC free article] [PubMed] [Google Scholar]
- 41.Chen XL, Zou JL, Zhao TT, Li ZB. J Fluores. 2007;17:235–241. doi: 10.1007/s10895-007-0162-8. [DOI] [PubMed] [Google Scholar]
- 42.Bagwe RP, Hilliard LR, Tan WH. Langmuir. 2006;22:4357–4362. doi: 10.1021/la052797j. [DOI] [PMC free article] [PubMed] [Google Scholar]
- 43.Zhao XJ, Hilliard LR, Mechery SJ, Wang YP, Bagwe RP, Jin SG, Tan WH. Proc Natl Acad Sci U S A. 2004;101:15027–15032. doi: 10.1073/pnas.0404806101. [DOI] [PMC free article] [PubMed] [Google Scholar]
- 44.Zhao XJ, Tapec-Dytioco R, Tan WH. J Am Chem Soc. 2003;125:11474–11475. doi: 10.1021/ja0358854. [DOI] [PubMed] [Google Scholar]
- 45.Santra S, Zhang P, Wang KM, Tapec R, Tan WH. Anal Chem. 2001;73:4988–4993. doi: 10.1021/ac010406+. [DOI] [PubMed] [Google Scholar]
- 46.Deng T, Li JS, Jiang JH, Shen GL, Yu RQ. Adv Funct Mater. 2006;16:2147–2155. [Google Scholar]
- 47.Lee DC, Mikulec FV, Pelaez JM, Koo B, Korgel BA. J Phys Chem B. 2006;110:11160–11166. doi: 10.1021/jp060974z. [DOI] [PubMed] [Google Scholar]
- 48.Pastoriza-Santos I, Perez-Juste J, Liz-Marzan LM. Chem Mater. 2006;18:2465–2467. [Google Scholar]
- 49.Yi DK, Lee SS, Papaefthymiou GC, Ying JY. Chem Mater. 2006;18:614–619. [Google Scholar]
- 50.Chen M, Liu JP, Sun SH. J Am Chem Soc. 2004;126:8394–8395. doi: 10.1021/ja047648m. [DOI] [PubMed] [Google Scholar]
- 51.Hyeon T, Lee SS, Park J, Chung Y, Bin Na H. J Am Chem Soc. 2001;123:12798–12801. doi: 10.1021/ja016812s. [DOI] [PubMed] [Google Scholar]
- 52.Smith DK, Korgel BA. Langmuir. 2008;24:644–649. doi: 10.1021/la703625a. [DOI] [PubMed] [Google Scholar]
- 53.Tago T, Hatsuta T, Miyajima K, Kishida M, Tashiro S, Wakabayashi K. J Am Ceram Soc. 2002;85:2188–2194. [Google Scholar]
- 54.Stober W, Fink A, Bohn E. J Colloid Interface Sci. 1968;26:62–69. [Google Scholar]
- 55.Gupta AK, Naregalkar RR, Vaidya VD, Gupta M. Nanomed. 2007;2:23–39. doi: 10.2217/17435889.2.1.23. [DOI] [PubMed] [Google Scholar]
- 56.Arruebo M, Fernandez-Pacheco R, Velasco B, Marquina C, Arbiol J, Irusta S, Ibarra MR, Santamaria J. Adv Funct Mater. 2007;17:1473–1479. [Google Scholar]
- 57.Lim YT, Kim S, Nakayama A, Stott NE, Bawendi MG, Frangioni JV. Mol Imaging. 2003;2:50–64. doi: 10.1162/15353500200302163. [DOI] [PubMed] [Google Scholar]
- 58.Wang HF, Huff TB, Zweifel DA, He W, Low PS, Wei A, Cheng JX. Proc Natl Acad Sci U S A. 2005;102:15752–15756. doi: 10.1073/pnas.0504892102. [DOI] [PMC free article] [PubMed] [Google Scholar]
- 59.Durr NJ, Larson T, Smith DK, Korgel BA, Sokolov K, Ben-Yakar A. Nano Lett. 2007;7:941–945. doi: 10.1021/nl062962v. [DOI] [PMC free article] [PubMed] [Google Scholar]
- 60.Yu CX, Nakshatri H, Irudayaraj J. Nano Lett. 2007;7:2300–2306. doi: 10.1021/nl070894m. [DOI] [PubMed] [Google Scholar]
- 61.Ding H, Yong KT, Roy I, Pudavar HE, Law WC, Bergey EJ, Prasad PN. J Phys Chem C. 2007;111:12552–12557. [Google Scholar]
- 62.Huang XH, El-Sayed IH, Qian W, El-Sayed MA. J Am Chem Soc. 2006;128:2115–2120. doi: 10.1021/ja057254a. [DOI] [PubMed] [Google Scholar]
- 63.Huang XH, El-Sayed IH, Qian W, El-Sayed MA. Nano Lett. 2007;7:1591–1597. doi: 10.1021/nl070472c. [DOI] [PubMed] [Google Scholar]
- 64.Yang H, Deschatelets P, Brittain ST, Whitesides GM. Adv Mater. 2001;13:54–58. [Google Scholar]
- 65.Kuperman V. MRI: Physical Principles and Applications. Academic Press; Chicago, Illinois: 2000. [Google Scholar]
- 66.T1 and T2 are reported in reference to the solvent values, T1,2(H2O)−1, where T1,2(means) are the measured values: T1,2−1 = T1,2(meas)−1 – T1,2(H2O)−1
- 67.Koenig SH, Kellar KE. Magn Reson Med. 1995;34:227–233. doi: 10.1002/mrm.1910340214. [DOI] [PubMed] [Google Scholar]
- 68.Koenig SH. Invest Radiol. 1998;33:822–827. doi: 10.1097/00004424-199811000-00005. [DOI] [PubMed] [Google Scholar]
- 69.Bloembergen N, Purcell EM, Pound RV. Current Contents. 1977:7. [Google Scholar]
- 70.Weissleder R, Elizondo G, Wittenberg J, Rabito CA, Bengele HH, Josephson L. Radiology. 1990;175:489–493. doi: 10.1148/radiology.175.2.2326474. [DOI] [PubMed] [Google Scholar]
- 71.Wang YXJ, Hussain SM, Krestin GP. Eur Radiol. 2001;11:2319–2331. doi: 10.1007/s003300100908. [DOI] [PubMed] [Google Scholar]
- 72.Wan J, Cai W, Meng X, Liu E. Chem Comm. 2007:5004–5006. doi: 10.1039/b712795b. [DOI] [PubMed] [Google Scholar]
- 73.Koenig SH, Schillin We. J Biol Chem. 1969;244:6520–6526. [PubMed] [Google Scholar]
- 74.Tromsdorf UI, Bigall NC, Kaul MG, Bruns OT, Nikolic MS, Mollwitz B, Sperling RA, Reimer R, Hohenberg H, Parak WJ, Forster S, Beisiegel U, Adam G, Weller H. Nano Lett. 2007;7:2422–2427. doi: 10.1021/nl071099b. [DOI] [PubMed] [Google Scholar]
- 75.Figuerola A, Fiore A, Di Corato R, Falqui A, Giannini C, Micotti E, Lascialfari A, Corti M, Cingolani R, Pellegrino T, Cozzoli PD, Manna L. J Am Chem Soc. 2008;130:1477–1487. doi: 10.1021/ja078034v. [DOI] [PubMed] [Google Scholar]
- 76.Zeng H, Li J, Liu JP, Wang ZL, Sun SH. Nature. 2002;420:395–398. doi: 10.1038/nature01208. [DOI] [PubMed] [Google Scholar]
- 77.Yamamoto S, Morimoto Y, Tamada Y, Takahashi YK, Hono K, Ono T, Takano M. Chem Mater. 2006;18:5385–5388. [Google Scholar]
- 78.Chen M, Kim J, Liu JP, Fan HY, Sun SH. J Am Chem Soc. 2006;128:7132–7133. doi: 10.1021/ja061704x. [DOI] [PubMed] [Google Scholar]
- 79.Bushong S. Magnetic Resonance Imaging: Physical and Biological Principles. The C.V. Mosby Company: St. Louis; 1988. [Google Scholar]
- 80.Alexiou C, Jurgons R, Schmid RJ, Bergemann C, Henke J, Erhardt W, Huenges E, Parak F. J Drug Targeting. 2003;11:139–149. doi: 10.1080/1061186031000150791. [DOI] [PubMed] [Google Scholar]
- 81.Bao J, Chen W, Liu TT, Zhu YL, Jin PY, Wang LY, Liu JF, Wei YG, Li YD. Acs Nano. 2007;1:293–298. doi: 10.1021/nn700189h. [DOI] [PubMed] [Google Scholar]
- 82.Yantasee W, Warner CL, Sangvanich T, Addleman RS, Carter TG, Wiacek RJ, Fryxell GE, Timchalk C, Warner MG. Environmental Science & Technology. 2007;41:5114–5119. doi: 10.1021/es0705238. [DOI] [PubMed] [Google Scholar]
- 83.Yavuz CT, Mayo JT, Yu WW, Prakash A, Falkner JC, Yean S, Cong LL, Shipley HJ, Kan A, Tomson M, Natelson D, Colvin VL. Science. 2006;314:964–967. doi: 10.1126/science.1131475. [DOI] [PubMed] [Google Scholar]