Abstract
Objective
The aim of this study was to assess quantitatively structural changes in myelin content occurring during demyelination and remyelination by magnetization transfer imaging (MTI).
Materials and methods
In a reversible model of demyelination with no axonal loss, mice intoxicated by cuprizone were studied by MTI in vivo at 9.4 T. MRI data were compared to histopathological examinations.
Results
Data revealed that the magnetization transfer ratio (MTR) decreased significantly during demyelination and increased during remyelination with strong correlation to the myelin content (r = 0.79, P = 0.01).
Conclusions
This study demonstrated that MTR is a sensitive and reproducible quantitative marker to assess myelin loss and repair. This may lead to in vivo monitoring of the-rapeutic strategies promoting remyelination.
Keywords: Demyelination, Remyelination, Cuprizone, Magnetization transfer imaging, Magnetization transfer ratio, Histology
Introduction
Demyelinating diseases of the central nervous system (CNS) are a heterogeneous group of disorders characterized by the primary destruction of the myelin sheaths [1]. However, other tissue elements are involved, with axonal injury being a regular feature of demyelinating lesions. Multiple sclerosis (MS) is the most common demyelinating disease of the CNS affecting young people and leading to progressive permanent disability [1]. Remyelination has been shown to occur especially in the early phase of the disease and many therapeutic strategies to promote and enhance this repair mechanism are under investigation [2]. Promotion of remyelination is a central therapeutic goal since it may improve neurological functions, enhance axonal survival, and thereby prevent disease progression. Therefore, sensitive, specific, non-invasive imaging markers for monitoring remyelination in vivo are of paramount importance.
To date, there is no standard MRI marker for remyelination, although recent quantitative techniques such as magnetization transfer imaging (MTI) have shownhigher specificity in defining myelin pathology [3,4]. MTI is based on the specific interaction between macromolecular bound protons and water protons. The quantitative magnetization transfer ratio (MTR) has been used to investigate the degree of CNS tissue destruction in humans and animal models [5,6]. MTR decline, as characterized in multiple sclerosis lesions [7], may be caused by a reduction in the integrity of the macromolecular matrix, reflecting damage to the myelin or the axonal membrane, or by dilution of the macromolecules by inflammatory edema. In a recent myelin lesion model induced in the rat brain by local injection of LPC (α-lysophosphatidyl-choline stearoyl), the MTR changes were correlated with demyelination/remyelination and axonal loss [3]. To differentiate between these two processes and to validate precisely the MTR as in vivo marker of demyelination and remyelination, we proposed to study the cuprizone mouse model, documented to allow consistent induction and reversal demyelination of the corpus callosum [8] with limited inflammation and no axonal loss, by magnetization transfer imaging and to compare in vivo MTI data by histological examinations.
Materials and methods
Animals and cuprizone administration
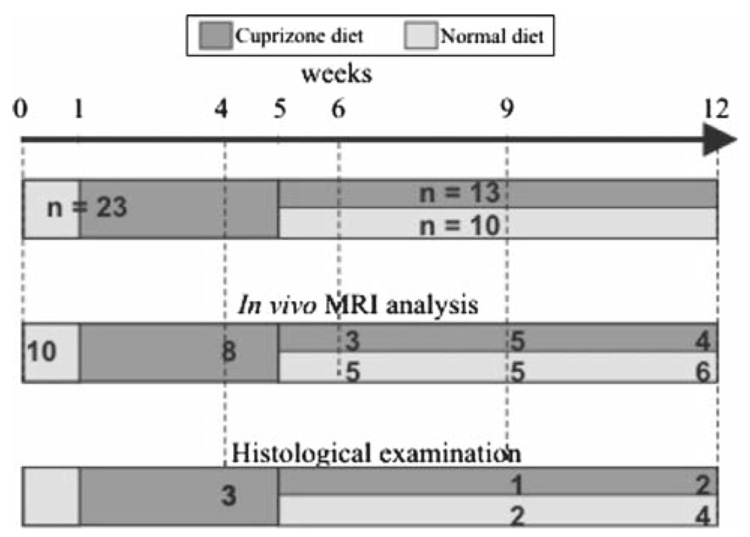
All experiments were performed in accordance with the European guidelines for the care and the use of laboratory animals. Twenty-seven, 8-week-old C57BL/6 mice were used for the study. Mice were maintained in a pathogen-free facility on a regular day/night cycle (+22°C, 55% humidity). Four mice were maintained on a normal diet for all the duration of the experiments and served as healthy controls for the histopathological examinations. Twenty-three mice were placed on a diet of 0.2% (w/w) cuprizone (bis-cyclohexanone-oxalydihydrazone) which was available ad libitum. The cuprizone diet was maintained for 4 (n = 7), 9 (n = 2), or 12 (n = 4) weeks. To examine spontaneous remyelination after the removal of cuprizone, ten mice under-going 5 weeks of cuprizone intoxication were returned to a normal diet for 4 (n = 4) or 7 (n = 6) weeks. The experimental procedure is illustrated in Fig. 1. To allow longitudinal study, 18 mice were measured repeatedly by MRI: 14 at two different time points, 2 at 3 different time points and 2 at 4 different time points. Twelve treated mice and 4 healthy mice were used for the correlation analysis of MR and histology.
Fig. 1.
Representation of the experimental procedure indicating the number of mice used for the cuprizone intoxication that were studied by MRI and histology. Note that four healthy mice, not included in this diagram, were scanned by MRI and studied by histology
MRI measurements
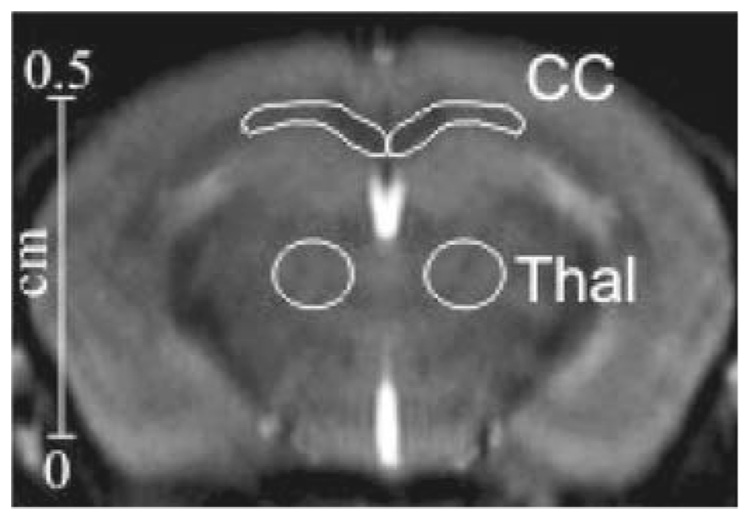
Mice were examined by magnetization transfer imaging (MTI) at baseline, 4, 6, 9 and 12 weeks. Each mouse was anesthetized by inhalation of 1.5% isoflurane–oxygen (flow rate 1.0–1.5 l/min) via a facemask. Respiration was monitored by a signal derived from a pressure transducer fixed to the animal’s chest. Body temperature was maintained during scanning by covering the mouse with a cotton-wool blanket and circulating warm air in the magnet bore. All MR studies were performed on a 9.4-T vertical system (Bruker, Wissembourg, France) using a mouse-head coil (birdcage, transmit/receive: 24 mm in diameter). The acquisition parameters were a RARE (rapid acquisition with relaxation enhancement) [9] sequence with TR = 6,000 ms, TE = 6.2 ms, matrix 192 × 192, field of view 18 × 18 mm, rare factor 64, coronal slice thickness 1 mm and 32 acquisitions reaching an in plane spatial resolution of 94 µm × 94 µm. To induce a selective saturation of the macromolecular bound protons, we implemented at the beginning of the RARE sequence a saturation pulse constituting by a set of 10,515 RF pulses of 513 µs with 10 µs gap. This saturation pulse delay of 5,500ms was considered as sufficient to reach the steady state [10]. To determine the best amplitude B1 and offset frequency Δ of the saturation pulse, we evaluated a set of five values of B1 (0.5, 1.5, 3, 5 and 10 µT) combined to five values of Δ (1.5, 3, 5, 7 and 10 kHz) for four healthy mice. The reference sequence was obtained with the same parameters but without application of the saturation pulse. The magnetization transfer ratio (MTR) was calculated according to the following equation [11]: MTR = (1−MS/MO)×100, where MS is the magnitude of signal under MT saturation and MO is the magnitude of signal without MT saturation in selected region of interests (ROI) within corpus callosum and thalamus (using as reference) as shown in Fig. 2. These data were compared to the histological results.
Fig. 2.
Coronal image of the mouse brain showing the selected ROIs within the corpus callosum (CC) and the thalamus (Thal) where MTR were measured
Histology
Mice were sacrificed for histopathology analyses after the MR session at week 0 (n = 1 healthy control), week 4 (n = 3 mice under cuprizone intoxication +1 healthy control), week 9 (n = 1 mouse under cuprizone +2 mice returning to a normal diet +1 healthy control), week 12 (n = 2 mice under cuprizone +4 mice returning to a normal diet +1 healthy control). Animals were perfused under general anesthesia with phosphate-buffered saline (PBS) followed by 4% paraformaldehyde in PBS. Brains were removed, immersed for 1 h in the same fixative buffer and cut with a vibratome. Sections of 30µm were stained with luxol fast blue (LFB) solution for myelin detection. Thin sections (1 µm) were cut, stained with alkaline toluidine blue and examined by light microscopy. Toluidine blue was used as a qualitative indicator for the state of the myelin sheath. Successive sections were studied by immunohistochemistry using monoclonal antibody (mAb) α myelin basic protein (MBP) (1:300, Chemicon, France), marker for myelin; mAb anti-glial fibrillary acidic protein (GFAP), marker for astrocytes (1:300, Sigma, France); primary antibody against nonphosphorylated neurofilament (SMI-32; 1:100, Sigma, France), marker for axonal damage and mAb anti-phosphorylated and nonphosphorylated neurofilament 200 (NF; 1/200, Sigma, France), marker for axonal loss.
Quantitative assessment of myelin content
All analytic studies were realized with an image analysis system NIS elements running on a PC computer coupled to a photomicroscope (Nikon90i, France). To evaluate the amount of myelin, astrogliosis and axonal integrity, optical density was measured on sections staining with mAbs MBP, GFAP, NF and SMI-32 in the corresponding MTR ROI in corpus callosum. For GFAP, MBP and SMI-32, results were expressed as percentage of immunoreactivity compared to the reference value of 100% (0% for SMI-32, marker of axonal damage) corresponding to the immunoreactivity measured in healthy mice.
Statistical analysis
For each group, the mean percentage of MTR in corpus callosum and thalamus, the mean percentage of immunoreactivity for GFAP, MBP and SMI-32 and standard error of the means were calculated. Groups were initially compared using ANOVA at one factor. The histological data of the myelin contents were correlated with the MTR profile using Statview® software. Significance of relationship between MTR values and percentage of immunoreactivity were analyzed using Pearson’s correlation test.
Results
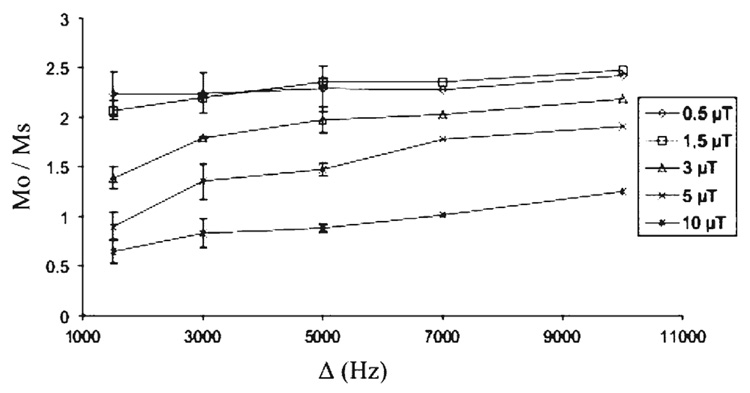
The Mo/Ms measurements, within the corpus callosum of healthy mice, resulting from combinations of B1 and Δ are illustrated in Fig. 3. The higher values of the ratio were reached for B1 of 1.5µT and Δ of 5–10 kHz. Therefore, the optimized MT parameters of B1 = 1.5 µT and Δ = 5 kHz were used to perform all the MTI study.
Fig. 3.
Evolution of the ratio Mo/Ms within the corpus callosum of healthy mice for five values of amplitude B1 (0.5, 1.5, 3, 5 and 10 µT) combined to five values of offset frequency Δ (1.5, 3, 5, 7 and 10 kHz) of the saturation pulse. MO and MS are the magnitude of signal without and with MT saturation. Note that the higher Mo/Ms values are reached for B1 of 1.5 µT and Δ of 5–10kHz
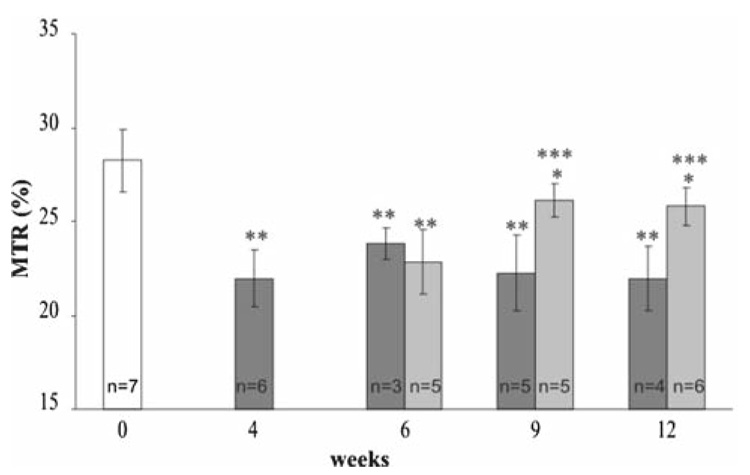
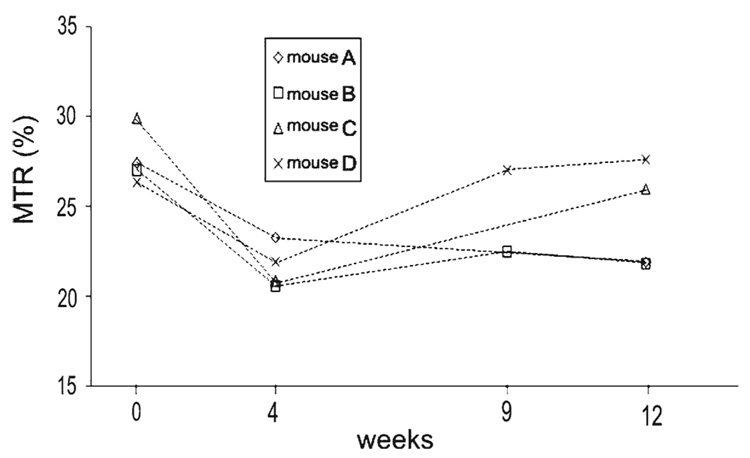
As illustrated in Fig. 4, the magnetization transfer ratio (MTR) measured within the corpus callosum decreased significantly (P < 1%) after 4weeks of cuprizone intoxication and remained stable for mice that stayed under intoxication. For mice that underwent 5 weeks of cuprizone intoxication before returning to a normal diet, the MTR increased and reached at weeks 9 and 12 a value close to the baseline value. To assess longitudinal evolution of the MTR, data from four mice followed at weeks 0, 4, 9 and 12 are presented in Fig. 5. The MTR values decreased significantly (between 15 and 30% of decrease) between weeks 0 and 4. Two mice (A and B) that stayed under cuprizone intoxication had a constant MTR value between weeks 4 and 12. Others mice (C and D) that underwent 5weeks of cuprizone intoxication before returning to a normal diet showed an increase of MTR at weeks 9 and 12. These results are illustrated in the MT images (Fig. 6) where we can easily detect the variation of MT contrast within the corpus callosum of the same mouse followed before (week 0), during (week 4) and after (week 12) cuprizone intoxication. MTR values measured within the thalamus for all mice did not show any significant change between the different time points of the study.
Fig. 4.
Evolution of the MTR (mean ± SD) within the corpus callosum for mice before cuprizone intoxication (week 0), mice under cuprizone intoxication (dark grey bars) and mice who underwent 5weeks of cuprizone intoxication and returned to a normal diet (light grey bars) for 1 (week 6), 4 (week 9) or 7 (week 12) weeks. MTR values significantly different from the one at week 0 are represented by ** (P < 1%) and * (P < 5%). MTR values significantly different from the one at week 4 are represented by *** (P < 1%). Note that the MTR value decreased during cuprizone intoxication and increased when mice returned to a normal diet
Fig. 5.
Evolution of the MTR within the corpus callosum from four mice followed at weeks 0, 4, 9 and 12. Note that the MTR values decreased significantly between weeks 0 and 4 for all mice that were under cuprizone intoxication. At week 5, “mouse C” and “mouse D” returned to a normal diet. Note that for these mice, the MTR increased significantly
Fig. 6.
Representation of three MT contrast images of the same mouse followed at week 0 (before intoxication), week 4 (4weeks of cuprizone intoxication) and week 12 (5 weeks of cuprizone intoxication followed by a return to normal diet). Note the variation of contrast occurring within the corpus callosum of this mouse between these three time points
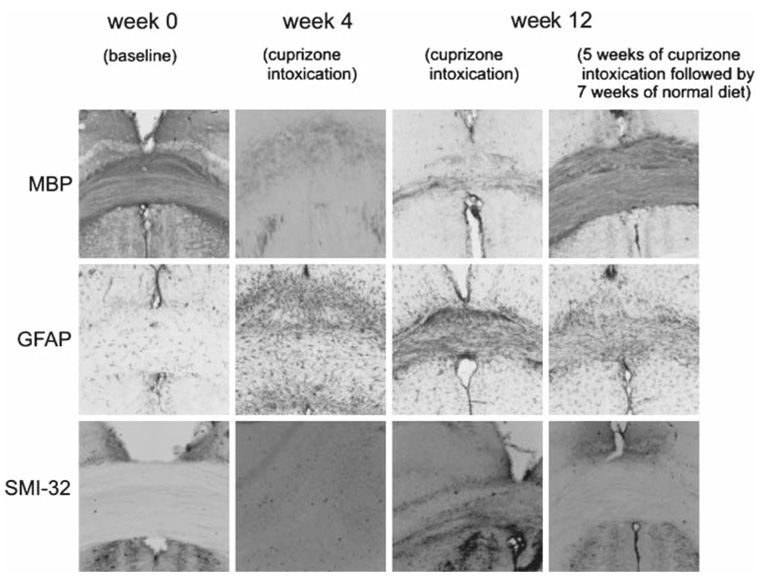
Histological examinations indicated that cuprizone intoxication induced loss of myelin within the corpus callosum as illustrated in Fig. 7 where the immunohistochemical staining against MBP, marker for myelin, decreased after 4 or 12 weeks of intoxication. Under cuprizone intoxication, myelin content (mean = 68 ± 4%) did not change significantly between weeks 4 and 12. At week 12, mice that returned to a normal diet had an increased staining against MBP compared to week 4, meaning that a remyelination was occurring (mean myelin content = 95 ± 3%). The GFAP immunoreactivity, marker for astrogliosis, absent at week 0, increased during the cuprizone intoxication and decreased after return to normal diet. SMI-32 immunoreactivity detecting axonal damage (black spots) appeared slightly after 12 weeks of cuprizone intoxication. Using the NF marker, no axonal loss was detected in this study.
Fig. 7.
Representative images of MBP, GFAP and SMI-32 immunoreactivities within the corpus callosum. Note that the intense MBP immunoreactivity presented at week 0 (baseline) decreased during the cuprizone intoxication (demyelination) and recovered after return to normal diet (remyelination). In parallel, the GFAP immunoreactivity, absent at week 0, increased during the cuprizone intoxication and decreased after return to normal diet. SMI-32 immunoreactivity detecting axonal damage (black spots) appeared at 12 weeks of cuprizone diet. Using the NF marker, no axonal loss was detected in this study
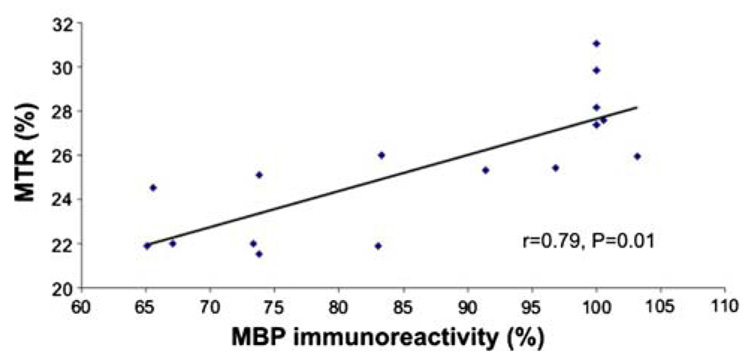
The relationship between the MTR values and the percentage of MBP immunoreactivity was significant (r = 0.79, P = 0.01) as indicated in Fig. 8. There was also a negative correlation between the MTR values and the percentage of GFAP immunoreactivity (r = −0.82, P = 0.001). No correlation between MTR values and SMI-32 was found (r = −0.45, P = 0.08).
Fig. 8.
Scatter plot of MTR and percentage of GFAP immunoreactivity indicating the distribution of the points and the positive correlation between those variables
Discussion
In the present study, optimization of the magnetization transfer imaging (MTI) technique at 9.4 T was performed. This allowed us to determine the MT parameters offering the better MT contrast. Therefore, we were able to evaluate in vivo and with a relatively high spatial resolution (94 µm × 94 µm) reversible and reproducible processes of demyelination and remyelination. MTR, decreasing during demyelination and increasing during remyelination, was found to be a very sensitive marker of the myelin content changes. Since the measured myelin content did not change during 4 and 12 weeks of cuprizone treatment, we could speculate that the important difference between “normal/remyelinated” and “demyelinated” caused the strong correlation between MTR and MBP (marker of myelin). The cuprizone mouse model of demyelination and remyelination was modulated by a proliferation of astrocytes when myelin was altered. The negative correlation between GFAP, marker of astrocytes, and MTR reflected a supposed constant and indirect relationship. Although the presence of GFAP influenced the MTR, the relation between MTR and myelin content appeared to stay linear. Our hypothesis is that without a proliferation of astrocytes, MTR would have been more reduced in demyelinated areas.
Remyelination has been shown to occur especially in the early phase of demyelinating diseases like in multiple sclerosis [2]. However, conventional MRI suffering from lack of specificity, this process could not be differentiating from others hallmarks of diseases like inflammation, demyelination, gliosis, edema and axonal loss. By taking advantage of the cuprizone mouse model known to induce reversible and selective demyelination in the absence of blood–brain barrier damage, T cell induced inflammation and axonal loss [8, 12, 13], we confirmed in our study that MTI is a reliable quantitative technique detecting demyelination and remyelination.
A recent study conducted on postmortem human tissues [14] demonstrated that MTR was affected by myelin content. However, based on in vivo longitudinal evaluations, our results clearly show that MTR detects reversible process of demyelination with high sensitivity and reproducibility. These data allowed validating MTR as a reliable in vivo marker of myelination processes.
These results are in good agreement with data from diffusion tensor imaging (DTI) technique conducted in the same animal model in vitro [15] and in vivo [16]. DTI is a quantitative MRI technique studying directional diffusivities of water molecules along and across axonal tracts like corpus callosum. These studies [15,16] found an increase radial diffusivity of water during demyelination and a decrease during remyelination. Therefore, radial diffusivity may be another marker of demyelination or remyelination. However, we believe that our approach conducting at higher magnetic field offers better sensitivity and reproducibility in assessing myelin content changes within the white matter (WM). However, as the cuprizone model induced selective demyelination of WM [8], we should study another model to assess demyelination and remyelination that occur within gray matter and represent important features in multiple sclerosis [17].
Conclusions
This study demonstrates clearly that the MTR is a sensitive quantitative marker to assess myelin content changes occurring in vivo during demyelination and remyelination. These results are of importance to lead in vivo monitoring of therapeutic strategies promoting remyelination.
Acknowledgments
This study was supported by ARSEP, ARMA, CNRS, programme Imagerie du Petit Animal and Région Aquitaine.
Contributor Information
Wafaa Zaaraoui, Résonance Magnétique des Systèmes Biologiques, UMR5536 CNRS/Université Victor Segalen Bordeaux 2, 146 rue Léo Saignat Case 93, 33076 Bordeaux Cedex, France, e-mail: wzaaraoui@hotmail.com.
Mathilde Deloire, Laboratoire de Neurobiologie des Affections de la Myéline, EA 2966, Université Victor Segalen Bordeaux 2, 146 rue Léo Saignat, 33076 Bordeaux Cedex, France.
Michel Merle, Résonance Magnétique des Systèmes Biologiques, UMR5536 CNRS/Université Victor Segalen Bordeaux 2, 146 rue Léo Saignat Case 93, 33076 Bordeaux Cedex, France.
Céline Girard, Laboratoire de Neurobiologie des Affections de la Myéline, EA 2966, Université Victor Segalen Bordeaux 2, 146 rue Léo Saignat, 33076 Bordeaux Cedex, France.
Gérard Raffard, Résonance Magnétique des Systèmes Biologiques, UMR5536 CNRS/Université Victor Segalen Bordeaux 2, 146 rue Léo Saignat Case 93, 33076 Bordeaux Cedex, France.
Marc Biran, Résonance Magnétique des Systèmes Biologiques, UMR5536 CNRS/Université Victor Segalen Bordeaux 2, 146 rue Léo Saignat Case 93, 33076 Bordeaux Cedex, France.
Matilde Inglese, Department of Radiology, New York University School of Medicine, 650 First Avenue, New York 10016, USA.
Klaus G. Petry, Laboratoire de Neurobiologie des Affections de la Myéline, EA 2966, Université Victor Segalen Bordeaux 2, 146 rue Léo Saignat, 33076 Bordeaux Cedex, France
Oded Gonen, Department of Radiology, New York University School of Medicine, 650 First Avenue, New York 10016, USA.
Bruno Brochet, Laboratoire de Neurobiologie des Affections de la Myéline, EA 2966, Université Victor Segalen Bordeaux 2, 146 rue Léo Saignat, 33076 Bordeaux Cedex, France.
Jean-Michel Franconi, Résonance Magnétique des Systèmes Biologiques, UMR5536 CNRS/Université Victor Segalen Bordeaux 2, 146 rue Léo Saignat Case 93, 33076 Bordeaux Cedex, France.
Vincent Dousset, Laboratoire de Neurobiologie des Affections de la Myéline, EA 2966, Université Victor Segalen Bordeaux 2, 146 rue Léo Saignat, 33076 Bordeaux Cedex, France.
References
- 1.Lassmann H. Classification of demyelinating diseases at the interface between etiology and pathogenesis. Curr Opin Neurol. 2001;14(3):253–258. doi: 10.1097/00019052-200106000-00001. [DOI] [PubMed] [Google Scholar]
- 2.Bruck W, Kuhlmann T, Stadelmann C. Remyelination in multiple sclerosis. J Neurol Sci. 2003;206(2):181–185. doi: 10.1016/s0022-510x(02)00191-0. [DOI] [PubMed] [Google Scholar]
- 3.Deloire-Grassin MS, Brochet B, Quesson B, Delalande C, Dousset V, Canioni P, Petry KG. In vivo evaluation of remyelination in rat brain by magnetization transfer imaging. J Neurol Sci. 2000;178(1):10–16. doi: 10.1016/s0022-510x(00)00331-2. [DOI] [PubMed] [Google Scholar]
- 4.Hickman SJ, Toosy AT, Jones SJ, Altmann DR, Miszkiel KA, MacManus DG, Barker GJ, Plant GT, Thompson AJ, Miller DH. Serial magnetization transfer imaging in acute optic neuritis. Brain. 2004;127(Pt 3):692–700. doi: 10.1093/brain/awh076. [DOI] [PubMed] [Google Scholar]
- 5.Gass A, Barker GJ, Kidd D, Thorpe JW, MacManus D, Brennan A, Tofts PS, Thompson AJ, McDonald WI, Miller DH. Correlation of magnetization transfer ratio with clinical disability in multiple sclerosis. Ann Neurol. 1994;36(1):62–67. doi: 10.1002/ana.410360113. [DOI] [PubMed] [Google Scholar]
- 6.Grossman RI. Magnetization tranfer in multiple sclerosis. Ann Neurol. 1994;36:S97–S99. doi: 10.1002/ana.410360722. [DOI] [PubMed] [Google Scholar]
- 7.Dousset V, Gayou A, Brochet B, Caille JM. Early structural changes in acute nascent MS lesions suggesting demyelination and remyelination assessed by in vivo serial quantitative magnetization transfer studies. Neurology. 1998;51:1150–1155. doi: 10.1212/wnl.51.4.1150. [DOI] [PubMed] [Google Scholar]
- 8.Matsushima GK, Morell P. The neurotoxicant, cuprizone, as a model to study demyelination and remyelination in the central nervous system. Brain Pathol. 2001;11(1):107–116. doi: 10.1111/j.1750-3639.2001.tb00385.x. [DOI] [PMC free article] [PubMed] [Google Scholar]
- 9.Hennig J, Nauerth A, Friedburg H. RARE imaging: a fast imaging method for clinical MR. Magn Reson Med. 1986;3(6):823–833. doi: 10.1002/mrm.1910030602. [DOI] [PubMed] [Google Scholar]
- 10.Henkelman RM, Stanisz GJ, Graham SJ. Magnetization transfer in MRI: a review. NMR Biomed. 2001;14(2):57–64. doi: 10.1002/nbm.683. [DOI] [PubMed] [Google Scholar]
- 11.Dousset V, Grossman RI, Ramer KN, Schnall MD, Young LH, Gonzalez-Scarano F, Lavi E, Cohen JA. Experimental allergic encephalomyelitis and multiple sclerosis: lesion characterization with magnetization transfer imaging. Radiology. 1992;182(2):483–491. doi: 10.1148/radiology.182.2.1732968. [DOI] [PubMed] [Google Scholar]
- 12.Merkler D, Boretius S, Stadelmann C, Ernsting T, Michaelis T, Frahm J, Bruck W. Multicontrast MRI of remyelination in the central nervous system. NMR Biomed. 2005;18(6):395–403. doi: 10.1002/nbm.972. [DOI] [PubMed] [Google Scholar]
- 13.Yu O, Steibel J, Mauss Y, Guignard B, Eclancher B, Chambron J, Grucker D. Remyelination assessment by MRI texture analysis in a cuprizone mouse model. Magn Reson Imaging. 2004;22(8):1139–1144. doi: 10.1016/j.mri.2004.08.017. [DOI] [PubMed] [Google Scholar]
- 14.Schmierer K, Scaravilli F, Altmann DR, Barker GJ, Miller DH. Magnetization transfer ratio and myelin in postmortem multiple sclerosis brain. Ann Neurol. 2004;56(3):407–415. doi: 10.1002/ana.20202. [DOI] [PubMed] [Google Scholar]
- 15.Song SK, Yoshino J, Le TQ, Lin SJ, Sun SW, Cross AH, Armstrong RC. Demyelination increases radial diffusivity in corpus callosum of mouse brain. Neuroimage. 2005;26(1):132–140. doi: 10.1016/j.neuroimage.2005.01.028. [DOI] [PubMed] [Google Scholar]
- 16.Sun SW, Liang HF, Trinkaus K, Cross AH, Armstrong RC, Song SK. Noninvasive detection of cuprizone induced axonal damage and demyelination in the mouse corpus callosum. Magn Reson Med. 2006;55(2):302–308. doi: 10.1002/mrm.20774. [DOI] [PubMed] [Google Scholar]
- 17.Kutzelnigg A, Lucchinetti CF, Stadelmann C, Bruck W, Rauschka H, Bergmann M, Schmidbauer M, Parisi JE, Lassmann H. Cortical demyelination and diffuse white matter injury in multiple sclerosis. Brain. 2005;128(Pt 11):2705–2712. doi: 10.1093/brain/awh641. [DOI] [PubMed] [Google Scholar]


