

Abstract
High‐resolution array comparative genomic hybridization of 235 serous epithelial ovarian cancers demonstrated a regional increase at 3q26.2 encompassing SnoN/SkiL, a coregulator of SMAD/TGFβ signaling. SnoN RNA transcripts were elevated in ∼80% of advanced stage serous epithelial ovarian cancers. In both immortalized normal (TIOSE) and ovarian carcinoma cell lines (OVCA), SnoN RNA levels were increased by TGFβ stimulation and altered by LY294002 and JNK II inhibitor treatment suggesting that the PI3K and JNK signaling pathways may regulate TGFβ‐induced increases in SnoN RNA. In TIOSE, SnoN protein levels were reduced 15min post TGFβ‐stimulation, likely by proteosome‐mediated degradation. In contrast, in OVCA, SnoN levels were elevated 3h post‐stimulation potentially as a result of inhibition of the proteosome. To elucidate the role of SnoN in ovarian tumorigenesis, we explored the effects of both increasing and decreasing SnoN levels. In both TIOSE and OVCA, SnoN siRNA decreased cell growth between 20 and 50% concurrent with increased p21 levels. In TIOSE, transient expression of SnoN repressed TGFβ induction of PAI‐1 promoters with little effect on the p21 promoter or resultant cell growth. In contrast to the effects of transient expression, stable expression of SnoN in TIOSE led to growth arrest through induction of senescence. Collectively, these results implicate SnoN levels in multiple roles during ovarian carcinogenesis: promoting cellular proliferation in ovarian cancer cells and as a positive mediator of cell cycle arrest and senescence in non‐transformed ovarian epithelial cells.
Keywords: SnoN/SkiL, Ovarian cancers, Senescence, Growth arrest, p21, 3q26.2 amplicon
1. Introduction
Regions of genomic aberrations frequently harbor important oncogenes and tumor suppressor genes. Amplification of chromosome 3q26 has consistently been found in tumors of the ovary (Eder et al., 2005; Sugita et al., 2000; Weichert et al., 2003), cervix (Sugita et al., 2000), esophagus (Imoto et al., 2001, 2003), breast (basal and BRCA1‐associated) (Weber‐Mangal et al., 2003; Wessels et al., 2002), lung (Sugita et al., 2000), head and neck (Riazimand et al., 2002), and prostate (Sattler et al., 1999, 2000). In ovarian cancers, we have demonstrated that the p110α catalytic subunit of PIK3CA (Shayesteh et al., 1999) and PKCι (Eder et al., 2005) are functionally deregulated by 3q26 copy number increase. Our recent studies indicate that EVI1 and MDS1/EVI1 located at 3q26.2 are also elevated in advanced stage serous epithelial ovarian cancers (Nanjundan et al., 2007). SnoN/SkiL (Imoto et al., 2001) and PKCι, which is located adjacent to SnoN, are located in a unique region of genomic amplification independent from those encompassing PIK3CA, EVI1, and MDS1/EVI1. In malignant cells, SnoN expression has been reported to be elevated not only due to gene amplification, but also as a result of increased transcription and protein stability (Buess et al., 2004, 2004, 2005, 2005, 2003, 2005, 2007).
SnoN is an important negative regulator of TGFβ signaling via its interaction with SMAD proteins (Liu et al., 2001; Stroschein et al., 1999). Elevated SnoN expression may contribute, in some cases, to the resistance of malignant cancer cells to TGFβ‐induced growth arrest (Edmiston et al., 2005). SnoN/SkiL can interact with SMAD2, SMAD3, and SMAD4 to prevent them from binding to transcriptional coactivators thus leading to repression of target genes and blockade of TGFβ‐induced growth arrest (Edmiston et al., 2005, 1999, 2001).
TGFβ mediates differential roles depending on the stage of tumorigenesis (Elliott and Blobe, 2005). During tumor initiation, TGFβ functions as a growth inhibitor increasing apoptosis. In contrast, during tumor progression, TGFβ increases epithelial mesenchymal transition (EMT) increasing invasiveness and metastatic potential leading to a worsened outcome. Although it is clear that TGFβ function is aberrant in ovarian cancer (Hurteau et al., 1994) and there are rare mutations in the TGFβ receptors and SMADs in ovarian cancer (Chen et al., 2001, 1999, 2000), the mechanisms underlying the aberrations in TGFβ function in ovarian cancer remain unclear. Recently, EVI1 as well as DACH1 have been shown to be upregulated in ovarian cancers where both gene products inhibited TGFβ signaling in immortalized normal ovarian epithelial cells. Further, a DACH1 dominant negative partially restored signaling in ovarian cancer cell lines resistant to TGFβ suggesting that these aberrantly expressed genes may be partially responsible for disrupting TGFβ signaling in ovarian cancer (Nanjundan et al., 2007; Sunde et al., 2006).
The role of SnoN/SkiL in tumorigenesis is complex. SnoN has been proposed to act as an oncoprotein since its expression is increased in many human tumor cell lines and overexpression results in transformation of fibroblasts (He et al., 2003; Zhu et al., 2005). However, contrasting reports have suggested that SnoN may also act as a tumor suppressor. Patients with stage D colorectal carcinomas had decreased expression of SnoN levels particularly in microsatellite unstable cancers perhaps due to a disrupted TGFβ signaling pathway (Chia et al., 2006). Studies in lung epithelial cells indicated that SnoN acts as a positive mediator of TGFβ‐induced transcription and cell cycle arrest (Sarker et al., 2005). Further, although SnoN expression is elevated in lung and breast cancer cell lines and promotes cellular proliferation, it inhibits epithelial‐to‐mesenchymal transition resulting in decreased metastatic potential in xenografts (Zhu et al., 2007). Moreover, heterozygous knockout SnoN mice display increased susceptibility to chemical‐induced tumorigenesis (Shinagawa et al., 2000, 2001). Thus, depending on the cell context and the activity of other intracellular signaling pathways, the activities of SnoN/SkiL may either promote transformation or tumor suppression while inhibiting malignant progression which may contribute to the well‐established dual effects of TGFβ in tumor development (Elliott and Blobe, 2005).
Herein, we demonstrate that SnoN is located at a frequent and localized point of genomic amplification at 3q26.2 in advanced stage serous epithelial ovarian cancers by high‐resolution array CGH using a bacterial artificial chromosome (BAC) contig encompassing the q arm of chromosome 3. Further, there is a marked and frequent accumulation of SnoN transcripts in ovarian cancer. Although transient expression of SnoN repressed both the PAI‐1 and CAGA promoters as well as the AP‐1 reporter in TAg/hTert immortalized normal ovarian epithelial T29 cells (TIOSE), there was little effect on the p21 promoter and cell growth. However, SnoN knockdown using siRNA in both TIOSE and OVCA indicated that SnoN increases cellular proliferation. In contrast, stable expression of SnoN in T29 cells induced growth arrest and senescence in several independent SnoN expressing clones. Thus, although SnoN levels are elevated in ovarian cancers likely contributing to tumor progression, SnoN functions to decrease tumorigenic properties in normal ovarian epithelial cells. Thus, SnoN may contribute to the pro‐ and anti‐tumorigenic properties of TGFβ during tumor initiation and progression.
2. Results
2.1. Increased SnoN DNA copy number in ovarian carcinomas
We have demonstrated that EVI1 (Nanjundan et al., 2007), the p110α catalytic subunit of phosphatidylinositol‐3‐kinase (PI3K), and PKCι (Eder et al., 2005; Shayesteh et al., 1999) are elevated at the mRNA and protein levels in association with the 3q26 copy number increase in ovarian cancer. It has been previously reported that SnoN, located adjacent to PKCι, may be a target for gene amplification at 3q26 in squamous‐cell carcinomas of the esophagus (Imoto et al., 2001) and further, SnoN mRNA was found to be increased and associated with a worsened prognosis in estrogen receptor‐positive breast carcinomas (Zhang et al., 2003) as well as increased in breast and lung cancer cell lines (Zhu et al., 2007). As indicated by a high‐density array CGH contig, amplifications and deletions on chromosome 3q varies dramatically between different patients with several occurring frequently (Figure 1A). The complex pattern of aberrations at 3q in different patients suggests that different genetic events may contribute to overall structure and selection of the 3q amplicon. Chromosome 3q26.2 exhibits multiple regional amplifications including a discrete amplicon encompassing Ch3: 171039661–171634577 (FLJ23259 to CLDN11) encompassing SnoN at Ch3: 171558210–171593226, PKCι at Ch3: 171422921–171503889 and a number of neighboring genes including GPCR150, and PHC3 as well as a discreet amplicon upstream of SnoN encompassing MDS1 at Ch3: 170349964–170864112 and EVI1 at Ch3: 170285244–170346787, which is frequently and highly amplified in ovarian cancer (Nanjundan et al., 2007). As indicated in Figure 1B, based on the BAC encompassing SnoN, the DNA copy number of SnoN was increased in approximately 60% of 235 serous epithelial advanced stage ovarian cancers with 35% showing a gain of at least one copy (Figure 1B).
Figure 1.
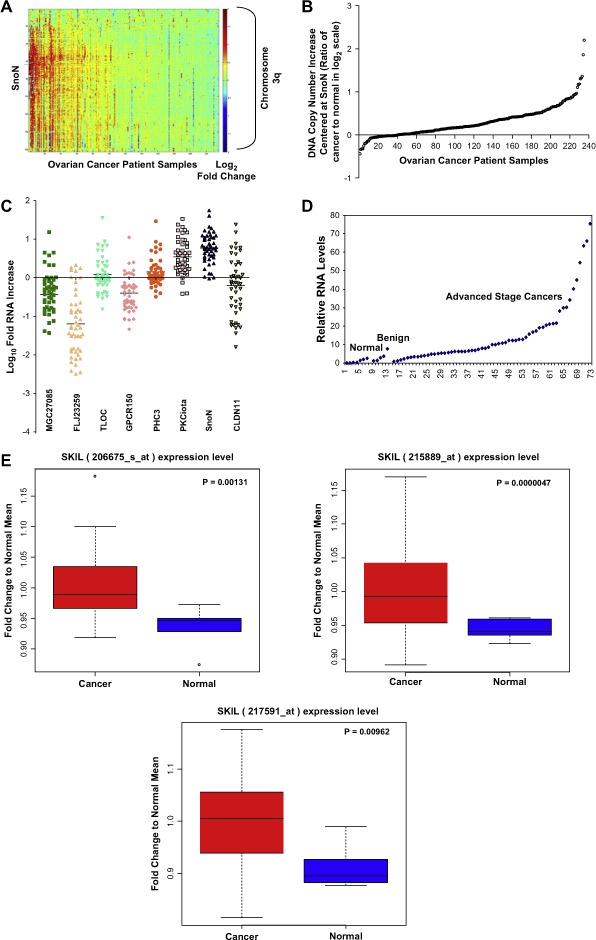
SnoN genomic copy number increase is associated with a selective accumulation of SnoN transcripts. A, Comparative genomic hybridization (CGH) analysis for 235 ovarian tumors using a contig encompassing 163 bacterial artificial chromosomes (BACs) probes on 3q is shown as a scaled image map. The patient samples are ordered with respect to decreasing SnoN copy number alterations from left to right. The BACs on chromosome 3q are ordered by position along the chromosome. The region on 3q from MGC27085 to CLDN11 (Ch3: 170993963–171634589) was one of the most frequently altered regions on 3q. A log2 value of 0.5 equals a gain of 1 copy. B, CGH analysis of DNA copy number increase centered at SnoN in 235 advanced stage serous epithelial ovarian cancers represented at log2 ratio of cancer patient DNA to normal DNA. C, RNA expression levels of genes surrounding SnoN along chromosome 3q, from MGC27085 to CLDN11, were assessed by quantitative polymerase chain reaction (qPCR) analysis in ovarian tissue samples. The results are displayed as fold‐alterations in RNA expression for normal ovarian epithelium, benign tumor samples, and advanced tumors (stage III and IV), compared to the average of the normal epithelium. MGC27085 and FLJ23259 are anonymous transcripts, TLOC is translocation protein 1, GPCR150 is G‐protein coupled receptor 150 (GPR160), and PHC3 is polyhomeotic‐like 3, PKCι is protein kinase C iota, SnoN is Ski‐like, and CLDN11 is claudin 11. D, The results from B are displayed as log10‐fold‐alterations in RNA expression for average of the normal and benign patient samples relative to advanced stage ovarian cancer patient samples. E, Transcriptional profiling of the UCSF ovarian dataset showing the elevated SnoN RNA expression with 3 probes and displayed as fold change to normal mean. Sixty‐nine patients were analyzed in the “cancer” group while 6 benign tumors were analyzed in the “normal” group. F, DNA to RNA concordance analysis for SnoN in ovarian patient samples. G Western analysis was performed across 3 stage I, 5 stage II, 26 stage III, and 10 stage IV serous epithelial ovarian cancer patients using SnoN rabbit polyclonal antibody and GAPDH as a loading control (top panel). Densitometric analysis was performed to normalize SnoN levels relative to GAPDH levels (bottom panel). NS refers to a non‐specific band detected with the SnoN polyclonal antibody.
Figure 1.
(continued).
Sequencing of exon 1, which contains the transformation and SMAD binding domain of SnoN (Liu et al., 2001) from genomic DNA in 48 serous epithelial advanced stage ovarian cancers, did not identify any mutations other than one documented SNP (A38V), which was present in all samples analyzed. The frequency of this polymorphism in normal or benign samples as well as the functional relevance of this conserved amino acid change is presently unknown. Nevertheless, amplification was not associated with mutations in the functional domain of SnoN.
2.2. Genomic amplification contributes to increased SnoN RNA transcripts in ovarian cancers
In order to assess whether the observed DNA copy number increase in SnoN is associated with increased transcript levels, transcripts from the 8 open reading frames in the region encompassed by MGC27085 to CLDN11 (Ch3: 170993963–171634589) were determined by quantitative polymerase chain reaction (qPCR) analysis. We found that SnoN was the most highly and frequently elevated transcript within this region followed by PKCι (Figure 1C). SnoN RNA levels were increased at least 3‐fold in >80% of serous epithelial ovarian cancers as compared to normal ovarian surface epithelial cells and benign tumors (Figure 1C,D). Another independent data set of 69 cancer patient samples compared to 5 benign patient samples (3 probes) confirmed the presence of increased SnoN levels in advanced stage ovarian cancers by transcriptional profiling (p‐value <0.05) (Figure 1E). Although there is generally a good correlation between altered DNA and RNA levels in SnoN, some samples show relatively high levels of mRNA in the absence of DNA copy number changes which could be a reflection of the status of the TGFβ signaling pathway. Furthermore, SnoN DNA and RNA levels demonstrated significant correlation suggesting that tumors with increased DNA copy number are likely to have increased SnoN transcripts (R 2=0.3955, p‐value=<0.01) (Figure 1F). However, in many cases SnoN mRNA is increased in the absence of increases at the DNA level and the level of increase in mRNA levels frequently exceed the magnitude of DNA increases. Thus, epigenetic modifications of SnoN presently unreported may play an important role in the regulation of its activity or expression during ovarian cancer progression.
Although the levels of SnoN protein expression appears to be present and elevated in stage II, III, and IV cancer patients (Figure 3G) compared to 3 stage I tumors, there is substantial variability in its level of expression across the different stages. Thus, SnoN expression and activity may vary during different stages of cancer progression. Of the 44 patient samples analyzed, 38 samples were high grade tumors and the remaining were low grade or low metastatic potential (LMP) tumors. However, there was no clear pattern in the expression of SnoN between these different tumor grades. Since SnoN could be regulated by proteosome‐mediated degradation, we evaluated the expression of phospho‐SMAD2/3 and Arkadia which are regulators of the TGFβ signaling pathway. Arkadia, an E3 ubiquitin ligase, induces the degradation of SnoN thus, allowing induction of transcription upon TGFβ stimulation (Levy et al., 2007; Nagano et al., 2007). However, the expression of both phospho‐SMAD2/3 as well as Arkadia by Western analysis were very low to undetectable across the ovarian cancer patients (stage I–IV); therefore, it remains unclear whether the known levels of regulation of SnoN in ovarian cancer correlates to its protein stability.
Figure 3.
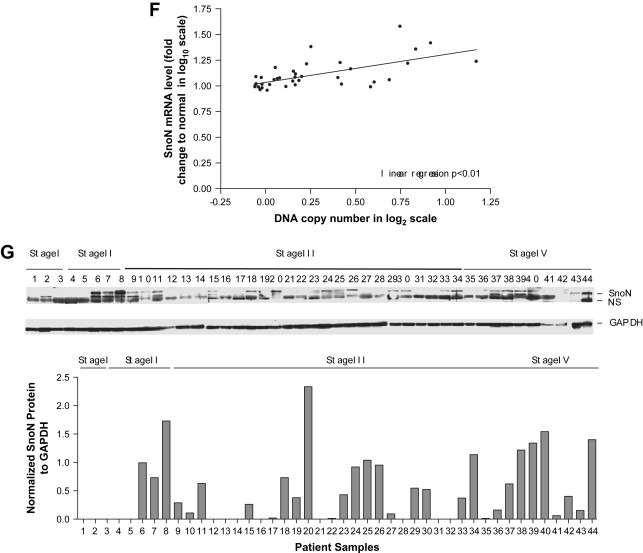
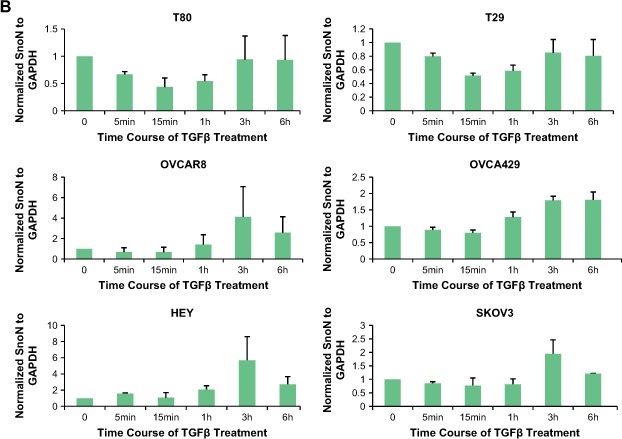
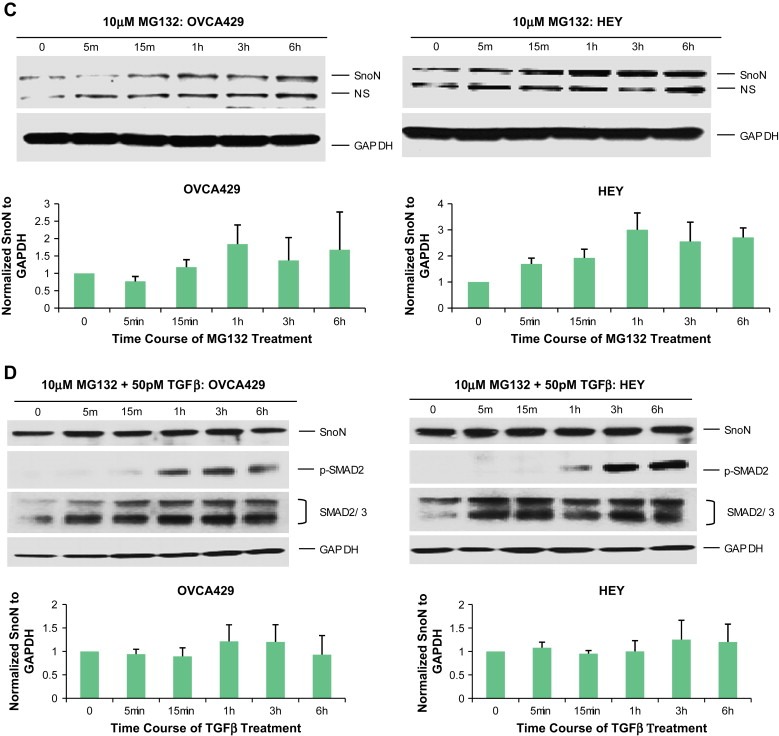
Effect of TGFβ and MG132 on SnoN expression levels in ovarian carcinoma cells. A. T80, T29, OVCAR8, HEY, and SKOV3 cells were treated with 50pM TGFβ from 5min to 6h followed by Western analysis to examine protein expression levels of SnoN, pSMAD2, and GAPDH as a loading control. The SnoN Western displays 2 bands where the lower band is likely a non‐specific band. B, Densitometric analyses (avg±std of 2 independent experiments) are presented of Figure 2A. C, HEY and OVCA429 cells were treated with MG132 from 5min to 6h followed by Western analysis to examine protein expression levels of SnoN and GAPDH as a loading control. Densitometric analyses (avg±std of 2 independent experiments) of these Westerns is also presented. D, HEY and OVCA429 cells were pretreated with MG132 (10μM) for 4h followed by 50pM TGFβ stimulation from 5min to 6h. Lysates were collected and Western analysis was performed to examine protein expression levels of SnoN using GAPDH as a loading control. Densitometric analyses (avg±std of 2 independent experiments) of these Westerns are also presented.
2.3. Transcriptional and post‐transcriptional regulation of SnoN in immortalized normal ovarian epithelial cells and cancer cell lines
SnoN levels are not only tightly transcriptionally regulated upon activation of the TGFβ signaling cascade where a marked increase in SnoN expression in both epithelial cells and fibroblasts results in termination of SMAD‐mediated transactivation (Zhu et al., 2005), but also further regulated by proteosome‐mediated degradation. In fibroblasts, within 30min following TGFβ stimulation, SnoN is rapidly degraded by the ubiquitin‐dependent proteosome via SMAD2/3‐dependent recruitment of ubiquitin ligase SMURF2 and CDH‐1 anaphase‐promoting ubiquitin ligase complex. Subsequent degradation by the proteosome removes SnoN‐mediated inhibition of the TGFβ signaling pathway thus, allowing activation of TGFβ target genes (Zhang et al., 2002; Zhu et al., 2005).
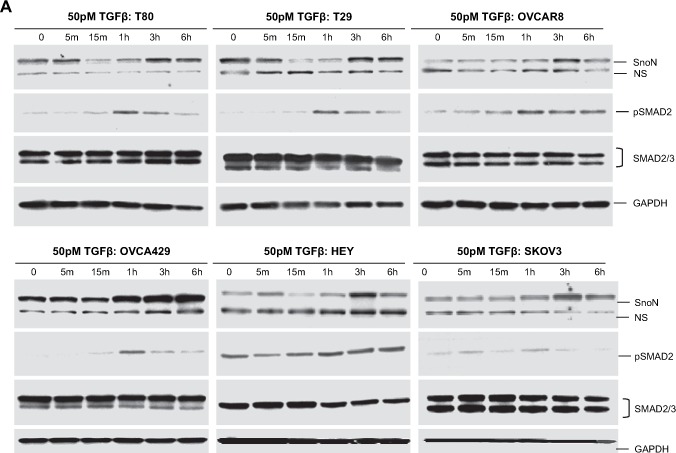
At the transcriptional level, SnoN levels are regulated both in TAg and hTert immortalized normal ovarian epithelial cells (T80 and T29) as well as ovarian cancer cell lines (SKOV3, OVCAR8, OVCA429, and HEY). Endogenous SnoN RNA levels are upregulated (as assessed by qPCR) following a 1h treatment with 50pM TGFβ ranging from 1.5‐fold to 5‐fold which was most markedly induced in immortalized normal ovarian epithelial cell (T29 and T80) and to a lesser degree in ovarian carcinoma cell lines (Figure 2A).
Figure 2.
Induction of SnoN RNA levels by TGFβ is controlled by multiple signaling pathways. A, Immortalized normal ovarian epithelial cells and ovarian carcinoma cells were treated for 1 h with 50 pM TGFβ. RNA was extracted and qPCR analysis was performed to assess SnoN expression. The results are presented as RNA‐fold increases. B, Effect of LY294002 and JNK II inhibitor on SnoN RNA levels. OVCA429, HEY, T29, and T80 cells were treated with 50 μM PI3K inhibitor or 25 μM JNK II inhibitor for 12 h. RNA was extracted and qPCR analysis was performed to assess SnoN expression. The results are presented as RNA‐fold increases.
Modulation of mRNA stability plays a central role in cellular homeostasis and many pathologies arise due to dysregulated mRNA stability including cancer which is controlled through a variety of RNA/protein interactions as well as modulation of signaling pathways that post‐translationally modify RNA binding proteins and other associated proteins. Some signaling pathways that alter these events include the PI3K/AKT, JNK, and MEK pathways. Strikingly, we further observed that basal SnoN RNA levels (0h, unstimulated/untreated cells) were regulated by signaling pathway inhibitors including the PI3K inhibitor (LY294002 at 50μM) where SnoN RNA levels were dramatically reduced by 50% (Figure 2B) and the JNK inhibitor (25μM) which induced a 2‐fold to 4‐fold increase (Figure 2C) in SnoN levels 12h post‐treatment in both ovarian carcinoma cell lines (including OVCA429 and HEY) and immortalized normal ovarian epithelial cells (T29 and T80). In addition, we have examined the MEK pathway using the U0126 inhibitor (25μM). However, its effect was not significant (data not presented) compared to the effects of the PI3K and JNK inhibitors. These results implicate positive and negative regulation by the PI3K and JNK pathway, respectively, which regulates basal SnoN RNA levels.
With respect to post‐transcriptional regulation of SnoN, there was a dramatic decrease in SnoN protein levels in immortalized normal ovarian epithelial cells (T29 and T80) between 15min and 1h post‐TGFβ stimulation returning to baseline levels by 3h. In contrast, we did not observe a similar marked decrease in SnoN protein levels in ovarian carcinoma cell lines (SKOV3, OVCA429, OVCAR8, and HEY) (Figure 3A,B) following TGFβ addition within 1h post‐stimulation. However, in ovarian cancer cells, TGFβ induced a dramatic increase in SnoN protein levels between 1 and 3h post‐stimulation potentially functioning as a feedback loop to constrain TGFβ signaling (Stroschein et al., 1999). In addition, both immortalized normal (T29 and T80) and ovarian carcinoma cells (SKOV3, HEY, OVCA429, and OVCAR8) are responsive to TGFβ since phospho‐SMAD2 levels were markedly elevated 1h post stimulation (Figure 3A).
Figure 3.
(continued).
Figure 3.
(continued).
The increase in SnoN levels 1–3h post‐TGFβ stimulation may be the result of inhibition of the proteosome. To determine whether the increases in SnoN levels in the cancer cell lines after TGFβ treatment was, indeed, due to proteosome inhibition, we pretreated ovarian cell lines (HEY and OVCA429) with MG132 for 4h prior to stimulation with TGFβ. We selected 4h treatment with MG132 (10μM) as it induced a marked increase in SnoN basal levels attaining a threshold level between 3 and 6h (Figure 3C). We treated these ovarian cancer cell lines with TGFβ (from 5min to 6h) following 4h pretreatment with MG132. In contrast to TGFβ treatment in the absence of MG132 (Figure 3A,B), we observed that TGFβ with MG132 pretreatment did not markedly alter SnoN expression (Figure 3D). Collectively, these results suggest that the resistance of ovarian carcinoma cell lines to TGFβ‐induced growth arrest (Baldwin et al., 2003) may be a result of the failure to degrade SnoN. Thus, SnoN protein levels are tightly linked to the activation status of the TGFβ signaling cascade in ovarian epithelial cells.
2.4. Knockdown of SnoN with siRNA confers a growth disadvantage
As indicated in the introduction, SnoN can act as an oncogene or tumor suppressor gene either promoting transformation or tumor suppression which may contribute to the well‐established dual effects of TGFβ in tumor development (Elliott and Blobe, 2005; Liu et al., 2001). To investigate the role of SnoN in ovarian tumorigenesis, we assessed the effect of decreasing SnoN levels by siRNA in both immortalized normal (TIOSE: T29 and T80) and ovarian carcinoma cell lines (OVCAR8, SKOV3, HEY, and OVCA429) using multiple siRNAs. P21 protein levels were increased by SnoN knockdown (Figure 4A). Concordantly, we found that SnoN knockdown conferred a consistent (20–50%) growth disadvantage in multiple ovarian cell lines (Figure 4B). Moreover, SnoN shRNA failed to give rise to any puromycin resistant colonies when expressed in HEY, SKOV3, and T80 cells providing additional support that knockdown of SnoN inhibits cell growth. In addition to altered p21 levels, we observed decreased plasminogen activator inhibitor‐1 (PAI‐1) protein with SnoN knockdown (Figure 4A). PAI‐1 has been reported to reduce cell migration and invasion in breast and gynecological cancer cells (Whitley et al., 2004). Further, SnoN has been proposed to decrease epithelial‐mesenchymal transition (EMT) and motility in breast and lung cancer cell lines (Zhu et al., 2007). Thus, we analyzed the ability of SnoN to regulate cellular motility of normal immortalized ovarian epithelial cells (T80, T29) as well as ovarian carcinoma cell lines (SKOV3 and HEY) using siRNA against SnoN. However, we did not observe any reproducible or consistent alteration in cellular migration by reducing SnoN levels using multiple sources of siRNA (results not shown). Collectively, these results indicate that knockdown of SnoN reduces the growth of both normal and carcinoma ovarian cell lines with no dramatic effect on cellular migration.
Figure 4.
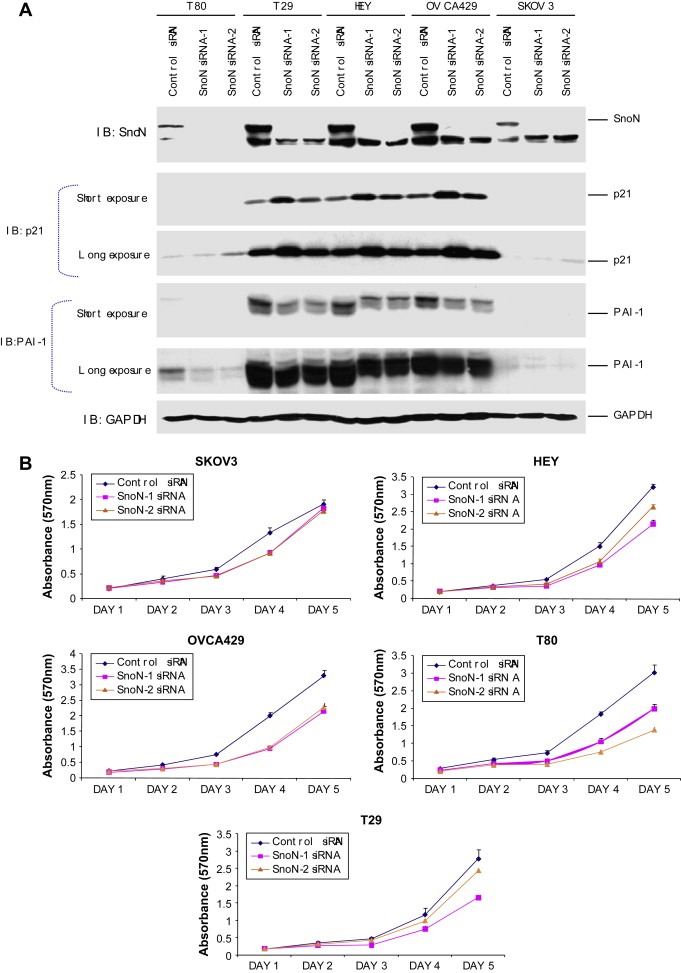
siRNA knockdown of SnoN alters normal immortalized ovarian epithelial and ovarian carcinoma cell migration. A, Following 48h post‐siRNA treatment of HEY, SKOV3, and TIOSE (T29) cells, protein was harvested and Western analysis was performed using antibodies against SnoN, p21, PAI‐1, and GAPDH as a loading control. B, Cell growth of the effect of knockdown of SnoN in immortalized normal ovarian epithelial cells lines and ovarian carcinoma cell lines was assessed by staining with crystal violet and measured at absorbance of 570nm.
2.5. Transient expression of SnoN represses TGFβ‐mediated transcriptional regulation of the PAI‐1 promoter in ovarian epithelial cells
To further assess the role of SnoN in ovarian tumorigenesis, we next examined the effect of increasing SnoN by transient expression in immortalized normal (T29) ovarian epithelial cells. Since SnoN has been implicated in blocking TGFβ‐mediated signaling by inhibiting SMAD‐induced gene transcription (Liu et al., 2001), we addressed whether SnoN could modulate the promoter activity of the commonly used TGFβ reporter plasminogen activator inhibitor (PAI‐1) promoters including p(CAGA)12‐Lux, a reporter construct containing 12 repeats of SMAD binding sequences from the PAI‐1 promoter, the PAI‐1 promoter itself, and the AP‐1 cis‐reporter, which is reported to function as both a positive and negative regulator in a variety of cellular conditions. In T29 cells, we observed that transient expression of SnoN markedly inhibited TGFβ‐mediated induction of PAI‐1 and CAGA reporters (Figure 5A,B) as well as AP‐1 (Figure 5C). Although it was reported that overexpression of wild type SnoN inhibited basal and TGFβ‐induced p21‐promoter activity in some cell lineages (Hsu et al., 2006), transient expression of SnoN did not significantly alter p21 promoter activity in non‐transformed ovarian epithelial cells (Figure 5D) or ovarian epithelial cell growth or migration. These results indicate that although SnoN, by itself, is insufficient to alter cellular function in ovarian epithelial cells by at least transient expression in normal immortalized ovarian epithelial cells, SnoN retains the ability to modulate TGFβ‐mediated transcription of PAI‐1 promoters. Further, the levels of SnoN that are present in ovarian epithelial cells and cancer cell lines are required for optimal cellular proliferation.
Figure 5.
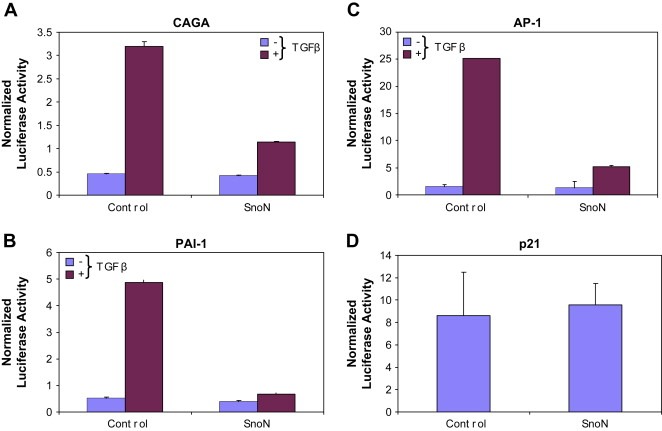
Transient expression of SnoN alters TGFβ‐mediated transcriptional regulation of PAI‐1 promoters, AP‐1 cis‐reporter in T29 cells. A, Nucleofector transfection was performed on TIOSE (T29) cells with SnoN (5μg) in combination with CAGA (A), PAI‐1 (B), AP‐1 (C), or p21 (D) (1μg) using Renilla luciferase to normalize (0.05μg). Cells were re‐seeded 6h post‐transfection, allowed to adhere for 6h, and serum starved/treated with 50pM TGFβ. The following day (24h post‐transfection), cells were harvested in passive lysis buffer and assessed for luciferase activity.
2.6. Long‐term expression of SnoN induces senescence in non‐transformed immortalized ovarian epithelial cells
To explore the consequences of stable SnoN overexpression in ovarian cancer cells on tumor initiation and progression, we attempted to establish T29 cell lines expressing SnoN at levels similar to those present in ovarian cancer cells. Surprisingly, SnoN expression conferred a distinct growth disadvantage to 3 independent SnoN expressing clones (F‐11, E‐9, and G‐11) (Figure 6A). The F‐11 clone which expressed the lowest levels of SnoN was used for subsequent detailed functional analysis although we observed similar results with the E‐9 and G‐11 SnoN clones (see Figure 6C for effects on colony formation in each clone). Both in proliferation and anchorage‐dependent colony forming assays (Figure 6B,C), SnoN expressing F‐11 cells exhibited a growth disadvantage when assessed in the presence of 10% FBS. Furthermore, we observed that many of the F‐11 cells had a flat morphology reminiscent of senescence (Figure 6D, top panel). SA‐β‐gal activity represents the gold standard for detection of oncogene‐induced senescence (Coates, 2002; Roninson, 2003). Indeed, staining with SA‐β‐gal demonstrated a high frequency of senescent cells in SnoN expressing F‐11 cells (Figure 6D, bottom panel). Western analysis showed increased p21 and PAI‐1 levels as well as elevated phospho‐ERK in SnoN stably expressing cells (Figure 6E). Although p21 is a principal p53 target gene (Efeyan et al., 2006) and a central component in a variety of p53‐mediated stress responses, its expression is likely mediated through p53‐independent mechanisms in T29 cells, which are immortalized with large T antigen which binds and inactivates p53. Strikingly, p‐AKT levels were reduced in SnoN expressing cells indicating that the cell survival pathway mediated through AKT is likely aberrant. Thus, multiple signaling pathways appear to be aberrant in SnoN expressing cells likely contributing to the observed growth arrest and senescence.
Figure 6.
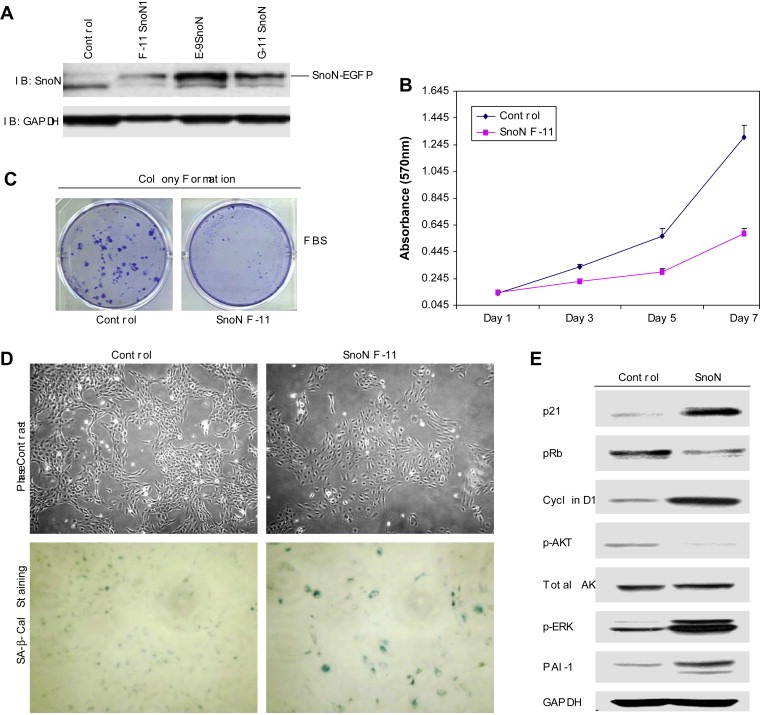
Stable overexpression of SnoN induces senescence by bypassing cellular immortalization in TAg/hTert immortalized ovarian TIOSE (T29) cells. A, Three SnoN cell lines (F‐11, E‐9, and G‐11) were assessed for SnoN‐EGFP expression by Western blotting using SnoN antibody and using GAPDH as a loading control. B, Effect of stable overexpression of SnoN‐EGFP (clone F‐11) in TIOSE cells on proliferation was performed in 10% FBS. Growth assay was performed in 96 well plates where cells were plated at 5000cells/well of 6 well plate and grown in 10% FBS. Cells were stained in crystal violet solution and solubilized with Sorenson's buffer and quantitated at absorbance of 570nm. Experiments were performed in triplicate. C, Stably expressing TIOSE SnoN and control cells were plated at 500cells/well of 6 well plate and grown in 10% FBS containing media for 2weeks. Cells were stained in Coomassie solution (30% methanol and 10% acetic acid containing 0.1% Coomassie Brilliant Blue). Experiments were performed in triplicate. D, A representative phase contrast image of control and F‐11 SnoN cells is shown as well as SA‐β‐gal staining as a marker of senescence. E, Western analysis of cell lysates immunoblotted for p21, pRB, cyclin D1, p‐AKT, total AKT, p‐ERK, PAI‐1 and GAPDH as a loading control.
2.7. SnoN increases p21 levels through PML in ovarian epithelial cells
We investigated the localization of SnoN EGFP‐fusion proteins in ovarian epithelial cells by transient expression of SnoN in T29 cells (Figure 7A). We found that SnoN is expressed exclusively in the nucleus in a distinct speckle‐like distribution (Figure 7B). In an effort to address the nature of the nuclear speckles, we coexpressed SnoN with PML (promyelocytic leukemia protein) which is a group of distinct nuclear subregions (Chelbi‐Alix et al., 1995). PML nuclear bodies are implicated in the regulation of transcription, apoptosis, senescence, and anti‐viral responses (Dellaire and Bazett‐Jones, 2004). PML is thought to regulate transcription, in part by mediating the assembly of complexes comprised of Ski (a related SnoN family member), Sin3, and N‐CoR/SMRT corepressors, together with histone deacetylases by which it may induce growth arrest, apoptosis, and senescence (Wilson et al., 2004). We found that SnoN localized to nuclear domains containing PML4 (Figure 7C). We also observed colocalization with other PML isoforms (PML1, 2, 3, and 5) but not to the same extent as with PML4. This observed colocalization with PML suggests a potential functional relationship between PML and SnoN through which PML may regulate the ability of SnoN to mediate growth arrest. We did not observe significant differences in PML protein levels between control (as assessed by Western analysis, Figure 8B) and SnoN expressing or SnoN siRNA treated cells.
Figure 7.
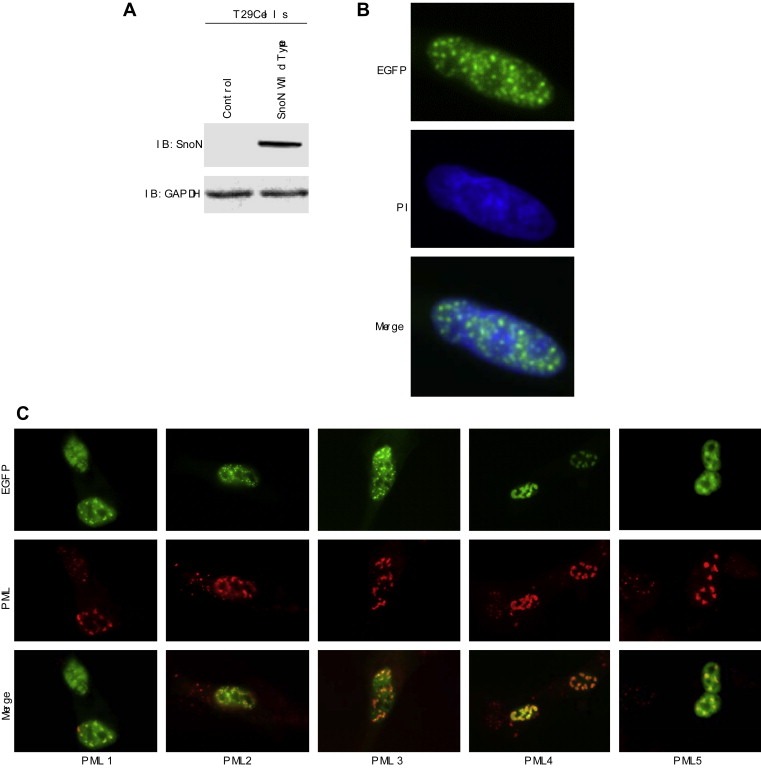
SnoN localizes to PML nuclear subdomains. A, Transient overexpression of wild type SnoN‐EGFP was performed by nucleofection and Western analysis of SnoN was performed with a polyclonal SnoN antibody which detected SnoN‐EGFP fusion protein. GAPDH was used as a loading control. B, Transient overexpression of wild type SnoN expressed as an EGFP fusion protein was performed by nucleofection and immunofluorescence staining was performed to examine localization of EGFP and counterstained with propidium iodide (PI). C, TIOSE cells expressing SnoN‐EGFP and PML isoforms (PML1, PML2, PML3, PML4, or PML5) by nucleofection and plated onto glass coverslips. Cells were then stained with PML antibodies and viewed under an inverted fluorescence microscope to detect colocalization of SnoN‐EGFP with PML.
Figure 8.
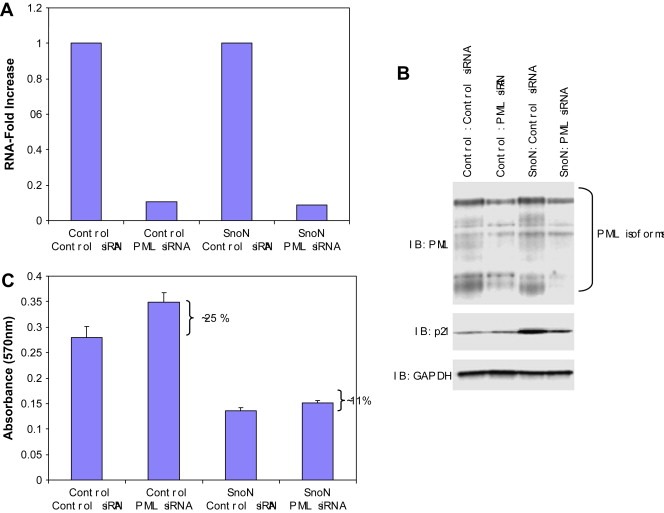
Knock‐down of PML decreases SnoN‐induced increases in p21 levels. A, B, Both control and SnoN‐EGFP F‐11 cells were transfected with PML siRNA. Following 24 and 48h transfection with PML siRNA, RNA and protein were harvested, respectively. qPCR was performed using PML qPCR probes/primers to measure RNA‐fold changes in PML RNA levels and Western blotting was performed using antibodies against PML, SnoN, p21, and GAPDH as a loading control. C, Control and PML siRNA treated TIOSE cells at 24h post‐transfection, were re‐seeded on to 96 well plates at 5000 cells were well and allowed to grow for another 48h. Growth rate was measured by MTS assay.
Since p21 levels were dramatically elevated in cells stably expressing SnoN, and p21 could contribute to SnoN‐mediated growth arrest or senescence, we next investigated whether knockdown of PML may modulate the effects of SnoN on p21 levels and thus, the observed growth arrest and senescence induced by SnoN. Reduction in PML RNA and protein levels (∼60%) (Figure 8A,B) markedly decreased p21 levels in F‐11 SnoN expressing cells indicating an essential role for PML in SnoN induction of p21 (Figure 8B). In control T29 cells, p21 levels were only slightly reduced by PML siRNA suggesting that PML does not play a major role in the regulation of basal p21 levels but rather selectively mediates the effects of SnoN. Despite modest effects on p21 levels in control cells, PML siRNA increased proliferation to a greater extent in control cells (∼25%) compared to SnoN expressing cells (∼11%) (Figure 8C) despite the decrease in p21 levels induced by PML siRNA in SnoN expressing cells (Figure 8B). Thus SnoN‐induced growth inhibition appears to proceed primarily through a PML and p21 independent pathway in immortalized, non‐transformed, normal ovarian epithelial cells.
SnoN is regulated by sumoylation, which enhances the ability of SnoN to suppress transcription of p21 (Hsu et al., 2006). Modification of proteins by SUMO‐1 is proposed to regulate specific protein–protein interactions, target proteins to specific subcellular compartments, and to prevent degradation by the ubiquitin‐dependent pathway (Muller et al., 2004). Interestingly, many SUMO‐1 conjugated proteins interact with PML as well as localize to PML nuclear bodies (Muller et al., 2004). However, knock‐down of PML with siRNA did not significantly alter SnoN protein levels suggesting that in T29, PML does not regulate SnoN levels in immortalized normal ovarian epithelial cells (Figure 8B).
3. Discussion
Regions of chromosomal aberrations frequently harbor novel oncogenes and thus, the identification of the drivers of these aberrations provides important information for understanding the initiation, progression, and management of cancer. Indeed, our previous studies of genomic amplification of 3q26 in ovarian cancer have identified PIK3CA (Shayesteh et al., 1999), PKCι(Eder et al., 2005), and EVI1 (Nanjundan et al., 2007) as potential markers of prognosis and therapeutic targets involved in ovarian cancer. We now demonstrate by high‐resolution CGH analysis and qPCR analysis that SnoN is at the peak of an amplified region at 3q26.2 with transcript levels being frequently and highly increased in serous epithelial ovarian cancers. SnoN RNA and protein levels are elevated with a greater frequency and to a greater degree than are DNA levels in ovarian cancers. We have previously demonstrated that PIK3CA, which resides in the 3q26 amplicon, and other processes result in frequent activation of the PI3K pathway in ovarian cancer. The regulation of the SnoN levels by signaling through the PI3K pathway suggests that activation of the pathway could cooperate with genomic amplification of SnoN to increase SnoN protein levels. The localization of both PIK3CA and SnoN to the 3q26 amplicon may represent a case of “co‐operative” oncogenesis.
Greater than 75% of ovarian carcinomas are resistant to the growth inhibitory and pro‐apoptotic effects of TGFβ, which may be a critical event in the pathogenesis of this disease. It has been reported that the TGFβ or other signaling components (i.e. SMAD2) may be mutated or altered in ovarian cancer potentially explaining the resistance to TGFβ (Baldwin et al., 2003). However, these mutations or alterations account for only a minority of TGFβ‐resistant ovarian carcinomas indicative of other potential alterations responsible for the observed resistance to TGFβ.
A previous study using RNA protection of established primary ovarian epithelial cells and ovarian cancer cell lines failed to detect differences in mRNA levels for SnoN or in TGFβ induced degradation of SnoN (Baldwin et al., 2003). Our data demonstrating an increase in DNA copy number and elevated RNA levels for SnoN assessed immediately ex vivo by qPCR suggests that in the in vivo tumor environment, SnoN levels are indeed markedly elevated in ovarian cancer. TGFβ induces a rapid loss of SnoN in immortalized normal epithelium followed by a rapid return to normal levels. The striking effects of altering SnoN expression on the behavior of TIOSE suggest that the amplification and increased expression of SnoN plays a major role in ovarian tumorigenesis. Previous data indicates that differential expression of SnoN or SkiL does not appear to account for resistance to TGFβ in ovarian cancer as they found that basal expression levels in normal and malignant ovarian primary cell cultures were similar and moreover, the same rate and amount of SnoN degradation was observed after TGFβ treatment (Baldwin et al., 2003).
In contrast to immortalized normal ovarian epithelial cells, SnoN levels in ovarian carcinoma cell lines (OVCAR8, OVCA429, SKOV3 and HEY cells) did not appear to undergo degradation with 1h following TGFβ stimulation, which may account for the resistance to TGFβ‐mediated growth arrest, but instead increased 3–6h following treatment with TGFβ. Combined with the observation that SnoN alters TGFβ induced activation of the PAI‐1 promoter, aspects of the TGFβ signaling cascade remain intact in ovarian cancer (i.e. both EVI1 and DACH1 inhibited TGFβ signaling, a dominant negative DACH1 partially restored signaling in ovarian cancer cell lines resistant to TGFβ) (Sunde et al., 2006). During cancer progression, when epithelial cells become resistant to the growth inhibitory effects of TGFβ, the cells become increasingly more sensitive to TGFβ responses to EMT and metastasis (Elliott and Blobe, 2005). Thus, it is likely that cancers which have an intact TGFβ‐pathway (i.e. able to promote SnoN‐mediated degradation) may be more aggressive than those with a defective pathway (i.e. increased SnoN). This is supported by a recent report where colorectal carcinoma patients with advanced stage tumors had decreased expression of SnoN levels which correlated with poor patient outcome (Chia et al., 2006).
Reduction of SnoN levels with siRNA in both TIOSE and ovarian carcinoma cell lines decreased cell growth by 20–50% concurrent with increased p21 levels. PAI‐1 levels were reduced in SnoN knockdown cells. PAI‐1 has been reported to be significantly overexpressed and correlated with an unfavorable prognosis in ovarian cancer (Kuhn et al., 1999). PAI‐1 not only has been shown to be a marker of senescence (Chen, 2000) but also is involved in increasing the migratory and invasive potential of TGFβ activated cells (Kutz et al., 2001). Thus, induction of PAI‐1 may, in addition to inducing replicative senescence, also contribute to TGFβ‐independent effects of SnoN on cellular motility. Collectively, these results may indicate that SnoN, perhaps in cooperation with other amplified genes, is required to affect cellular migration.
Surprisingly, stable expression of SnoN in an TAg/hTert immortalized ovarian surface epithelial cell line did not stimulate proliferation but rather provoked senescence reversing cellular immortalization by hTert, which was accompanied by upregulation of p21, cyclin D1, PAI‐1, p‐ERK signaling in combination with a reduction in pRb and reduced p‐AKT signaling independently of p53. Similar to the effects of SMURF2, a TGFβ‐induced E3 ubiquitin ligase, on senescence (Zhang and Cohen, 2004), SnoN is able to bypass cellular immortalization induced by hTert. Given the TGFβ‐induced targeting of SnoN by SMURF2, these two processes may be linked. Further, the induction of PAI‐1 may contribute to the induction of senescence (Chen, 2000). The ability of SnoN to promote growth arrest and senescence is in contrast to its oncogenic role in several cell lines (Zhu et al., 2005), where, with the exception of lung epithelial cells, it has been reported to act as a tumor suppressor (Sarker et al., 2005). Multiple oncogenes that increase the aggressiveness of cancer cell lines have been reported to induce senescence in normal epithelium including ERBB2 (Trost et al., 2005), RAS (Braig and Schmitt, 2006) and BRAF (Michaloglou et al., 2005). Indeed, BRAF mutations are extremely frequent in normal nevi; however, these nevi remain in replicative senescence for decades and rarely progress to melanomas (Michaloglou et al., 2005), indicating the importance of oncogene‐induced senescence. Further, overexpression of oncogenic ERBB2 in breast cancer cells can provoke premature senescence accompanied by upregulation of p21 (Trost et al., 2005). Although expression of SnoN induced p21, this did not appear to be required for the growth inhibition and senescence induced by SnoN as siRNA to PML markedly decreased p21 levels but did not restore proliferative potential.
In summary, the frequent and high‐level amplification in SnoN DNA and RNA levels in advanced stage serous epithelial ovarian cancers suggests that SnoN contributes to tumor initiation and progression. However, the functional effects of SnoN expression are complex notably by its effects on cell growth: increased cellular proliferation (by knockdown) and induction of cellular senescence (by long‐term expression). However, the frequent and high‐level increase in SnoN DNA and RNA levels in ovarian cancer suggests that during tumor progression, SnoN acquires tumor‐promoting activity. Compatible with these observations, as noted above, SnoN has been proposed to have both tumor promoting and inhibiting activity dependent on the cellular context. These observations are similar to those reported for the role of TGFβ in tumorigenesis. TGFβ exhibits dual effects during carcinogenesis where in early stages of tumor development, it acts as a tumor suppressor inhibiting cells growth and inducing apoptosis and in later stages of tumorigenesis, it promotes metastasis (Elliott and Blobe, 2005). Thus, depending on the cell context and wiring of the TGFβ signaling pathway, the activities of SnoN/SkiL may either promote transformation or tumor suppression. Clearly, TGFβ function is aberrant in ovarian cancer and SnoN, from our data presented herein, is dysregulated in ovarian cancers. Thus, SnoN may contribute to aberrant TGFβ signaling and thus, lead to altered functional outcomes.
4. Experimental procedures
4.1. Preparation of patient samples
Stage I–IV serous epithelial ovarian cancers were obtained from the Ovarian Cancer Tumor Bank of the MD Anderson Cancer Center. Benign ovarian tumors and stage III and IV serous epithelial ovarian cancers were obtained from the Basic Biology of Ovarian Cancer Program Project Grant Bank Tissue and Pathology Core at the University of California San Francisco. Normal ovarian epithelial scrapings were obtained from Northwestern University. The normal scrapings were collected using a cytobrush, and the cells were immediately suspended and frozen in RLT buffer (Qiagen, Valencia, CA). Benign ovarian cysts were macrodissected to increase the amount of epithelium present. All cancer samples were selected to contain greater than 70% tumors. Where necessary, early stage and late stage ovarian cancers were macrodissected to contain greater than 70% tumor. DNA was extracted as previously described (Snijders et al., 2001). Total RNA was extracted from all ovarian cancers and normal ovarian epithelial scrapings using the RNeasy Kit (Qiagen, Valencia, CA) according to the manufacturer's protocol. Institutional Review Board approval had been obtained at each participating institution prior to the initiation of this study.
4.2. Quantitative PCR analysis
Quantitative PCR was performed using RNA isolated from normal, benign, stage I–IV ovarian patient samples. A one‐step RT‐PCR Taqman master mix from Applied Biosystems and primers for genes in the 3q26.2 amplicon were obtained using Genebank sequences as well as from Assays on Demand (Hs00180524_m1 (SnoN/SkiL)).
We determined mRNA levels using the ABI PRISM 7700 Sequence Detection System and used β‐actin as a reference. PCR conditions were as follows: stage I: 48°C for 30min; stage II: 95°C for 10min; stage III: [40 cycles] 95°C for 15s followed by 60°C for 1min. Using the correlative method, RNA‐fold increase in expression was calculated as Ct of gene – Ct of β‐actin to generate delta Ct from which delta Ct of the normal sample was subtracted. These values were then converted to log2 values.
4.3. RT‐PCR cloning and plasmid construction
One‐step RT‐PCR (Invitrogen) was used to amplify SnoN PCR products, which were gel purified, cloned into pTOPO‐XL vector, and sequenced. EcoRI was used to release the full‐length insert and used for ligation into pEGFP‐C1 (Invitrogen) vector for expression studies. All constructs were sequenced prior to use.
The following primers were used for RT‐PCR:
SnoN Forward Primer: CGG AAC AAG GGC CAC CAT GGA AAA CCT CCA GAC A.
SnoN Reverse Primer: CAG GCC TGG CGC CCT ATT CTT TAG CAG T.
4.4. SiRNA transfection of ovarian cells for functional studies
Two independent siRNAs against SnoN/SkiL were obtained from Ambion (catalog #: AM16704; ID #: 107695 and 107696). PML (L‐006547‐00) and non‐targeting control‐1 siRNA (D‐001210‐01‐05) were obtained from Dharmacon. Briefly, cells were cultured in antibiotic‐free medium for 24h prior to transfection (2ml of media in each well of 6 well plate). Dharmafect I (Dharmacon) (4μl) was incubated in 100μl of OPTI‐MEM media for 10min at room temperature followed by the addition of 5μl of siRNA (20μM) and further incubated for 20min at room temperature. This mixture was added to cells and incubated for 48h for isolation of RNA and protein.
4.5. SDS‐PAGE and Western blot analysis
Proteins were resolved on an 8% SDS‐PAGE gel and electrophoretically transferred to nitrocellulose membranes. After blocking with 5% (w/v) milk, membranes were incubated for 1h with primary antibody and 1h with appropriate horseradish peroxidase‐conjugated secondary antibodies. Blots were developed using Amersham chemiluminescence substrates. Rabbit polyclonal antibodies against SnoN, PML, and p21 were obtained from Santa Cruz Biotechnology. Monoclonal PAI‐1 antibody was obtained from BD Pharmingen. P‐SMAD2, total SMAD2/3, p‐ERK, p‐AKT, and total AKT antibodies were obtained from Cell Signaling Technology. A monoclonal antibody against Arkadia was obtained from Abnova (Taiwan).
4.6. Direct and indirect immunofluorescence microscopy
Normal ovarian epithelial cells immortalized with hTert/large T antigen (TIOSE: T29) cells were nucleofector transfected with SnoN with EGFP plasmid or control vector and plated onto glass coverslips for 24h. The cells were then fixed in 4% paraformaldehyde in phosphate‐buffered saline (PBS) for 30min at room temperature, washed twice in PBS, and blocked for 1h at room temperature in PBS containing 5% goat serum and 0.1% Triton X‐100. The cells were counterstained with Hoescht nuclear stain, washed 3 times for 5min in PBS, and mounted onto glass slides and viewed under a fluorescence microscope.
T29 cells were nucleofector transfected with SnoN with EGFP plasmid or control vector in the absence or presence of PML isoforms (PML1, PML2, PML3, PML4, or PML5 in pcDNA3.1) (kind gift of Dr. Kun‐Sang Chang, Department of Molecular Pathology, MD Anderson Cancer Center, Houston, TX) and plated onto glass coverslips for 24h. The cells were then fixed in 4% paraformaldehyde in phosphate‐buffered saline (PBS) for 30min at room temperature, washed twice in PBS, and blocked for 1h at room temperature in PBS containing 5% goat serum and 0.1% Triton X‐100. Primary antibodies (PML used at 1:1000 dilution) were incubated in PBS containing 1% goat serum and 0.1% Triton X‐100 overnight at 4°C. The cells were washed 3 times for 5min in PBS and then incubated with the appropriate cy3‐fluorescent conjugated antibody for 1h in PBS containing 1% goat serum and 0.1% Triton X‐100. The cells were washed 3 times for 5min in PBS, and mounted onto glass slides and viewed under a fluorescence microscope.
4.7. Transcriptional assays
Nucleofector transfection was performed in TIOSE (T29) cells with SnoN (5μg) in combination with p21 (obtained from Dr. Wafik El‐Deiry (University of Pennsylvania)), p3TP‐Lux (containing the firefly luciferase reporter gene under the control of three 12‐O‐tetradecanoylphorbol‐13‐acetate (TPA) response elements and a fragment of the PAI‐1 promoter), and p(CAGA)12‐Lux, a reporter gene containing 12 repeats of Smad binding sequences from the PAI‐1 promoter (obtained from Dr. Carlos Arteaga (Vanderbilt University)) (1μg) as well as the AP‐1 cis‐reporter plasmid (Stratagene) using Renilla luciferase to normalize (0.05μg). Cells were re‐seeded 6h post‐transfection, allowed to adhere for 6h, and serum starved/treated with 50pM TGFβ. TGFβ was chosen as being on the linear portion of the dose response curve. The following day (24h post‐transfection), cells were harvested in passive lysis buffer and assessed for luciferase activity using Dual Luciferase Assay kit (Promega).
4.8. Proliferation and cellular migration assays
TAg/hTert immortalized normal ovarian epithelial cells (TIOSE: T29 and T80) and ovarian carcinoma cells (OVCAR8, OVCA429, SKOV3, and HEY) transfected with siRNA were counted 24h post‐transfection and 5000 cells were plated in each well of a 96‐well plate maintained in 10% FBS. At various days, cells were fixed and stained with crystal violet solution, dissolved in Sorenson's buffer, and absorbance measured at 570nm. To assess migration, cells transfected with siRNA were counted 24h post‐transfection and seeded into Boyden chamber inserts in serum‐free media. FBS in the lower chamber media (RPMI 1640) was used as a chemoattractant for 24h. The cells that migrated onto the lower membrane were stained with crystal violet, photographed, and counted.
4.9. Colony formation assays and SA‐β‐gal staining
TAg/hTert immortalized normal ovarian epithelial cells (TIOSE: T29) infected with SnoN or control retrovirus and selected for 2weeks in G418 were counted and 5000 cells were plated in each well of a 96‐well plate maintained in 10% FBS. At various days, cells were fixed and stained with crystal violet solution, dissolved in Sorenson's buffer, and absorbance measured at 570nm. For colony formation assays, cells were plated at 500cells/well in each well of 6 well plate and grown in G418‐selection media for 2weeks after which time the cells were stained with Coomassie staining solution (0.1% Coomassie Brilliant Blue R‐250 in 30% methanol and 10% acetic acid) and photographed. Staining for β‐galactosidase activity at pH 6 was performed using a staining kit from Cell Signaling Technology.
Acknowledgements
This work was supported by NCI RO1 CA123219‐01A2 to GBM and MN, NCI P50 CA083639 and P30 CA16672 to GBM, P01 CA64602 to GBM and JWG, and in part by the U.S. DoE, Office of Science, OBER (Contract DE‐AC03‐76SF00098, JWG). MN was supported by an Astrazeneca Postdoctoral Fellowship and a Lung SPORE (PO50 CA070907) Career Development Award.
Nanjundan Meera, Cheng Kwai Wa, Zhang Fan, Lahad John, Kuo Wen-Lin, Schmandt Rosemarie, Smith-McCune Karen, Fishman David, Gray Joe W., Mills Gordon B., (2008), Overexpression of SnoN/SkiL, amplified at the 3q26.2 locus, in ovarian cancers: A role in ovarian pathogenesis, Molecular Oncology, 2, doi: 10.1016/j.molonc.2008.05.001.
References
- Baldwin, R.L. , Tran, H. , Karlan, B.Y. , 2003. Loss of c-myc repression coincides with ovarian cancer resistance to transforming growth factor beta growth arrest independent of transforming growth factor beta/Smad signaling. Cancer Res. 63, 1413–1419. [PubMed] [Google Scholar]
- Braig, M. , Schmitt, C.A. , 2006. Oncogene-induced senescence: putting the brakes on tumor development. Cancer Res. 66, 2881–2884. [DOI] [PubMed] [Google Scholar]
- Buess, M. , Terracciano, L. , Reuter, J. , Ballabeni, P. , Boulay, J.L. , Laffer, U. , Metzger, U. , Herrmann, R. , Rochlitz, C. , 2004. Amplification of SKI is a prognostic marker in early colorectal cancer. Neoplasia 6, 207–212. [DOI] [PMC free article] [PubMed] [Google Scholar]
- Chelbi-Alix, M.K. , Pelicano, L. , Quignon, F. , Koken, M.H. , Venturini, L. , Stadler, M. , Pavlovic, J. , Degos, L. , de The, H. , 1995. Induction of the PML protein by interferons in normal and APL cells. Leukemia 9, 2027–2033. [PubMed] [Google Scholar]
- Chen, Q.M. , 2000. Replicative senescence and oxidant-induced premature senescence. Beyond the control of cell cycle checkpoints. Ann. N.Y. Acad. Sci. 908, 111–125. [DOI] [PubMed] [Google Scholar]
- Chen, T. , Triplett, J. , Dehner, B. , Hurst, B. , Colligan, B. , Pemberton, J. , Graff, J.R. , Carter, J.H. , 2001. Transforming growth factor-beta receptor type I gene is frequently mutated in ovarian carcinomas. Cancer Res. 61, 4679–4682. [PubMed] [Google Scholar]
- Chia, J.A. , Simms, L.A. , Cozzi, S.J. , Young, J. , Jass, J.R. , Walsh, M.D. , Spring, K.J. , Leggett, B.A. , Whitehall, V.L. , 2006. SnoN expression is differently regulated in microsatellite unstable compared with microsatellite stable colorectal cancers. BMC Cancer 6, 252 [DOI] [PMC free article] [PubMed] [Google Scholar]
- Coates, P.J. , 2002. Markers of senescence?. J. Pathol 196, 371–373. [DOI] [PubMed] [Google Scholar]
- Dellaire, G. , Bazett-Jones, D.P. , 2004. PML nuclear bodies: dynamic sensors of DNA damage and cellular stress. Bioessays 26, 963–977. [DOI] [PubMed] [Google Scholar]
- Eder, A.M. , Sui, X. , Rosen, D.G. , Nolden, L.K. , Cheng, K.W. , Lahad, J.P. , Kango-Singh, M. , Lu, K.H. , Warneke, C.L. , Atkinson, E.N. , 2005. Atypical PKCiota contributes to poor prognosis through loss of apical-basal polarity and cyclin E overexpression in ovarian cancer. Proc. Natl. Acad. Sci. USA 102, 12519–12524. [DOI] [PMC free article] [PubMed] [Google Scholar]
- Edmiston, J.S. , Yeudall, W.A. , Chung, T.D. , Lebman, D.A. , 2005. Inability of transforming growth factor-beta to cause SnoN degradation leads to resistance to transforming growth factor-beta-induced growth arrest in esophageal cancer cells. Cancer Res. 65, 4782–4788. [DOI] [PubMed] [Google Scholar]
- Efeyan, A. , Collado, M. , Velasco-Miguel, S. , Serrano, M. , 2006. Genetic dissection of the role of p21(Cip1/Waf1) in p53-mediated tumour suppression. Oncogene 26, 1645–1649. [DOI] [PubMed] [Google Scholar]
- Elliott, R.L. , Blobe, G.C. , 2005. Role of transforming growth factor Beta in human cancer. J. Clin. Oncol. 23, 2078–2093. [DOI] [PubMed] [Google Scholar]
- Fukuchi, M. , Nakajima, M. , Fukai, Y. , Miyazaki, T. , Masuda, N. , Sohda, M. , Manda, R. , Tsukada, K. , Kato, H. , Kuwano, H. , 2004. Increased expression of c-Ski as a co-repressor in transforming growth factor-beta signaling correlates with progression of esophageal squamous cell carcinoma. Int. J. Cancer 108, 818–824. [DOI] [PubMed] [Google Scholar]
- He, J. , Tegen, S.B. , Krawitz, A.R. , Martin, G.S. , Luo, K. , 2003. The transforming activity of Ski and SnoN is dependent on their ability to repress the activity of Smad proteins. J. Biol. Chem. 278, 30540–30547. [DOI] [PubMed] [Google Scholar]
- Hsu, Y.H. , Sarker, K.P. , Pot, I. , Chan, A. , Netherton, S.J. , Bonni, S. , 2006. Sumoylated SnoN represses transcription in a promoter-specific manner. J. Biol. Chem. 281, 33008–33018. [DOI] [PubMed] [Google Scholar]
- Hurteau, J. , Rodriguez, G.C. , Whitaker, R.S. , Shah, S. , Mills, G. , Bast, R.C. , Berchuck, A. , 1994. Transforming growth factor-beta inhibits proliferation of human ovarian cancer cells obtained from ascites. Cancer 74, 93–99. [DOI] [PubMed] [Google Scholar]
- Imoto, I. , Pimkhaokham, A. , Fukuda, Y. , Yang, Z.Q. , Shimada, Y. , Nomura, N. , Hirai, H. , Imamura, M. , Inazawa, J. , 2001. SNO is a probable target for gene amplification at 3q26 in squamous-cell carcinomas of the esophagus. Biochem. Biophys. Res. Commun. 286, 559–565. [DOI] [PubMed] [Google Scholar]
- Imoto, I. , Yuki, Y. , Sonoda, I. , Ito, T. , Shimada, Y. , Imamura, M. , Inazawa, J. , 2003. Identification of ZASC1 encoding a Kruppel-like zinc finger protein as a novel target for 3q26 amplification in esophageal squamous cell carcinomas. Cancer Res. 63, 5691–5696. [PubMed] [Google Scholar]
- Krakowski, A.R. , Laboureau, J. , Mauviel, A. , Bissell, M.J. , Luo, K. , 2005. Cytoplasmic SnoN in normal tissues and nonmalignant cells antagonizes TGF-beta signaling by sequestration of the Smad proteins. Proc. Natl. Acad. Sci. USA 102, 12437–12442. [DOI] [PMC free article] [PubMed] [Google Scholar]
- Kuhn, W. , Schmalfeldt, B. , Reuning, U. , Pache, L. , Berger, U. , Ulm, K. , Harbeck, N. , Spathe, K. , Dettmar, P. , Hofler, H. , 1999. Prognostic significance of urokinase (uPA) and its inhibitor PAI-1 for survival in advanced ovarian carcinoma stage FIGO IIIc. Br. J. Cancer 79, 1746–1751. [DOI] [PMC free article] [PubMed] [Google Scholar]
- Kutz, S.M. , Hordines, J. , McKeown-Longo, P.J. , Higgins, P.J. , 2001. TGF-beta1-induced PAI-1 gene expression requires MEK activity and cell-to-substrate adhesion. J. Cell Sci. 114, 3905–3914. [DOI] [PubMed] [Google Scholar]
- Levy, L. , Howell, M. , Das, D. , Harkin, S. , Episkopou, V. , Hill, C.S. , 2007. Arkadia activates Smad3/Smad4-dependent transcription by triggering signal-induced SnoN degradation. Mol. Cell. Biol. 27, 6068–6083. [DOI] [PMC free article] [PubMed] [Google Scholar]
- Liu, X. , Sun, Y. , Weinberg, R.A. , Lodish, H.F. , 2001. Ski/Sno and TGF-beta signaling. Cytokine Growth Factor Rev. 12, 1–8. [DOI] [PubMed] [Google Scholar]
- Michaloglou, C. , Vredeveld, L.C. , Soengas, M.S. , Denoyelle, C. , Kuilman, T. , van der Horst, C.M. , Majoor, D.M. , Shay, J.W. , Mooi, W.J. , Peeper, D.S. , 2005. BRAFE600-associated senescence-like cell cycle arrest of human naevi. Nature 436, 720–724. [DOI] [PubMed] [Google Scholar]
- Muller, S. , Ledl, A. , Schmidt, D. , 2004. SUMO: a regulator of gene expression and genome integrity. Oncogene 23, 1998–2008. [DOI] [PubMed] [Google Scholar]
- Nagano, Y. , Mavrakis, K.J. , Lee, K.L. , Fujii, T. , Koinuma, D. , Sase, H. , Yuki, K. , Isogaya, K. , Saitoh, M. , Imamura, T. , 2007. Arkadia induces degradation of SnoN and c-Ski to enhance transforming growth factor-beta signaling. J. Biol. Chem. 282, 20492–20501. [DOI] [PubMed] [Google Scholar]
- Nanjundan, M. , Nakayama, Y. , Cheng, K.W. , Lahad, J. , Liu, J. , Lu, K. , Kuo, W.L. , Smith-McCune, K. , Fishman, D. , Gray, J.W. , 2007. Amplification of MDS1/EVI1 and EVI1, located in the 3q26.2 amplicon, is associated with favorable patient prognosis in ovarian cancer. Cancer Res. 67, 3074–3084. [DOI] [PubMed] [Google Scholar]
- Reed, J.A. , Lin, Q. , Chen, D. , Mian, I.S. , Medrano, E.E. , 2005. SKI pathways inducing progression of human melanoma. Cancer Metastasis Rev. 24, 265–272. [DOI] [PubMed] [Google Scholar]
- Riazimand, S.H. , Welkoborsky, H.J. , Bernauer, H.S. , Jacob, R. , Mann, W.J. , 2002. Investigations for fine mapping of amplifications in chromosome 3q26.3–28 frequently occurring in squamous cell carcinomas of the head and neck. Oncology 63, 385–392. [DOI] [PubMed] [Google Scholar]
- Roninson, I.B. , 2003. Tumor cell senescence in cancer treatment. Cancer Res. 63, 2705–2715. [PubMed] [Google Scholar]
- Sarker, K.P. , Wilson, S.M. , Bonni, S. , 2005. SnoN is a cell type-specific mediator of transforming growth factor-beta responses. J. Biol. Chem. 280, 13037–13046. [DOI] [PubMed] [Google Scholar]
- Sattler, H.P. , Rohde, V. , Bonkhoff, H. , Zwergel, T. , Wullich, B. , 1999. Comparative genomic hybridization reveals DNA copy number gains to frequently occur in human prostate cancer. Prostate 39, 79–86. [DOI] [PubMed] [Google Scholar]
- Sattler, H.P. , Lensch, R. , Rohde, V. , Zimmer, E. , Meese, E. , Bonkhoff, H. , Retz, M. , Zwergel, T. , Bex, A. , Stoeckle, M. , 2000. Novel amplification unit at chromosome 3q25–q27 in human prostate cancer. Prostate 45, 207–215. [DOI] [PubMed] [Google Scholar]
- Shayesteh, L. , Lu, Y. , Kuo, W.L. , Baldocchi, R. , Godfrey, T. , Collins, C. , Pinkel, D. , Powell, B. , Mills, G.B. , Gray, J.W. , 1999. PIK3CA is implicated as an oncogene in ovarian cancer. Nat. Genet. 21, 99–102. [DOI] [PubMed] [Google Scholar]
- Shinagawa, T. , Dong, H.D. , Xu, M. , Maekawa, T. , Ishii, S. , 2000. The sno gene, which encodes a component of the histone deacetylase complex, acts as a tumor suppressor in mice. Embo J. 19, 2280–2291. [DOI] [PMC free article] [PubMed] [Google Scholar]
- Shinagawa, T. , Nomura, T. , Colmenares, C. , Ohira, M. , Nakagawara, A. , Ishii, S. , 2001. Increased susceptibility to tumorigenesis of ski-deficient heterozygous mice. Oncogene 20, 8100–8108. [DOI] [PubMed] [Google Scholar]
- Snijders, A.M. , Nowak, N. , Segraves, R. , Blackwood, S. , Brown, N. , Conroy, J. , Hamilton, G. , Hindle, A.K. , Huey, B. , Kimura, K. , 2001. Assembly of microarrays for genome-wide measurement of DNA copy number. Nat. Genet. 29, 263–264. [DOI] [PubMed] [Google Scholar]
- Stroschein, S.L. , Wang, W. , Zhou, S. , Zhou, Q. , Luo, K. , 1999. Negative feedback regulation of TGF-beta signaling by the SnoN oncoprotein. Science 286, 771–774. [DOI] [PubMed] [Google Scholar]
- Stroschein, S.L. , Bonni, S. , Wrana, J.L. , Luo, K. , 2001. Smad3 recruits the anaphase-promoting complex for ubiquitination and degradation of SnoN. Genes Dev. 15, 2822–2836. [DOI] [PMC free article] [PubMed] [Google Scholar]
- Sugita, M. , Tanaka, N. , Davidson, S. , Sekiya, S. , Varella-Garcia, M. , West, J. , Drabkin, H.A. , Gemmill, R.M. , 2000. Molecular definition of a small amplification domain within 3q26 in tumors of cervix, ovary, and lung. Cancer Genet. Cytogenet 117, 9–18. [DOI] [PubMed] [Google Scholar]
- Sunde, J.S. , Donninger, H. , Wu, K. , Johnson, M.E. , Pestell, R.G. , Rose, G.S. , Mok, S.C. , Brady, J. , Bonome, T. , Birrer, M.J. , 2006. Expression profiling identifies altered expression of genes that contribute to the inhibition of transforming growth factor-{beta} signaling in ovarian cancer. Cancer Res. 66, 8404–8412. [DOI] [PubMed] [Google Scholar]
- Trost, T.M. , Lausch, E.U. , Fees, S.A. , Schmitt, S. , Enklaar, T. , Reutzel, D. , Brixel, L.R. , Schmidtke, P. , Maringer, M. , Schiffer, I.B. , 2005. Premature senescence is a primary fail-safe mechanism of ERBB2-driven tumorigenesis in breast carcinoma cells. Cancer Res. 65, 840–849. [PubMed] [Google Scholar]
- Wang, D. , Kanuma, T. , Takama, F. , Mizumuma, H. , Ibuki, Y. , Wake, N. , Mogi, A. , Shitara, Y. , Hagiwara, K. , Takenoshita, S. , 1999. Mutation analysis of the Smad3 gene in human ovarian cancers. Int. J. Oncol. 15, 949–953. [DOI] [PubMed] [Google Scholar]
- Wang, D. , Kanuma, T. , Mizumuma, H. , Ibuki, Y. , Takenoshita, S. , 2000. Mutation analysis of the Smad6 and Smad7 gene in human ovarian cancers. Int. J. Oncol 17, 1087–1091. [DOI] [PubMed] [Google Scholar]
- Weber-Mangal, S. , Sinn, H.P. , Popp, S. , Klaes, R. , Emig, R. , Bentz, M. , Mansmann, U. , Bastert, G. , Bartram, C.R. , Jauch, A. , 2003. Breast cancer in young women (< or =35years): genomic aberrations detected by comparative genomic hybridization. Int. J. Cancer 107, 583–592. [DOI] [PubMed] [Google Scholar]
- Weichert, W. , Gekeler, V. , Denkert, C. , Dietel, M. , Hauptmann, S. , 2003. Protein kinase C isoform expression in ovarian carcinoma correlates with indicators of poor prognosis. Int. J. Oncol. 23, 633–639. [PubMed] [Google Scholar]
- Wessels, L.F. , van Welsem, T. , Hart, A.A. , van't Veer, L.J. , Reinders, M.J. , Nederlof, P.M. , 2002. Molecular classification of breast carcinomas by comparative genomic hybridization: a specific somatic genetic profile for BRCA1 tumors. Cancer Res. 62, 7110–7117. [PubMed] [Google Scholar]
- Whitley, B.R. , Palmieri, D. , Twerdi, C.D. , Church, F.C. , 2004. Expression of active plasminogen activator inhibitor-1 reduces cell migration and invasion in breast and gynecological cancer cells. Exp. Cell Res. 296, 151–162. [DOI] [PubMed] [Google Scholar]
- Wilson, J.J. , Malakhova, M. , Zhang, R. , Joachimiak, A. , Hegde, R.S. , 2004. Crystal structure of the dachshund homology domain of human SKI. Structure 12, 785–792. [DOI] [PubMed] [Google Scholar]
- Zhang, F. , Monkkonen, M. , Roth, S. , Laiho, M. , 2002. Proteasomal activity modulates TGF-ss signaling in a gene-specific manner. FEBS Lett. 527, 58–62. [DOI] [PubMed] [Google Scholar]
- Zhang, F. , Lundin, M. , Ristimaki, A. , Heikkila, P. , Lundin, J. , Isola, J. , Joensuu, H. , Laiho, M. , 2003. Ski-related novel protein N (SnoN), a negative controller of transforming growth factor-beta signaling, is a prognostic marker in estrogen receptor-positive breast carcinomas. Cancer Res. 63, 5005–5010. [PubMed] [Google Scholar]
- Zhang, H. , Cohen, S.N. , 2004. Smurf2 up-regulation activates telomere-dependent senescence. Genes Dev. 18, 3028–3040. [DOI] [PMC free article] [PubMed] [Google Scholar]
- Zhu, Q. , Pearson-White, S. , Luo, K. , 2005. Requirement for the SnoN oncoprotein in transforming growth factor beta-induced oncogenic transformation of fibroblast cells. Mol. Cell. Biol. 25, 10731–10744. [DOI] [PMC free article] [PubMed] [Google Scholar]
- Zhu, Q. , Krakowski, A.R. , Dunham, E.E. , Wang, L. , Bandyopadhyay, A. , Berdeaux, R. , Martin, G.S. , Sun, L. , Luo, K. , 2007. Dual role of SnoN in mammalian tumorigenesis. Mol. Cell. Biol. 27, 324–339. [DOI] [PMC free article] [PubMed] [Google Scholar]