

Abstract
We report microscopically collected infrared spectra of cells found in human urine in an effort to develop automatic methods for bladder cancer screening. Unsupervised multivariate analysis of the observed spectral patterns reveals distinct spectral classes, which correlated very well with visual cytology. Therefore, we believe that spectral analysis of individual cells can aid cytology in rendering reliable diagnoses based on objective measurements and discriminant algorithms.
Keywords: Cancer screening, Infrared micro-spectroscopy, Spectral cytology, Principal component analysis (PCA), Urine cytology
1. Introduction
The detection and diagnosis of abnormal cells among a sample of exfoliated epithelial cells is a common method for cancer screening. This field of cytology has reduced the morbidity from many cancers. A prime example for the success of cytological screening is the cervical cancer test, known as the “Pap” test, which most women of reproductive age undergo at least yearly in industrialized countries. The actual diagnosis in the Pap test is carried out by visual microscopic examination of stained cells, using stains and cell classification schemes originally developed by Papanicolaou (1941) [1]. The major changes in the approach to cervical cancer screening have been in the area of sample preparation, rather than diagnosis: the sample slides used now are mostly prepared by automatic methods to give homogeneously distributed and reproducibly stained deposits of cells on a slide (monolayer cytology) [2,3]. Identifiable differences between normal and abnormal cells include nucleus/cytoplasm ratio (N/C), nuclear morphology and staining patterns.
However, the overall accuracy and inter-observer repeatability of cervical cell diagnostics is still relatively low. In a comparative study of results between an original cytological diagnosis, and repeat diagnoses using monolayer cytology, colposcopy and histopathology of over 7,700 individual cases, the concordance between the three modalities of diagnosis varied widely (ca. 40 to 90%) [4]. The largest disagreements were found between cells classified as ASCUS (Atypical Squamous Cells of Undetermined Significance), and LSIL and HSIL (Low and High Grade Squamous Intraepithelial Lesion, respectively). Although most of the discordance was in the direction of false positive original cytology, the overall agreement between the diagnoses was so low that the authors summarized the study in the statement that the “…inter-observer reproducibility of cytology and histologic interpretation is… only moderate”.
Various novel diagnostic methods were introduced in the 1990’s to improve existing cytology. One of these methods was based on computer analysis of visual microscopic images taken automatically [5, 6]. These automated visual methods have not revolutionized cytology as was originally hoped, and, in fact, have created new problems of their own. Another completely novel approach for the analysis of exfoliated cervical cells was proposed by Wong, et al [7, 8]. This approach was based on collecting infrared spectra of pellets of exfoliated cells, and analyzing the resulting infrared spectra for the presence of unusual signals. The rational for this approach is as follows. Infrared spectroscopy measures the composition of cells and tissue in terms of their biochemical components, and variations of the composition that is caused by disease. Thus, it should be possible to correlate spectral changes against classical cytology, and use this correlation to reliably analyze unknown samples. The advantage of this method is objective and reproducible diagnosis, independent of fatigue, experience and inter-observer variability of cytologists.
Although early results from these efforts appeared very promising, this methodology suffered from the fact that spectra of individual cells could not be collected in reasonable acquisition times, given the instrumentation available at that time. Therefore, all measurements were carried out using cell pellets, which contained a variety of cell types, cell debris, and extra-cellular materials, such as mucus. Furthermore, high-resolution images of the cells in the pellets were not available for correlation of spectral and cytological data on a cell-by-cell basis.
Instrumental advances in the past five years have changed this situation completely. Infrared micro-spectrometers are now commercially available that permit collection of high quality infrared spectra from individual cells, or even from the nucleus of a cell, in a few seconds [9, 10]. Furthermore, the visual image quality of infrared micro-spectrometers rivals that of standard microscopes. Thus, it is now possible to collect spectra and images of individual cells, and correlate the two modalities.
We present in this paper a correlation between spectral patterns and cytological identification of normal cell types found in human urine. This report will serve two functions. First, we wish to introduce the methods of “spectral cytology” to the medical community, and secondly, establish the possibility of the eventual use if this methodology for a low cost, automated test for bladder cancer, from cells found in urine. In a future paper, we shall report results collected from urine samples of cancer patients.
2. Background
2.1. Infrared Spectroscopy
A brief review of the principles of Fourier transform infrared spectroscopy (FT-IR) and infrared –micro-spectroscopy (IR-MSP) will be presented. In FT-IR and IR-MSP, low energy photons with wavelengths from about 3 to 50 μm (3300 to 200 cm−1) are used to excite the vibrational motion of covalently bonded moieties. In principle, each molecule has its own specific vibrational spectral pattern or spectral fingerprint [11, 12]. Proteins, the major cellular constituent, exhibit the most prominent spectral features in cells and tissues. Although cellular proteins exhibit very similar vibrational spectra due to their overall structural and chemical similarities, it is nevertheless possible to differentiate various proteins, and determine information such as degree of hydration, protein secondary structure and other features from the infrared spectra [13–15]. In addition, spectral signatures of the other cellular components, such as DNA, RNA, phospholipids and carbohydrates are well established and distinguishable from those of intact cells and tissue [16, 17].
In IR-MSP, the IR beam probing the sample is focused to a size of about 10 μm (restricted by the diffraction limit). Consequently, infrared spectra of microscopic objects can be acquired with a spatial resolution of about 10 μm, and spectral data from a single human cell can be acquired. IR-MSP offers the advantage over other spectral techniques in that no probe groups (such as stains, fluorescent markers attached to antibodies or to DNA-binding drugs) are required to detect specific changes in cells, since infrared spectroscopy monitors the inherent spectral signatures of the cellular components.
2.2. Principal Component Analysis
The analysis of spectra from individual cells was carried out by principal component analysis (PCA). PCA is a well-established multivariate method ideally suited for distinguishing small, re-occurring spectral variations in data sets containing large uncorrelated variations [18]. We selected PCA over other methods, since it is a completely unsupervised method, to establish whether or not spectra recorded from individual cells group into classes due to cell type, donor identity or disease, among other factors.
For PCA, the entire spectral data set, containing n spectra, is written into one matrix S in which each column represents one spectrum S(ν) of m intensity data points. The spectral vectors are pre-processed by calculating the 2nd derivative and vector-normalized. The former of these procedures produces better-resolved peaks and eliminates background slopes, whereas the latter reduces the influence of sample thickness.
The original spectra S(ν) are then expressed in terms of “principal components” Z(ν), which are computed from the covariance of the data set. These PC’s are defined such that the first PC contains most of the variance in the data set, and each subsequent PC contains less variance. The original spectra S(ν) are then expressed in terms of linear combinations of the “principal components” Z(ν), according to
| (1) |
In the spectral data sets of individual cells one finds that a large fraction of the total spectral variance is contained in the first few PC’s. Typically, 5–8 PC’s contain more than 99 % of the variance. Thus, the spectral expansion given by summation in eq. 1 can be truncated after the p’th term, where p is the number of relevant principal components. The score matrix, α, which determines the contribution of each principal component to the spectrum, will have the dimension (p·n). This step reduces the size of the problem significantly, since all spectra are expressed in terms of a few (typically 5–8) basis functions and a “score vector” of p entries.
When expressed as linear combinations of the principal components Z(ν), similar spectra exhibit similar scores (α), which may be used to discriminate or group spectra. This is accomplished by plotting the values αi and αj (that is, the contribution of PCi and PCj to each spectrum) against each other. In these “scores plots”, shown in later figures, each data point represents one spectrum. If grouping is observed, there are quantifiable and significant variations in the spectra, which can be used to construct discriminant algorithms for distinguishing cell types, state of differentiation and maturation of cells, and disease.
3. Materials and methods
3.1. Specimen Collection
Voided urine samples were routinely collected using a “clean catch” methodology, whereby only midstream urine is captured. This procedure helps eliminate contamination from bacterial flora that is often present in washings collected from the distal urethra. In addition, specimens were only collected from male donors to alleviate possible contamination from vaginal or perineal squamous epithelial cells [19]. In this study, multiple samples were collected from four volunteers over a period of 3 months. To avoid degenerative cellular changes from proteolytic enzymes and bacterial cytolysins, specimens were immediately prepared for spectroscopic analysis. Cells were recovered from the urine using a membrane filtration technique. By use of a standard luer-lock syringe (30cc), urine was passed through a nylon net filter (11μm pore size, 47mm diameter; Millipore, Billerica, MA, USA) that was held within a polypropylene holder (47mm diameter, Millipore, Billerica, Ma, USA). This device allows diagnostic cells to be captured onto the nylon filter, whereas bacteria, erythrocytes and excess urine will pass the filter and be discarded. The nylon filter was then directly placed into a centrifuge tube (50ml) that contained 20ml of buffered formalin (10% formaldehyde in water) solution. The cellular material was shaken from the filter using a vortex mixer (American Scientific, McGraw Park, IL, USA) and the resulting solution was allowed to stand for 20 minutes, thus permitting fixation and further preservation of the cells. The filter was then removed using forceps and the remaining specimen centrifuged (600 g for 25 mins) to concentrate the diagnostic cells. After centrifugation the supernatant was decanted leaving approximately 1ml of solution at the bottom of the tube that was subsequently vortexed to allow the re-suspension of the cells. Each specimen was then effectively split into two individual samples, approximately 0.5 ml of the cell suspension being placed into two separate Cytospin (Thermo, Waltham, MA, USA) funnels, and centrifuged (1200 rpm, 10 mins) onto reflective substrates (Kevley Technologies, Chesterland, OH, USA). All prepared samples were then stored in a desiccator until spectroscopic analysis could be undertaken.
3.2. Instrumentation
Spectra were collected using a Perkin-Elmer (Perkin Elmer Corp, Sheldon, Connecticut) Spectrum One/Spotlight 300 Fourier Transform IR micro-spectrometer in single point mode. Detection is provided by a 100 × 100 μm2 photoconductive HgCdTe (MCT) detector, which covers the entire IR spectral range from 7000 to 650 cm−1. The objective provides an image magnification of 6x at a numerical aperture of 0.6. Visual image collection via a CCD camera is completely integrated with the microscope stage motion and IR spectra data acquisition.
Visible images of the deposited cells were collected under white light LED illumination, and “quilted” together to give a picture of the entire sample deposition area. Hundreds of individual cells were selected from this sample image on screen, and for each cell, the position, aperture size and aperture orientation are defined. Cell position and apertures were stored for each cell. The data acquisition of all stored positions is automatic. The microscope and the optical bench were continuously purged with purified, dry air. In addition, the sample area in the focal plane of the microscope was enclosed in a sample chamber, which was also purged. High quality optical images were collected using an Olympus Microscope (Model BX 51) equipped with a PixeLink (Model PL-A662) digital camera.
3.3. Spectroscopic Data Acquisition
Prepared reflective slides were placed onto the sample stage of the microscope and a visual image captured from the entire sample spot. This was directly referenced against an etched mark on the slide to enable the accurate relocation of cells after spectroscopic analysis and subsequent cytological staining. Reflectance – absorbance spectra were collected from 100 individual cells per slide using a point mapping method of data acquisition. Infrared micro-spectral data was collected using a fixed spatial resolution of 25 × 25 μm, co-adding 128 interferograms at 4 cm−1 spectral resolution. All collected spectra were fast Fourier transformed using Norton-Beer apodization to yield single beam spectra. An appropriate background spectrum was collected off the sample spot to ratio against the single beam spectra. The resulting ratioed spectra were then converted to absorbance. After spectroscopic analysis, sample slides were PAP stained using standard cytological protocols within our own laboratory. Cells that were examined spectroscopically were then relocated upon the slide and visual images captured at high magnification (40x) to allow cytological diagnosis.
3.4. Spectral Data Processing and PCA
All infrared micro-spectral data was uniformly pre-treated before undergoing further multivariate analysis. The wavenumber region used in the analysis was limited to only include intensity values recorded between 1800 and 950 cm−1. Spectra were also converted to 2nd derivatives since distorting mie scattering effects upon the baseline were evident in some spectra [20]. Finally, to negate intensity differences caused by irregularities in cell density, spectra were uniformly vector normalized. The dataset presented represents a small portion of our overall collected spectral library and comprises data from four different male donors. Only spectra of cells with a firm cytological diagnosis have been included in this analysis. These include both squamous epithelial cells from the distal portion of the urethra, and transitional (urothelial) epithelial cells that originate from the renal calyces, renal pelves, ureter, bladder and urethra [21]. All data processing and subsequent PCA analysis was performed using algorithms developed ‘in house’ that operate within MATLAB 7.2 (Mathworks, Natick, MA, USA).
4. Results and Discussion
Figure 1 displays photomicrographs captured from the three main types of epithelial cell identified in our urine sediments after PAP staining. Voided urine collected from healthy individuals for conventional urinalysis exhibit very small numbers of transitional (urothelial) epithelial cells [19]. Our spectroscopic studies would confirm this observation, having encountered a relatively small number of urothelial cells from our healthy male donors. A large variation in the overall amplitude of our spectra is also observed. Absorbance values recorded for the amide I band vary in intensity from 0.05 – 0.8 units. We believe that these variations are largely due to deviations in both cell thickness and the nucleus to cytoplasm ratio within the spatial area sampled [22, 23]. Spectra recorded from urothelial cells notably display particularly large absorbance intensities. This type of cell can range in size from c.a. 10 – 40 μm [19, 21] and typically feature large nuclei. We hypothesize that this observed intensity difference for urothelial cells is caused by both an increased cell thickness and a strong nuclear contribution to the spectra. Confocal Raman depth profiles collected from both squamous [9] and urothelial epithelial cells in the authors’ laboratory provide strong evidence to verify such assumptions. Despite the observed large variation in the overall intensity of the recorded spectra, correct statistical treatment of the data allows the common or diagnostic features of the spectra to be emphasized. For example, Figure 2 displays 100 spectra collected from individual squamous epithelial cells that were glycogen-free (based on the absence of glycogen-specific spectral features). The raw spectra were normalised such that the most intense spectral band (amide I) is set to one absorbance unit and the remaining spectrum scaled accordingly. As can now be seen, the normalised spectra display a common profile. Figure 3 presents results obtained from a PCA analysis of the entire spectral dataset that comprised both squamous and urothelial epithelial cells. The data set has been projected onto the second and third principal component dimensions where each dot represents an individual spectrum collected from a cell. As can be seen in the diagram, the main types of normal epithelial cell identified in the urine sediments divide into three clusters. The green cluster, representative of urothelial cells, displays a distinct separation from the squamous cells and indicates a substantial spectral difference among these cells. Furthermore, the glycogen rich (red) and glycogen absent (blue) squamous cells also display a good separation, with only a very small amount of overlap. Figure 4 displays the mean average absorbance spectra for these three correlating clusters or cell types. The application of vector normalisation rather than a min-max methodology (as detailed in Figure 2) to scale the data is distinctly beneficial since it allows relationships between the amide I spectral band and other molecular vibrations to be extracted by the multivariate analysis. As can be seen in the diagram, although the raw spectral data recorded for urothelial cells displayed a marked increase in their amide I intensities when compared to squamous cells, this normalisation routine has emphasised a more significant contribution in the low wavenumber region of the spectrum (>1300 cm−1) for this cell type. The appearance of shoulder peaks for both the amide I and amide II modes is also apparent for urothelial cells (green spectrum). Figure 5 alternatively shows the mean average 2nd derivative spectra for these three correlating clusters or cell types. The use of derivative spectra serves two purposes: they eliminate broad undulating baseline features caused by Mie scattering of the cell nuclei [20] and maximise the absence or presence of small shifts in band position or shoulder peaks. The red and blue profiles in the diagram characterize the glycogen rich and glycogen absent squamous cells respectively. These two spectra are almost identical and differ only in the low wavenumber region (>1200 cm−1) whereby the glycogen rich cells exhibit spectral bands characteristic for this moiety (marked by asterisks). The green profile describes the mean spectrum calculated for the urothelial cells. Within the spectral region marked A, distinct spectral differences are observed between the urothelial and squamous cell spectra. This region comprises both the amide I and amide II vibrational modes that are attributed to proteins and more readily emphasises the shoulder peaks previously identified in the mean absorbance spectrum for these cells. This would prove to highlight a significant change in the protein composition of these cells. Within the spectral region marked B, the profile is similar to that of the glycogen-free squamous cells (blue spectrum). However, the bands are far more pronounced and display a marked increase in their intensity. This region of the spectrum comprises vibrational modes that are attributed to the “phosphate” moiety, which refers to the phosphodiester linkage
Fig. 1.

Photomicrographs of the three main types of epithelial cell found in voided urine sediments (magnification: 40×). (a) Glycogen-free squamous epithelial cell (b) Glycogen-rich Squamous epithelial cell (c) Urothelial (transitional) epithelial cell.
Fig. 2.

Low wavenumber (1800-900 cm−1) infrared spectra of 100 glycogen-free squamous epithelial cells. The spectra have been normalized such that the most intense spectral band (amide I) is set to one absorbance unit and the remaining spectrum scaled accordingly.
Fig. 3.

“Scores Plot” (PC2 vs. PC3) obtained from the data set containing glycogen-free and glycogen-rich squamous and urothelial cells. Each infrared spectrum in the dataset is represented by an individual dot. Green dots represent urothelial epithelial cells, and the red and blue dots represent the glycogen-rich and glycogen-free squamous epithelial cells, respectively.
Fig. 4.

Mean second derivative spectra of the three epithelial cell types: glycogen-rich (red) and glycogen-free (blue) squamous epithelial cells, urothelial epithelial cells (green). The bands marked by asterisks are due to glycogen, whereas the band marked by (‡) is typical for phospholipids. The spectral region A displays the amide due to nucleic acids and phospholipids.
Fig. 5.

Mean spectra of the three epithelial cell types that were discriminated by Principal Component Analysis.
which is present in both phospholipids and nucleic acids. Taking into consideration the increased nucleus to cytoplasm ratio of urothelial cells, it would make cytological sense that this type of cell would display an increased contribution from DNA in their infrared spectrum [23]. However, an additional spectral band, which is marked by an asterisk in the diagram, is characteristic exclusively for phospholipids. This also displays quite a significant intensity and would make conclusions as to the direct origin of the increased phosphate absorptions hard to isolate. We speculate that this increased absorption identified for the phosphate spectral bands is due not only to an increased DNA contribution from the nucleus, but also from an increased number of phospholipids contained in a thickened cell membrane. We are presently undertaking Confocal Raman spectroscopic studies upon both squamous and urothelial epithelial cells to help verify this assumption. Nevertheless, these results clearly establish the ability of IR micro-spectroscopy to distinguish normal epithelial cell types found in human urine.
5. Spectroscopic Diagnosis Test
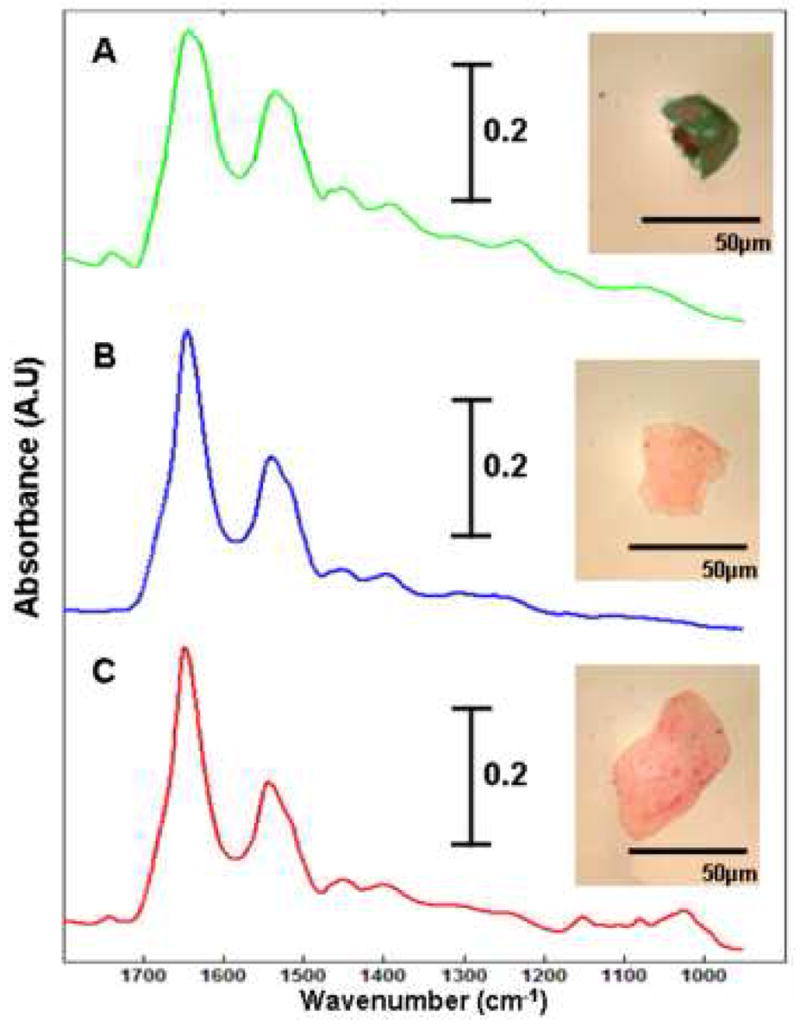
During this study, we have analysed a number of cells that could not be classified cytologically. These cells were often palely stained, appeared anucleated, and in some cases their cytoplasm was ruptured. There could be a variety of reasons for these degenerative changes, whether they be externally stimulated or induced internally. Nonetheless, conventional cytology requires both the nucleus to be clearly visible and the cytoplasm completely intact before a diagnosis can be made. Photomicrographs captured from 3 such cells are displayed in Figure 6 and are accompanied by their raw IR spectra. Cell A appears to have been ruptured, but displays a dark blue stained cytoplasm and a double nucleus that can sometimes be observed for urothelial cells. Cells B and C on the other hand are much larger and have been stained pale red, which is indicative for a mature squamous cell. But both appear to be anucleated and thus non-diagnostic. To test whether these cells could be characterised by IR micro-spectroscopy, we introduced 20 spectra recorded from such cells to our raw dataset. Our pre-processing routines were again applied to the updated raw dataset and a new PCA analysis undertaken, the results of which are displayed in Figure 7. The data has again been projected onto the second and third principal component dimensions and clearly shows that the overall structure of the dataset has not been significantly changed by the introduction of the new test cells. The urothelial, glycogen rich and glycogen absent squamous cells are again represented by the green, red and blue dots respectively. The test cells that were added to the dataset are represented by the black dots. As can be seen in the diagram, the test cells have not partitioned themselves into a separate cluster, but have instead aligned themselves within the 3 clusters that were originally identified. In addition, cells A – C, displayed in Figure 6, have been incorporated into the three separate clusters. Cell A has been partitioned into the green cluster of dots that is representative of urothelial cells. In contrast, cells B and C have been partitioned into the blue and red clusters respectively. Thus the analysis has not only rendered cells B and C to be squamous in origin, but provides information in terms of their glycogen content. Therefore, cells previously overlooked by cytologists due to bad staining or degenerative changes could be diagnosed using IR micro-spectroscopy. Initial results from this study are extremely promising and we are currently cataloguing the diagnosis of many thousands of recorded cell spectra to serve as input for supervised pattern recognition.
Fig. 6.
“Scores Plot” (PC2 vs. PC3) obtained from the data set containing glycogen-free and glycogen-rich squamous and urothelial cells (cf. Fig 3). The black dots represent 20 IR spectra collected from the test cells. Dots A – C correlate to the three test cells described in Figure 7.
Fig. 7.

Three of the cells that serviced as input for the spectroscopic diagnosis test. The infrared spectrum recorded from each cell is displayed with its respective photomicrograph. Cells A – C correlate to the three test cells displayed in Figure 6.
6. Conclusion
We demonstrated that infrared micro-spectroscopy can classify cell types found in normal urine on a cell-by-cell basis. The correlation between spectral and visual cytology is excellent, and extends to data sets much larger than the one reported here. Results for diseased cells, to be reported at a later stage, suggest that infrared micro-spectroscopy may become an auxiliary method for cytological diagnoses.
Acknowledgments
Partial support of this research from grant CA 090346 from the National Institutes of Health (to MD) is gratefully acknowledged.
Footnotes
Publisher's Disclaimer: This is a PDF file of an unedited manuscript that has been accepted for publication. As a service to our customers we are providing this early version of the manuscript. The manuscript will undergo copyediting, typesetting, and review of the resulting proof before it is published in its final citable form. Please note that during the production process errors may be discovered which could affect the content, and all legal disclaimers that apply to the journal pertain.
References
- 1.Papanicolaou GN, Traunt HF. Am J Obstet Gynecol. 1941;42:193. [Google Scholar]
- 2.Baker JJ. Cytopathol. 2002;27:185. doi: 10.1002/dc.10158. [DOI] [PubMed] [Google Scholar]
- 3.Wilbur DC. Pathol. 2002;118:339. [Google Scholar]
- 4.Stohler MH, Schiffman M. JAMA. 2001;285:1500– 1505. doi: 10.1001/jama.285.11.1500. [DOI] [PubMed] [Google Scholar]
- 5.Mango LJ, Valente PT. Acta Cyto. 1998;42:227. doi: 10.1159/000331551. [DOI] [PubMed] [Google Scholar]
- 6.Fetterman BJ, Pawlick GFK, Hartinger HJS, Gilbert C, Connell S. Acta Cyto. 1999;43:13. doi: 10.1159/000330862. [DOI] [PubMed] [Google Scholar]
- 7.Wong PTT, Wong RK, Caputo TA, Godwin TA, Rigas B. Proc Natl Acad Sci. 1991;88:10988. doi: 10.1073/pnas.88.24.10988. [DOI] [PMC free article] [PubMed] [Google Scholar]
- 8.Wong PTT, Wong RK, Fung MFK. Appl Spectrosc. 1993;47:1058. [Google Scholar]
- 9.Boydston-White S, Chernenko T, Regina A, Miljkovic M, Matthaus C, Diem M. Vib Spectrosc. 2005;38:169–177. [Google Scholar]
- 10.Matthaus C, Boydston-White S, Miljkovic M, Romeo M, Diem M. Appl Spectrosc. 2006;60:1–8. doi: 10.1366/000370206775382758. [DOI] [PMC free article] [PubMed] [Google Scholar]
- 11.Chalmers JM, Griffiths PR. Handbook of Vibrational Spectroscopy. Wiley; New York: 2002. [Google Scholar]
- 12.Diem M. Introduction to Modern Vibrational Spectroscopy. Wiley & Sons Inter-science; New York: 1993. [Google Scholar]
- 13.Mantsch HH, Jackson M. J Mol Struct. 1995;347:187. [Google Scholar]
- 14.Surewicz WKM, HH . Infrared Absorption Methods for Examining Protein Secondary Structure, Determination of Protein Structure in Solution by Spectroscopic Methods. Vol. 8. Willey; New York: 1994. [Google Scholar]
- 15.Colarusso P, Kidder LH, Levin IW, Fraser JC, Arens JF, Lewis EN. Appl Spectrosc. 1998;52:106A. [Google Scholar]
- 16.Jackson M, Mantsch HH. Infrared Spectroscopy: Ex Vivo Tissue Analysis, Encyclopedia of Analytical Chemistry. Vol. 1. Wiley; Chichester: 2000. [Google Scholar]
- 17.Diem M, Boydston-White S, Chiriboga L. Appl Spectrosc. 1999;53:148A–161A. [Google Scholar]
- 18.Joliffe IT. Principal Component Analysis. Springler-Verlag; New York: 1986. [Google Scholar]
- 19.Brunzel NA. Fundamentals of Urine and Body Fluid Analysis. W.B. Saunders Company; Philidelphia: 1994. [Google Scholar]
- 20.Mohlenhoff B, Romeo M, Diem M, Wood BR. Biophys J. 2005;88:3635–40. doi: 10.1529/biophysj.104.057950. [DOI] [PMC free article] [PubMed] [Google Scholar]
- 21.Rathert P, Roth S, Soloway MS. Urinary Cytology, Manual and Atlas. 2. Springer-Verlag; New York: 1991. [Google Scholar]
- 22.Romeo M, Mohlenhoff B, Jennings M, Diem M. Biochim Biophys Acta. 2006;1758:915–22. doi: 10.1016/j.bbamem.2006.05.010. [DOI] [PMC free article] [PubMed] [Google Scholar]
- 23.Romeo M, Mohlenhoff B, Diem M. Vib Spectrosc. 2006;42:9–14. doi: 10.1016/j.vibspec.2006.04.009. [DOI] [PMC free article] [PubMed] [Google Scholar]