Abstract
This paper reviews the temporal trends in sexually transmitted diseases (STDs) and discusses the factors affecting the epidemiology of bacterial STDs.
Among the industrialised countries, the USA has a relatively high incidence and prevalence of sexually transmitted diseases (STDs), and there is considerable geographical race/ethnic heterogeneity in the patterns and distribution of these conditions. Temporal trends in reported STDs have also varied considerably over the past five decades. The US STD prevention and control system – a federalised system which depends on the states for implementation of prevention programmes – has been remarkably successful in some domains and less so in others.
In general, data on reported STDs in the USA showed steady increases during the 1960s, with a levelling off or decline of most of the bacterial STDs but continual increases in viral STDs and genital chlamydial infections during the 1970s and 1980s. National reports of gonorrhoea and syphilis began declining at different times and at different rates in all industrialised countries during the late 1980s and 1990s. During this time, the male to female rate ratio for these conditions also declined, suggesting improvements in prevention and control efforts and reductions in disease incidence among men who have sex with men (MSM). Chlamydia diagnoses and prevalence have varied over time, in part reflecting the impact of chlamydia control programmes in many jurisdictions. However, since the turn of this century, a number of these declining trends have reversed.
In this article we review the temporal trends in STDs and briefly discuss factors influencing the epidemiology of bacterial STDs. A major part of this review is based on surveillance summaries; the discussion of factors influencing the epidemiology of STD is based on selected references. No formal literature search was conducted for this review.
Gonorrhoea
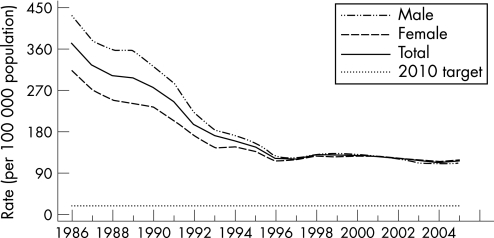
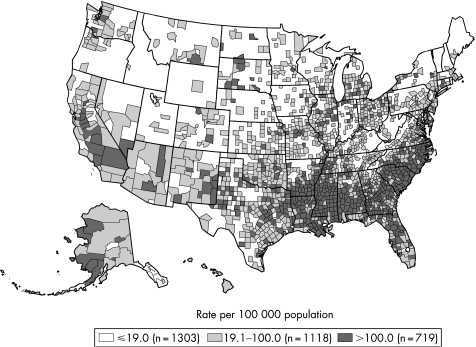
In the USA, reported gonorrhoea rates declined 74% from 1975 to 1997 and subsequently plateaued for nearly a decade.1 In 2005, 339 593 cases of gonorrhoea were reported, corresponding to a rate of 115.6 per 100 000 population – a 2.8% increase from 2004. In 2005 the southern USA had the highest rate of gonorrhoea in the country, although between 2001 and 2005 the rate of gonorrhoea in the south declined by 17.6% from 174.6 to 143.9 per 100 000 population while that in the west increased by 35.4% from 60.2 cases per 100 000 population to 81.5 cases in 2005 (figs 1 and 2). The rates of gonorrhoea in women were slightly higher than in men in 2005 (119.1 vs 111.5 per 100 000 population), and are highest among women aged 15–19 years and men aged 20–24 years. Although the rate of gonorrhoea in individuals aged 15–19 years has decreased in recent years, this rate increased 3.9% between 2004 and 2005 from 421.9 per 100 000 population to 438.2 per 100 000 population. In 2005, African‐American females aged 15–19 years had the highest rate of gonorrhoea among all age and race/ethnicity groups (2814 cases per 100 000 population). The rates of gonorrhoea among African‐American men and women declined from 2001 to 2005 by 19.4% and 16.1%, respectively. Conversely, rates of gonorrhoea in white men and women increased from 2001 to 2005 by 18.9% and 20.4%, respectively.
Figure 1 Gonorrhoea rates: total and by sex, United States, 1986–2005 and the Healthy People 2010 target. Note: The Healthy People 2010 target for gonorrhoea is 19.0 cases for 100 000 population. Source: Centers for Disease Control and Prevention.1
Figure 2 Gonorrhoea rates by county, United States, 2005. Note: The Healthy People 2010 target for gonorrhoea is 19.0 cases for 100 000 population. Source: Centers for Disease Control and Prevention.1
Influence of sociodemographic factors on gonorrhoea morbidity: mechanisms of action
Both socioeconomic status and racial ethnic background are highly correlated with gonorrhoea morbidity.2,3,4 In the USA, gonorrhoea ranked first among notifiable diseases with largest racial disparities in 2002 with a black/white rate ratio of 24.2.5 Moreover, racial differences in STDs persist after controlling for indicators of socioeconomic status.6,7,8 Recent research has focused increasingly on the reasons for racial, ethnic and socioeconomic disparities. Sexual mixing patterns are segregated by race and socioeconomic status.9,10 In addition, racial and ethnic minorities in the USA are more likely to mix (sexually) with others from other risk groups than their own.10 The combination of assortative mixing by race (and probably socioeconomic status) and disassortative mixing by risk group10 may result in very high rates of all STDs including gonorrhoea.8 Individual behaviours do not account for the disparities; in the USA, while young white adults are at an increased risk of STD and HIV when they engage in high‐risk behaviours, young black adults are at high risk even when their behaviours are normative.8 Interestingly, evidence suggests that socioeconomic status, like risk behaviours, may be more strongly associated with STD among white populations than in African‐American populations.7,10
Residential segregation patterns may also contribute to sociodemographic disparities in gonorrhoea and other STDs. In fact, segregation in sexual mixing patterns and residential patterns may interact so as to have a multiplicative impact on racial ethnic disparities in gonorrhoea rates and rates of other STDs. The segregation of sexual networks is in part a function of the availability of sexual partners which has a significant geographical component that reflects patterns of social and residential interaction.11,12,13,14,15 Research using cluster detection analysis to identify critical STD transmission locations suggests that risks for gonorrhoea are associated with definable sociogeographical spaces and statistically significant geographical clustering of reported gonorrhoea cases in Baltimore after adjustment for African‐American race/ethnicity. These findings suggest that both residential patterns and sex partner preferences may act as macroboundaries to sexual network formation. This pattern may apply to both racial/ethnic and socioeconomic characteristics and may help account for both types of disparities in gonorrhoea and other STDs.16,17
As the prevalence and incidence of gonorrhoea become concentrated in particular populations, issues of “elimination, introduction and reintroduction of infection” become important. Spatial bridging—sexual mixing between distant geographical areas—may represent an important mechanism of introduction and channel of transmission between geographical areas.18 Since sexual mixing tends to be assortative with respect to race/ethnicity and socioeconomic status, spatial bridging may contribute to sociodemographic disparities in gonorrhoea morbidity across local areas.
Recent research which combines molecular typing of Neisseria gonorrhoeae and contact tracing has shown a potentially powerful approach to the identification of sexual networks in metropolitan areas.19 Issues of spatial and other types of bridging, sexual mixing and introduction of distinct strains of gonorrhoea into specific networks and local areas may be further explored in the near future through this approach.
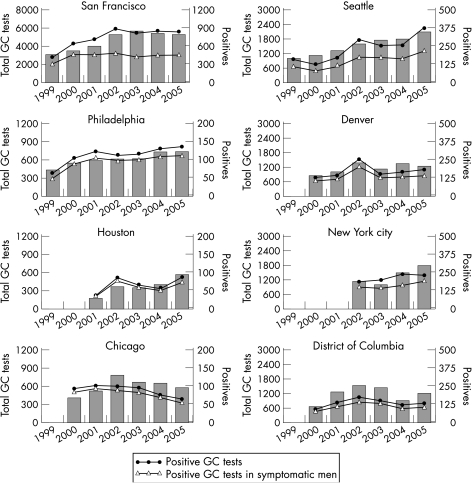
The incidence of gonorrhoea in MSM, which had declined remarkably in response to the HIV epidemic, started increasing in discrete local areas in the early to mid 1990s.2 Data from several US cities and projects, including the Gonococcal Isolate Surveillance Project (GISP), suggest that an increasing number of MSM have been acquiring STDs in recent years.20,21 Recent reviews of empirical evidence describing changing patterns of sexual behaviour among gay and bisexual men in Europe, Canada, USA and Australia suggest a substantial increase in high‐risk behaviour among gay men since 1996.22 The increased risk‐taking may have started to level off in some cities in 2006. The most reliable evidence on STDs among MSM in the USA is provided by the MSM Prevalence Monitoring Project which includes data from six public STD clinics and three STD clinics in community based gay men's health clinics.1 From 1999 to 2005 the number of gonorrhoea tests for all anatomical sites has increased. The trend in the number of positive gonorrhoea tests for all anatomical sites has varied by city (fig 3). In 2005, 78% of MSM attending Prevalence Monitoring Project sites were tested for urethral gonorrhoea, 26% were tested for rectal gonorrhoea and 26% were tested for pharyngeal gonorrhoea.1 In 2005, median clinic urethral gonorrhoea positivity in MSM was 11%, median rectal gonorrhoea positivity was 8% and median pharyngeal gonorrhoea positivity was 7%. The increase in STD acquisition among MSM appears to result from multiple factors including the increased frequency of HIV sero‐concordant sex partner recruitment for unprotected sex on the internet. This practice minimises the risk of HIV transmission to uninfected individuals but increases the risk of transmission of other STDs.22 Sexually transmitted diseases and the behaviours associated with acquiring them increase the likelihood of acquiring and transmitting HIV infection. Consequently, concerns have been expressed about the association between rising STDs among MSM and increases in the incidence of HIV in this group.22
Figure 3 MSM Prevalence Monitoring Project: number of gonorrhoea (GC) tests and number of positive tests in men who have sex with men (MSM), STD clinics, 1999–2005. The bars represent the number of gonorrhoea tests to all anatomical sites (pharyngeal, rectal, and urethral) each year. The scales on the left and right axis differ: the bar graphs use the scale on the left and the line graphs use the scale on the right. Source: Centers for Disease Control and Prevention.1
In the USA, β‐lactamase‐producing strains of N gonorrhoea were first isolated in 1976. In 1980, however, β‐lactamase‐producing strains started to increase; the total number of reported cases exceeded 4500 by 1982,23 and the number of reported cases began to increase sharply after 1984. As the incidence of infections with β‐lactamase‐producing strains of N gonorrhoeae increased, the epidemiology changed. Overseas travel and contact with female sex workers were identified as important risk factors in early outbreaks but, once β‐lactamase‐producing gonococci became endemic, their distribution came to parallel that of endemic antibiotic‐sensitive gonorrhoea, predominantly involving inner city residents, members of ethnic minority groups and heterosexuals.24,25
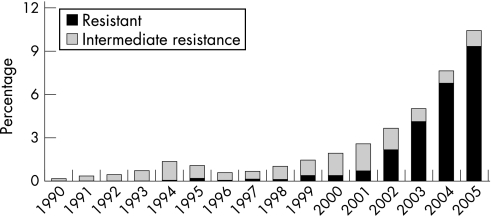
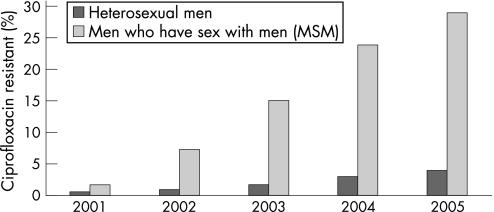
During the 1990s the levels of gonococcal antimicrobial resistance in the USA were generally stable, with about one‐third of isolates resistant to penicillin or tetracycline, higher than in some other industrialised countries.26 The emergence of reduced susceptibility to ciprofloxacin has been a concern27 and, by early 2004, fluoroquinolones were no longer recommended as first‐line treatment for MSM. In 2006 there was considerable geographical variation in the prevalence of fluoroquinolone resistance in the USA for heterosexuals, with the highest rates being in the west. In GISP, the proportion of isolates among MSM that were resistant to ciprofloxacin increased again in 2005 to 29%. Among heterosexuals the proportion of resistant isolates was 3.8% in 2005, up from 2.9% in 2004 (figs 4 and 5).
Figure 4 Gonococcal Isolate Surveillance Project (GISP): percentage of Neisseria gonorrhoeae isolates with resistance or intermediate resistance to ciprofloxacin, 1990–2005. Resistant isolates have ciprofloxacin minimum inhibitory concentrations (MICs) ⩾1 μg/ml. Isolates with intermediate resistance have ciprofloxacin MICs of 0.125–0.5 μg/ml. Susceptibility of ciprofloxacin was first measured in GISP in 1990. Source: Centers for Disease Control and Prevention.1
Figure 5 Gonococcal Isolate Surveillance Project (GISP): percentage of Neisseria gonorrhoeae isolates with resistance to ciprofloxacin by sexual behaviour. Source: Centers for Disease Control and Prevention.1
Syphilis
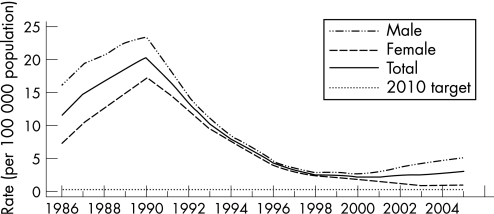
Reported diagnoses of syphilis may fluctuate more dramatically than gonorrhoea with changes in the sexual behaviours of populations and risk groups. In the USA, following World War I, syphilis diagnoses fell rapidly, reflecting improved control measures brought about by the increased availability of improved diagnostic tests and the arsenicals. After a brief rise during and just after World War II, diagnoses fell again, coinciding with the introduction of penicillin and even more effective antimicrobial control. Diagnoses rose again during the sexual revolution of the early 1960s and, unlike gonorrhoea, continued to increase after 1970s, with epidemic spread among MSM until the emergence of AIDS in 1981. During the 1980s and early 1990s, reflecting AIDS‐related changes in behaviour and the differential mortality among MSM, the rates of primary and secondary syphilis declined, particularly among MSM.2 Increases in primary and secondary syphilis reports between 1986 and 1990 occurred mainly among minority heterosexual populations and were concurrent with the crack cocaine epidemic in many urban centres. The rates of reported primary and secondary syphilis again plummeted following the institution of public health measures28 and the declines continued during the 1990s so that, by the year 2000, the lowest reported rates of primary and secondary syphilis since 1941 were recorded (fig 6).1 The low rate of infectious syphilis and the concentration of most syphilis cases in a small number of geographical areas in the country led to the development of the CDC's National Plan to Eliminate Syphilis. The plan was first established in 1999 and was revised in 2006.1
Figure 6 Primary and secondary syphilis rates: total and by sex, United States, 1986–2005 and the Health People 2010 target. Note: The Healthy People 2010 target for primary and secondary syphilis is 0.2 case per 100 000 population. Source: Centers for Disease Control and Prevention.1
The more recent trends in syphilis show great geographical and racial/ethnic heterogeneity. The rates of primary and secondary syphilis declined by 89.7% between 1990 and 2000; however, the rate increased between 2001 and 2005, primarily among men. In 2005, for the first time in over 10 years, the rate of primary and secondary syphilis among women increased from 0.8 cases per 100 000 population in 2003 and 2004 to 0.9 cases per 100 000 population. In 2005, 8724 cases of primary and secondary syphilis were reported to the CDC, a 9.3% increase from 7980 in 2004. The rate of primary and secondary syphilis increased by 11.1% (from 2.7 cases per 100 000 population in 2004 to 3.0 cases per 100 000 population in 2005), and increases occurred in most age groups.1 In 2005, half the total number of primary and secondary syphilis cases was reported from 19 counties and two cities, while 77.5% of 3140 counties in the USA reported no cases of primary and secondary syphilis. The proportion of primary and secondary syphilis cases reported from sources other than STD clinics increased from 25.6% in 1990 to 68.7% in 2005.
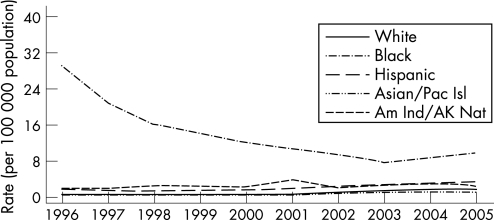
From 2004 to 2005, rates of primary and secondary syphilis increased by 12.5% , 11.4% and 6.5% among non‐Hispanic white individuals, African‐Americans and Hispanics, respectively. Most of the increases were among men.1 In 2005 the rate of primary and secondary syphilis reported among African‐Americans (9.8 cases per 100 000) was 5.4 times higher than among non‐Hispanic white individuals (1.8 cases per 100 000 population) (fig 7). In 1997 the incidence of primary and secondary syphilis among African‐Americans was 44 times higher than in non‐Hispanic white people,2 indicating major declines in racial ethnic disparities in syphilis morbidity in the USA. In 2005, primary and secondary syphilis rates were highest among non‐Hispanic white, African‐American and Hispanic women aged 20–24 years; among men, the rates were highest among African‐Americans aged 25–29 years and non‐Hispanic whites and Hispanics aged 35–39 years. The older age groups among the latter racial ethnic categories may reflect higher proportions of MSM in these subpopulations. In 2005, the overall rate of congenital syphilis was 8 per 100 000 population, a decline of 12.1% compared with the previous year. Between 1996 and 2005 the average yearly percentage decrease in the rate of congenital syphilis was 14.1%.
Figure 7 Primary and secondary syphilis: rates by race/ethnicity, United States, 1996–2005. Pac Isl, Pacific Islander; Am Ind, American Indian; AK Nat, Alaskan National. Source: Centers for Disease Control and Prevention.1
Influences of sociodemographic factors on syphilis morbidity
In the USA, increases in syphilis among MSM have been associated with high‐risk sexual behaviour and high rates of HIV co‐infection.29,30,31 Internet‐based sex partner recruitment for unprotected sex has emerged as an important risk factor for increases in syphilis among MSM.32,33 Among heterosexuals, particularly in urban areas and in the southern USA, syphilis morbidity has been associated with race/ethnicity assortative and risk group dissortative sexual mixing,10 incarceration,34 concurrent partnerships34,35 and culturally unacceptable prevention services. Societal parameters that have been associated with syphilis in the past are undergoing worrisome trends and are likely to adversely impact future epidemic trends. In 2000, 65% of black male high school dropouts in their 20s were jobless (unable to find work, not seeking work or incarcerated). By 2004, 72% of black male high school dropouts in their 20s were jobless compared with 34% of white and 19% of Hispanic dropouts. As of 2004, 7% of white people, 12% of black people and 24% of Hispanics aged 16–24 years were not enrolled in school and had not completed high school. Incarceration rates have reached historic highs; in 2004, 21% of black men who did not attend college were incarcerated.36
Role of immunity in temporal syphilis trends
Partial immunity may be an additional factor to consider among influences that affect trends in the incidence of syphilis.37,38,39 Mathematical modelling work based on data from cities in the USA over 50 years revealed that syphilis infection follows a natural cycle that peaks at 8–11 year intervals, suggesting a role for increasing and declining immunity. The same work also revealed that, since the early 1980s, syphilis rates in different cities rise and fall at the same time rather than varying independently as they did earlier. This observation points to the emergence of spatially bridged sexual networks, at least among MSM.37
Chlamydia trachomatis infections
Chlamydia trachomatis is still the most prevalent sexually transmitted bacterial infection in the USA.1 It is difficult to describe temporal trends in the incidence of chlamydial infection because of the large proportion of asymptomatic infections, the use of increasingly sensitive nucleic acid amplification diagnostic tests, the expansion of chlamydia screening activities, the increased emphasis on case reporting by providers and the improvements in the information systems for reporting.
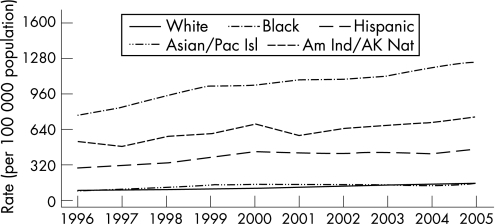
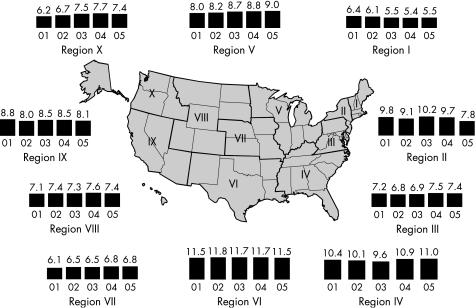
By 2000, all 50 states in the USA and the District of Columbia had regulations requiring the reporting of chlamydia cases. From 1986 to the end of 2005, the rates of reported chlamydia infection increased from 35.2 per 100 000 to 332.5 per 100 000 population (fig 8). In 2005, the rate of reported chlamydia infection among women was more than three times higher than the rate among men, largely reflecting the greater number of women screened for chlamydia. However, use of nucleic acid amplification tests, particularly on urine, increasingly facilitates the identification of men with asymptomatic infection. From 2001 to the end of 2005, the rates of reported chlamydia infection in men increased by 43.5% from 112.3 to 161.1 cases per 100 000 men. During the same period the rates in women increased only by 15.6%, from 429.6 to 496.5 cases per 100 000 women.1 Since 1996, chlamydia rates have increased for all racial/ethnic groups (fig 9). In 2005 the rate of chlamydia among the black population was over eight times higher than that of the white population (1247.0 and 152.1 cases per 100 000, respectively). The rates among American Indian/Alaska Natives (748.7 per 100 000) and Hispanics (459.0 per 100 000) were also higher than that of the white population. In 2005 the highest rates of reported chlamydia among women were in those aged 15–19 years (2796.6 cases per 100 000) and 20–24 years (2691.1 cases per 100 000). Age‐specific rates among men were highest in the 20–24 year age group (804.7 cases per 100 000). Initiated in 1988 and expanded in 1993, the US chlamydia screening and prevalence monitoring project provides chlamydia test positivity data for all 10 of the Health and Human Services regions. In 2005, the median state‐specific chlamydia test positivity among women aged 15–24 years tested during visits to selected family planning clinics in all states and outlying areas was 6.3%. Chlamydia test positivity has remained stable within regions between 2001 and 2005, even after adjusting to account for changes in laboratory test methods and associated increases in sensitivity (fig 10).
Figure 8 Chlamydia rates: total and by sex, United States, 1986–2005. As of January 2000, all 50 states and the District of Columbia had regulations requiring the reporting of chlamydia cases. Source: Centers for Disease Control and Prevention.1
Figure 9 Chlamydia rates by race/ethnicity, United States, 1996–2005. Pac Isl, Pacific Islander; Am Ind, American Indian; AK Nat, Alaskan National. Source: Centers for Disease Control and Prevention.1
Figure 10 Chlamydia trends in positivity among women aged 15–24 years tested in family planning clinics by Health and Human Services (HHS) region, 2001–5. Note: Trends adjusted for changes in laboratory test method and associated increases in test sensitivity. Source: Regional Infertility Prevention Projects, Office of Population Affairs, Local and State STD Control Programs, Centers for Disease Control and Prevention.
Given the frequently asymptomatic nature of infections, our understanding of the epidemiology of chlamydia has been greatly enhanced by population‐based prevalence studies. In the USA, data collected between 1999 and 2002, representing the non‐institutionalised civilian population aged 14–39 years, included urine samples tested for chlamydia using the Lcx assay (Abbot Laboratories, Abbot Park, Illinois, USA). The prevalence of chlamydia was 2.2% and was similar in men and women. In women the highest prevalence was among those aged 14–19 years (4.6%) and in men the highest prevalence was in those aged 20–29 years (3.2%) (unpublished data). The prevalence was higher among non‐Hispanic black individuals (6.4%) than in non‐Hispanic white individuals (1.5%). Among the non‐Hispanic black population aged 14–19 years, the prevalence of chlamydia was 11.1%. In another representative sample of US men and women aged 18–26 years in 2001–2, the prevalence of chlamydia was measured using first void urine specimens and ligase chain reaction assay.40 The overall prevalence of chlamydial infection was 4.19%, with women (4.74%) being more likely to be infected than men (3.67%). The prevalence of chlamydial infection was highest among black women (13.95%) and black men (11.12%); lowest prevalences were found in Asian men (1.14%), white men (1.38%) and white women (2.52%). The prevalence of chlamydial infection was highest in the south (5.39%) and lowest in the northeast (2.39%).
Chancroid
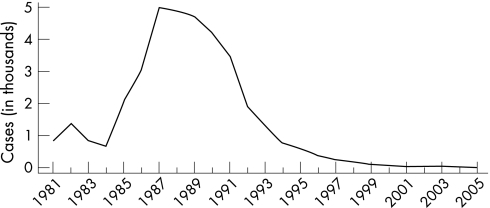
Once endemic in Europe and North America, chancroid began a steady decline early in the 20th century before the discovery of antibiotics. Social changes including changes in patterns of commercial sex may have disrupted the conditions necessary to sustain chancroid as an endemic disease. Sporadic outbreaks can be easily controlled through effective curative and preventive services provided to sex workers and their clients. In the USA, reported cases of chancroid since 1987 declined steadily until 2001 when 38 cases were reported (fig 11).1 In 2005 only 17 cases of chancroid were reported, with only 10 states and one outlying area reporting one or more cases. While these trends are encouraging, it is important to note that Haemophilus ducreyi, the causative agent of chancroid, is difficult to culture and chancroid cases may be underdiagnosed. Nevertheless, passive and active surveillance for this condition among MSM in the USA have yet to uncover substantial disease. Further monitoring and vigilance will be required, especially given the context of rises in other reported STDs among MSM.
Figure 11 Chancroid reported cases, United States, 1981–2005. Source: Centers for Disease Control and Prevention.1
Vaginal trichomoniasis and other vaginal infections
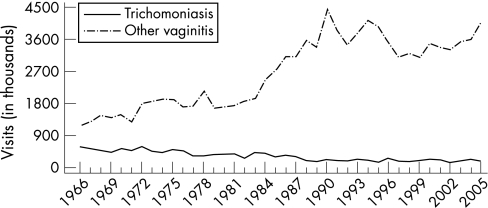
Case reporting data for vaginal trichomoniasis and other vaginal infections are not available in the USA. Trend data are limited to estimates of initial visits to physicians' offices for these conditions from the National Disease and Therapeutic Index (NDTI).1 These estimates suggest that the incidence of trichomoniasis has declined from an estimated 579 000 in 1966 to 190 000 in 1988 and has remained relatively unchanged since then; there were 165,000 visits in 2005 (fig 12). During the same period, initial visits for other vaginal infections of undefined aetiology increased from an estimated 1 155 000 in 1966 to 4 474 000 in 1989, declined irregularly to 3 100 000 in 1997, but has been increasing irregularly since then; there were 4 071 000 visits in 2005.1
Figure 12 Trichomoniasis and other vaginal infections in women: initial visits to physicians' offices, United States, 1966–2005. The relative standard error for trichomoniasis estimates range from 7.5% to 13% and for other vaginitis estimates range from 16% to 30%. Source: National Disease and Therapeutic Index (IMS Health).
A recent analysis estimated the prevalence of Trichomonas vaginalis from a nationally representative sample of women in the USA.41 Women aged 14–49 years participating in the National Health and Examination Survey (NHANES) cycles 2001–4 provided self‐collected vaginal swabs. Vaginal fluids extracted from the swabs were evaluated for T vaginalis using PCR. The overall prevalence of T vaginalis was 3.1%; it was highest among non‐Hispanic black women (13.3%) and lower among Mexican Americans (1.8%) and non‐Hispanic white women (1.3%). Factors associated with an increased risk for T vaginalis in multivariable analyses included non‐Hispanic black race/ethnicity, being born in the USA, greater numbers of lifetime sex partners, increasing age, lower educational attainment, poverty and douching.
Another recent analysis estimated the prevalence of trichomoniasis in young adults (mean age 22 years) in the USA using data from the National Longitudinal Study of Adolescent Health.42 In this study the estimated overall prevalence of trichomoniasis was 2.3%, slightly higher in women (2.8%) than in men (1.7%). The prevalence increased with age and varied by region, with the southern USA having the highest prevalence (2.8%). It was highest among black women (10.5%) and lowest among white women (1.1%). In men the prevalence was highest among Native Americans (4.1%) and black people (3.3%), and lowest among white men (1.3%).42
Genital herpes
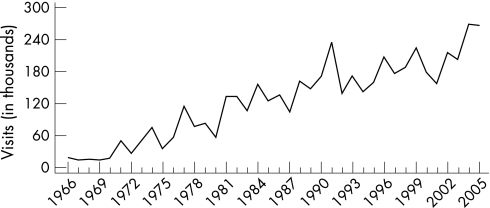
In the USA, reports of genital herpes simplex virus (HSV) infection increased rapidly from the mid 1960s until the onset of the AIDS epidemic. The annual number of patient consultations with private physicians in office practice for newly diagnosed symptomatic genital herpes in the USA increased 12.5‐fold from 18 000 in 1966 to over 225 000 visits in 1990, and then declined irregularly to 167 000 in 1997. People aged 20–29 years had more office visits than other age groups. Women outnumbered men in genital herpes‐related physician consultations, reflecting either true gender differentials in the incidence of genital herpes or differences in healthcare‐seeking behaviour.2
During the 1970s and 1980s, media attention may have increased both physicians' and patients' awareness of the signs and symptoms of genital herpes, thus increasing the proportions of patients with genital herpes who sought physician consultations and received a correct diagnosis.43 However, based on the percentage of adults with serum antibody, the true annual incidence of new HSV‐2 infections in the USA clearly exceeds the number of physician consultations for newly diagnosed symptomatic genital infections by several fold. Since 1997, genital herpes‐related visits to physicians' offices first increased until 1999 to 224 000, then declined to 216 000 in 2002, but since then they have been increasing with 266 000 visits in 2005 (fig 13).
Figure 13 Genital herpes: initial visits to physicians' offices, United States, 1966–2005. The relative standard error for genital herpes estimates range from 20% to 30%. Source: National Disease and Therapeutic Index (IMS Health).
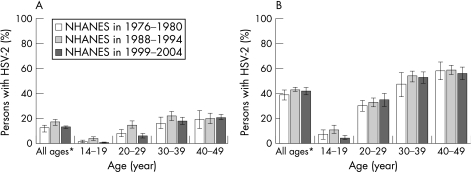
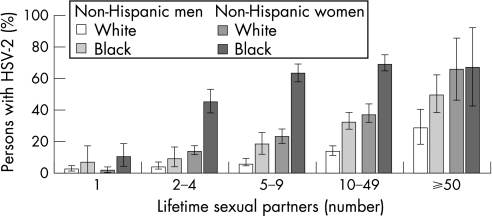
The most recent data on HSV‐2 seroprevalence in the USA were collected in a stratified random sample of the US population through the National Health and Nutrition Examination Survey (NHANES) in 1988–94 and in 1999–2004.44 Persons aged 14–49 years were included in the analyses. The overall age adjusted HSV‐2 seroprevalence was 17.0% in 1999–2004 compared with 21.0% in 1988–94, representing a relative decline of 19% between the two surveys. Decreases in HSV‐2 seroprevalence were concentrated in persons aged 14–19 years between 1988 and 2004. In adolescents aged 17–19 years and in young adults, the decreases were significant even after adjusting for changes in sexual behaviours. The seroprevalence of HSV‐1 decreased from 62% to 57.7% between the two surveys, a relative decrease of 6.9%. However, the percentage of genital herpes caused by HSV‐1 may be increasing. The seroprevalence of HSV‐2 was higher among women, non‐Hispanic black people, those aged 40–49 years, widows and divorcees, those in greater poverty, those with higher education, those who reported ever using cocaine and those who reported earlier age of sexual debut (fig 14). The seroprevalence of HSV‐2 increased with reported number of lifetime sex partners (fig 15). These findings may mark a reversal in the trajectory of increasing HSV‐2 seroprevalence in the USA.
Figure 14 Herpes simplex virus type 2 (HSV‐2) seroprevalence in (A) non‐Hispanic white people and (B) non‐Hispanic black people by age on the National Health and Nutrition Examination Survey (NHANES) in 1976–80, 1988–94 and 1999–2004. Note: The percentage of persons is weighted. Error bars indicate 95% confidence intervals. *Age‐adjusted using the 2000 US census civilian, non‐institutionalised population aged 14–49 years as the standard. Source: Xu et al.44
Figure 15 Age‐adjusted herpes simplex virus type 2 (HSV‐2) seroprevalence according to the lifetime number of sex partners by race/ethnicity and sex on the National Health and Nutrition Examination Survey (NHANES) in 1999–2004. Note: Error bars indicate 95% confidence intervals. Source: Xu et al.44
Genital human papillomavirus infections
The associations between certain types of human papillomavirus (HPV) and precancerous or invasive lesions of the cervix, vagina, vulva, anus and penis have been clearly documented and, as a result, interest in and awareness of genital HPV infections have increased. At present, genital HPV infections appear to be the most prevalent STD in the USA. HPV infections are far more often subclinical than associated with lesions recognised by the infected individual. Acquisition of HPV is very common among sexually active young adults. Studies of college students in the UK and USA have found the cumulative incidence of HPV to be around 43–44% over 3 years and around 60% over 5 years after sexual debut. Risk factors for HPV infection include increased number of sex partners, increased number of male partners' lifetime partners, a short time interval between meeting a partner and engaging in sexual intercourse, increased age difference between partners and current smoking.45
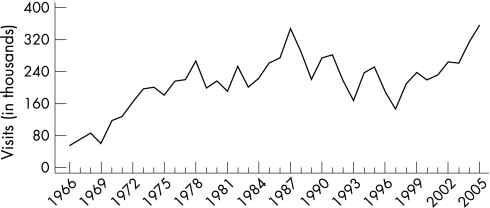
In the USA, initial visits to physician offices for genital warts increased from 55 695 in 1966 to over 351 370 in 1987. From 1987 to 1997, initial visits to physicians' offices declined to around 145 000 and, since 1997, initial visits to physicians' offices for genital warts have increased irregularly and reached an all time high of 357 000 visits in 2005 (fig 16). The extent to which this rise and fall represents the natural history of the spread of the epidemic of HPV 6 and 11 through the US population rather than changes in seeking health care or diagnosis or a rise and fall in risk‐taking behaviours remains undefined.
Figure 16 Genital warts: initial visits to physicians' offices, United States, 1966–2005. The relative standard error for genital warts estimates range from 20% to 40%. Source: National Disease and Therapeutic Index (IMS Health).
STDs in special populations
Special population subgroups are disproportionately affected by STDs in most countries all over the world. Very high rates of some STDs, sometimes including HIV infection, have been reported among sex workers in the USA.46 More recently, among 227 drug‐injecting MSM recruited from the streets in San Francisco, California between January 2000 and November 2001, 68% reported being paid by another man for sex and the prevalence of HIV was 12%.47
Many studies have shown a high prevalence of STDs among persons entering jails and juvenile detention facilities.48,49,50,51 In some locations a substantial proportion of all early syphilis cases are reported from correction facilities.51 Chlamydia and gonorrhoea screening and treatment in jails may lead to reductions of chlamydia and gonorrhoea in the community.52 In 2005, STD screening data from corrections facilities were reported from 32 states for chlamydia, 29 states for gonorrhoea and 13 states for syphilis as part of the Corrections STD Prevalence Monitoring Project.1 Among adolescent women entering 57 juvenile corrections facilities, the median chlamydia positivity by facility was 14.2%. Positivity in women was uniformly higher than in men. In adolescent men entering 87 juvenile corrections facilities, the median chlamydia positivity was 6%. In women entering 38 adult corrections facilities, the median positivity for chlamydia was 7.4%. In men entering 41 adult corrections facilities, the median chlamydia positivity was 8.1%.
For gonorrhoea, the median positivity by facility for women entering 38 juvenile corrections facilities was 4.7%. The median positivity for gonorrhoea in men entering 65 juvenile corrections facilities was 1.0%. In women entering 33 adult facilities, the median positivity by facility was 2.8%. In men entering 35 adult corrections facilities, the median gonorrhoea positivity was 2.3%. These high positivity rates suggest that persons entering corrections facilities may comprise an important special population for STD prevention interventions.
STDs including HIV infection are major health problems among migrant workers.53,54 Limited access to health care, language and cultural barriers, and limited economic resources combined with sexual behaviours that expose migrant workers to high‐risk partners tend to perpetuate high levels of STD morbidity among this group.55,56
Finally, one assessment of the incidence and prevalence of STDs among homeless adolescents in a large north‐western US city showed a baseline prevalence of chlamydia of 4.17% for men and 6.3% for women. The prevalence of HSV‐2 was 5.7% for men and 12.5% for women, and the prevalence of hepatitis B virus and hepatitis C virus were 3.6% and 5.0% respectively. HIV seroprevalence was 0.3%. The incidence of sexually transmitted infections was significantly higher in women than in men (16.7% vs 9.8% per year) and was associated with inconsistent condom use and, for women, number of partners and sex with older partners. The incidence of HSV‐2 in women was over 25% and the incidence of chlamydial infection was 12%. Incident hepatitis B virus and hepatitis C virus infection rates were 3.4% and 6.6%, respectively, and both were associated with injection drug use.57 Another assessment of homeless adolescents in Denver, Colorado found a chlamydia prevalence of 11.6% and a gonorrhoea prevalence of 2.7%. Among first testers, 13% were positive for chlamydia and 3.7% were positive for gonorrhoea.58
Summary and conclusions
As discussed above, the geographical distribution and temporal trends in rates of STD in the USA are marked by some successes and many opportunities and challenges. The spatial and inter‐subgroup variation in STD rates replicates the heterogeneity in rates of other infections, conditions and mortality.59 The temporal trends have been influenced, at least in part, by changes in sexual and preventive behaviours and societal norms. The HIV epidemic has resulted in decreases in sexual risk‐taking during the 1980s and early 1990s. The extent to which such behaviour change was a spontaneous response to the HIV epidemic or brought about by behavioural interventions is unknown.60 Similarly, we do not know whether the more recent increase in sexual risk‐taking is a result of prevention fatigue or a spontaneous response to the availability of antiretroviral therapy and optimism in the face of these effective treatments.
Known effective STD prevention interventions—including screening, partner notification, early diagnosis and treatment and behavioural interventions—are also assumed to have influenced temporal trends in the incidence and prevalence of STD.61 However, evaluation of the population level impact of STD prevention programmes is still limited. As a result, it is difficult to determine the extent to which such programmes or their specific components have influenced temporal trends in the prevalence and incidence of STD.62 Although less so today, many STD prevention interventions have been implemented without strong empirical evidence of their efficacy, effectiveness or cost benefit. The lack of a comprehensive, standardised and consistent measurement and reporting system for risk behaviours and programme activities further complicates evaluation concerns. Implementation science in general, and its application to STD interventions in particular, is in the very early stages of development. Consequently, many questions central to planning and implementation of prevention programmes—including when to implement particular interventions, who to target, how much coverage is required to have a population level impact, how much coverage is achievable, what incremental impact can be expected from the addition of a particular intervention to the intervention mix and at what point diminishing marginal returns set in—often remain unanswered.62 Current discussions around the chlamydia screening programmes in the USA, UK and Sweden63,64 reflect these uncertainties.
Nevertheless, STD prevention programmes in the USA are marked by some remarkable achievements. For example, the syphilis elimination programme of the last decade has made a big impact on the syphilis epidemic among minority heterosexuals, effectively containing it. Unfortunately, this success was balanced by the inability to maintain control of the syphilis epidemic among MSM. Similarly, gonorrhoea rates among the white population of both sexes and all ages have been low for over a decade. Among young African‐American women, however, gonorrhoea rates remain unacceptably high. Further advances in implementation science coupled with adequate prevention resources may bring many more success stories in the near future.
Acknowledgements
The authors thank Patricia Jackson for her outstanding support in the preparation of this article.
Abbreviations
GISP - Gonococcal Isolate Surveillance Project
HPV - human papillomavirus
HSV - herpes simplex virus
MSM - men who have sex with men
STD - sexually transmitted disease
Footnotes
Competing interests: None.
This paper has been abstracted from Aral SO and Holmes KK.2
References
- 1.Centers for Disease Control and Prevention Sexually transmitted disease surveillance, 2005. Atlanta, Georgia: US Department of Health and Human Services, November, 2006
- 2.Aral S O, Holmes K K. Social and behavioral determinants of the epidemiology of STDs: industrialized and developing countries. In: Holmes KK, Sparling PF, Mardh P‐A, et al eds. Sexually transmitted diseases. 3rd ed. New York: McGraw Hill, 199939–76.
- 3.Fenton K A, Lowndes C M, the European Surveillance of Sexually Transmitted Infections (ESSTI) Network Recent trends in the epidemiology of sexually transmitted infections in the European Union. Sex Transm Infect 200480255–263. [DOI] [PMC free article] [PubMed] [Google Scholar]
- 4.McQuillan G M, Kruszon‐Moran D, Kottiri B J.et al Racial and ethnic differences in the seroprevalence of 6 infectious diseases in the United States: data from NHANES III, 1988–1994. Am J Public Health 2004941952–1958. [DOI] [PMC free article] [PubMed] [Google Scholar]
- 5.Centers for Disease Control and Prevention Racial disparities in nationally notifiable diseases – United States, 2002. MMWR 2005549–11. [PubMed] [Google Scholar]
- 6.Ellen J M, Aral S O, Madger L S. Do differences in sexual behaviors account for the racial/ethnic differences in adolescents' self‐reported history of a sexually transmitted disease? Sex Transm Dis 199825125–129. [DOI] [PubMed] [Google Scholar]
- 7.Ellen J M, Kohn R P, Bolan G A.et al Socioeconomic differences in sexually transmitted disease rates among Black and White adolescents, San Francisco, 1990–1992. Am J Public Health 1995851546–1548. [DOI] [PMC free article] [PubMed] [Google Scholar]
- 8.Hallfors D D, Iritani B J, Miller W C.et al Sexual and drug behavior patterns and HIV and STD racial disparities: the need for new directions. Am J Public Health 200797125–132. [DOI] [PMC free article] [PubMed] [Google Scholar]
- 9.Ford K, Sohn W, Lepkowski J. American adolescents: sexual mixing patterns, bridge partners, and concurrency. Sex Transm Dis 20022913–19. [DOI] [PubMed] [Google Scholar]
- 10.Laumann E O, Youm Y. Racial/ethnic group differences in the prevalence of sexually transmitted diseases in the United States: a network explanation. Sex Transm Dis 199926250–261. [DOI] [PubMed] [Google Scholar]
- 11.Ellen J M, Hessol N A, Kohn R P.et al An investigation of geographic clustering of repeat cases of gonorrhea and chlamydial infection in San Francisco, 1989–1993: evidence for core groups. J Infect Dis 19971751519–1522. [DOI] [PubMed] [Google Scholar]
- 12.Rothenberg R B, Potterat J J. Temporal and social aspects of gonorrhea transmission: the force of infectivity. Sex Transm Dis 19881588–92. [DOI] [PubMed] [Google Scholar]
- 13.Aral S O, Hughes J P, Stoner B.et al Sexual mixing patterns in the spread of gonococcal and chlamydial infections. Am J Public Health 199989825–833. [DOI] [PMC free article] [PubMed] [Google Scholar]
- 14.Ghani A C, Ison C A, Ward H.et al Sexual partner networks in the transmission of sexually transmitted diseases. An analysis of gonorrhea cases in Sheffield, UK. Sex Transm Dis 199623498–503. [DOI] [PubMed] [Google Scholar]
- 15.Kottiri B J, Friedman S R, Neaigus A.et al Risk networks and racial/ethnic differences in the prevalence of HIV infection among injection drug users. J Acquir Immune Defic Syndr 20023095–104. [DOI] [PubMed] [Google Scholar]
- 16.Jennings J M, Curriero F C, Celentano D.et al Geographic identification of high gonorrhea transmission areas in Baltimore, Maryland. Am J Epidemiol 200516173–80. [DOI] [PubMed] [Google Scholar]
- 17.Cohen D, Spear S, Scribner R.et al Broken windows and the risk of gonorrhea. Am J Public Health 200090230–236. [DOI] [PMC free article] [PubMed] [Google Scholar]
- 18.Kerani R P, Golden M R, Whittington W L H.et al Spatial bridges for the importation of gonorrhea and chlamydial infection. Sex Transm Dis 200330742–749. [DOI] [PubMed] [Google Scholar]
- 19.Choudhury B, Risley C L, Ghani A C.et al Identification of individuals with gonorrhoea within sexual networks: a population‐based study. Lancet 2006368139–146. [DOI] [PubMed] [Google Scholar]
- 20.Fox K K, del Rio C, Holmes K.et al Gonorrhea in the HIV era: a reversal in trends among men who have sex with men. Am J Public Health 200191959–964. [DOI] [PMC free article] [PubMed] [Google Scholar]
- 21.Fenton K A, Imrie J. Increasing rates of sexually transmitted diseases in homosexual men in Western Europe and the United States: why? Infect Dis Clin North Am 200519311–331. [DOI] [PubMed] [Google Scholar]
- 22.Elford J. Changing patterns of sexual behaviour in the era of highly active antiretroviral therapy. Curr Opin Infect Dis 20061926–32. [DOI] [PubMed] [Google Scholar]
- 23.Handsfield H H, Sandstrom E G, Knapp J S.et al Epidemiology of penicillinase‐producing Neisseria gonorrhoeae infections: analysis by auxotyping and serotyping. N Engl J Med 1982306950–954. [DOI] [PubMed] [Google Scholar]
- 24.Centers for Disease Control Penicillinase‐producing Neisseria gonorrhoeae—United States, 1986. MMWR 198736107. [PubMed] [Google Scholar]
- 25.Jaffe H W, Biddle J W, Johnson S R.et al Infections due to penicillinase‐producing Neisseria gonorrhoeae in the United States: 1976–1980. J Infect Dis 1981144191–197. [DOI] [PubMed] [Google Scholar]
- 26.Garnett G P. The geographical and temporal evolution of sexually transmitted disease epidemics. Sex Transm Infect 200278(Suppl 1)i14–i19. [DOI] [PMC free article] [PubMed] [Google Scholar]
- 27.Wang S A, Lee M V, O'Connor N.et al Multi‐drug resistant Neisseria gonorrhoeae with decreased susceptibility to cefixime, Hawaii, 2001. Clin Infect Dis 200337849–852. [DOI] [PubMed] [Google Scholar]
- 28.Golden M R, Marra C M, Holmes K K. Update on syphilis: resurgence of an old problem. JAMA 20032901510–1514. [DOI] [PubMed] [Google Scholar]
- 29.Bronzan R, Echavarria L, Hermida J.et al Syphilis among men who have sex with men (MSM) in Miami, Dade County, Florida. In: Program and Abstracts of the 2002 National STD Prevention Conference, San Diego, California, 4–7 March 2002. Abstract no. P135.
- 30.Chen S Y, Gibson S, Katz M H.et al Continuing increases in sexual risk behavior and sexually transmitted diseases among men who have sex with men: San Francisco, California, 1999–2001 [letter]. Am J Public Health 2002921387–1388. [PMC free article] [PubMed] [Google Scholar]
- 31.D'Souza G, Lee J H, Paffel J M. Outbreak of syphilis among men who have sex with men in Houston, Texas. Sex Transm Dis 200330872–873. [DOI] [PubMed] [Google Scholar]
- 32.Klausner J D, Wolf W, Fischer‐Ponce L.et al Tracing a syphilis outbreak through cyberspace. JAMA 2000284447–449. [DOI] [PubMed] [Google Scholar]
- 33.Rietmeijer C A, Bull S S, McFarlane M.et al Risks and benefits to the internet for populations at risk for sexually transmitted infections (STIs): results of an STI clinic survey. Sex Transm Dis 20033015–19. [DOI] [PubMed] [Google Scholar]
- 34.Manhart L E, Aral S O, Holmes K K.et al Sex partner concurrency: measurement, prevalence, and correlates among urban 18–39‐years‐olds. Sex Transm Dis 200229133–143. [DOI] [PubMed] [Google Scholar]
- 35.Kraut‐Becher J R, Aral S O. Gap length: an important factor in sexually transmitted disease transmission. Sex Transm Dis 200330221–225. [DOI] [PubMed] [Google Scholar]
- 36.Eckholm E. Plight deepens for black men, studies warn. New York Times, 20 March 2006
- 37.Grassly N C, Fraser C, Garnett G P. Host immunity and synchronized epidemics of syphilis across the United States. Nature 2005433366–367. [DOI] [PubMed] [Google Scholar]
- 38.Pourbohloul B, Rekart M L, Brunham R C. Impact of mass treatment on syphilis transmission: a mathematical modelling approach. Sex Transm Dis 200330297–305. [DOI] [PubMed] [Google Scholar]
- 39.Grenfell B, Bjornstad O. Epidemic cycling and immunity. Nature 2005433366–367. [DOI] [PubMed] [Google Scholar]
- 40.Miller W C, Ford C A, Morris M.et al Prevalence of chlamydial and gonococcal infections among young adults in the United States. JAMA 20042912229–2236. [DOI] [PubMed] [Google Scholar]
- 41.Sutton M, Sternberg M, Koumans E H.et al The prevalence of Trichomonas vaginalis among reproductive‐age women in the United States, 2001–2004. Obstet Gynecol 2006107(Suppl)S8. [DOI] [PubMed] [Google Scholar]
- 42.Miller W C, Swygard H, Hobbs M M.et al The prevalence of trichomoniasis in young adults in the United States. Sex Transm Dis 200532593–598. [DOI] [PubMed] [Google Scholar]
- 43.Cates W., Jr Epidemiology and control of sexually transmitted diseases: strategic evolution. Infect Dis Clin North Am 198711–23. [PubMed] [Google Scholar]
- 44.Xu F, Sternberg M R, Kottiri B J.et al Trends in herpes simplex virus type 1 and type 2 seroprevalence in the United States. JAMA 2006296964–973. [DOI] [PubMed] [Google Scholar]
- 45.Baseman J G, Koutsky L A. The epidemiology of human papillomavirus infections. J Clin Virol 200532(Suppl)S16–S24. [DOI] [PubMed] [Google Scholar]
- 46.Darrow W W. Assessing targeted AIDS prevention in male and female prostitutes and their clients. In: Paccaud F, et al eds. Assessing AIDS prevention. Basel: Birkhäuser Verlag, 1992215–231.
- 47.Bacon O, Lum P, Hahn J.et al Commercial sex work and risk of HIV infection among young drug‐injecting men who have sex with men in San Francisco. Sex Transm Dis 200633228–234. [DOI] [PubMed] [Google Scholar]
- 48.Heimberger T S, Chang H G, Birkhead G S.et al High prevalence of syphilis detected through a jail screening program: a potential public health measure to address the syphilis epidemic. Arch Intern Med 19931531799–1804. [PubMed] [Google Scholar]
- 49.Centers for Disease Control and Prevention Syphilis screening among women arrestees at the Cook County Jail – Chicago, 1996. MMWR 199847432–433. [PubMed] [Google Scholar]
- 50.Mertz K J, Schwebke J R, Gaydos C A.et al Screening women in jails for chlamydial and gonococcal infection using urine tests: feasibility, acceptability, prevalence and treatment rates. Sex Transm Dis 200229271–276. [DOI] [PubMed] [Google Scholar]
- 51.Kahn R, Voigt R, Swint E.et al Early syphilis in the United States identified in corrections facilities, 1999–2002. Sex Transm Dis 200431360–364. [DOI] [PubMed] [Google Scholar]
- 52.Barry P, Kent C K, Scott K C.et al Sexually transmitted infection screening in county jails is associated with a decrease in community prevalence of gonorrhea and chlamydia – San Francisco, 1997–2004. In: Program and Abstracts of the 2006 National STD Prevention Conference, Jacksonville, Florida, 8–11 May 2006. Abstract no. D1f
- 53.Centers for Disease Control and Prevention HIV infection, syphilis, and tuberculosis screening among migrant farm workers: Florida, 1992. MMWR 199241723. [PubMed] [Google Scholar]
- 54.Jones J L, Rion P, Hollis S.et al HIV‐related characteristics of migrant workers in rural South Carolina. South Med J 1991841088–1090. [DOI] [PubMed] [Google Scholar]
- 55.Bechtel G A, Shepherd M A, Rogers P W. Family, culture, and health practices among migrant farm workers. J Community Health Nurs 19951215–22. [DOI] [PubMed] [Google Scholar]
- 56.Brewer T, Hasburn J, Ryan C A.et al Migration, ethnicity and environment: HIV risk factors for women on the sugar cane plantations (bateyes) of the Dominican Republic. AIDS 1998121879–1887. [DOI] [PubMed] [Google Scholar]
- 57.Noell J, Rohde P, Ochs L.et al Incidence and prevalence of chlamydia, herpes, and viral hepatitis in a homeless adolescent population. Sex Transm Dis 2001284–10. [DOI] [PubMed] [Google Scholar]
- 58.Van Leeuwen J M, Rietmeijer C A, LeRoux T.et al Reaching homeless youths for Chlamydia trachomatis and Neisseria gonorrhoeae screening in Denver, Colorado. Sex Transm Infect 200278357–359. [DOI] [PMC free article] [PubMed] [Google Scholar]
- 59.Murray C J L, Kulkarni S, Michaud C.et al Eight Americas: investigating mortality disparities across races, counties in the United States. PLoS Med 20063e260. [DOI] [PMC free article] [PubMed] [Google Scholar]
- 60.Ferguson N. Capturing human behaviour: understanding the dynamics of infectious‐disease transmission demands a holistic approach, yet today's models largely ignore how epidemics change individual behaviour. Nature 2007446733. [DOI] [PubMed] [Google Scholar]
- 61.Manhart L E, Holmes K K. Randomized controlled trials of individual‐level, population‐level, and multilevel interventions for preventing sexually transmitted infections: what has worked? J Infect Dis 2005191(Suppl 1)S7–24. [DOI] [PubMed] [Google Scholar]
- 62.Aral S O, Lipshutz J A, Douglas J M. Introduction. In: Aral SO, Douglas JM, eds. Behavioral interventions for prevention and control of sexually transmitted diseases. New York: Springer, 2007
- 63.Low N. Screening programmes for chlamydial infection: when will we ever learn? BMJ 2007334725–728. [DOI] [PMC free article] [PubMed] [Google Scholar]
- 64.Jones R, Boag F. Screening for Chlamydia trachomatis: opportunistic approaches have little evidence to support them. BMJ 2007334703–705. [DOI] [PMC free article] [PubMed] [Google Scholar]


