Abstract
This laboratory has introduced a chemical method for residue-specific protein cleavage and has provided a preliminary assessment of the suitability of microwave accelerated acid cleavage as a proteomic tool. This report is a continuing assessment of the fate of common protein modifications in microwave-accelerated acid cleavage. We have examined the cleavage of ribonuclease A and the related N-linked glycoprotein ribonuclease B, and the O-linked glycoprotein alpha crystallin A chain, using MALDI-TOF and LC-ESI-MS to identify the peptide products. RNase A and B each contain four disulfide bonds, and the addition of a reducing reagent, such as dithiothreitol, was found to be required to achieve efficient acidic proteolysis. The linkage of the glycosidic group to the asparagine side-chain in ribonuclease B was found not to be cleaved by brief microwave treatment in 12.5 % acetic acid. The distribution of the heterogeneous carbohydrate side chain in the glycopeptide products of acid cleavage was compared to that of the glycopeptide products of tryptic digestion. Hydrolysis within the carbohydrate chain itself is minimal under the conditions used. The O-linked side-chain on alpha crystalline A was found to be cleaved during acid cleavage of the protein.
Keywords: chemical proteolysis, glycoprotein, disulfide bonds, heterogeneity
Introduction
Recently the Fenselau group has reported that microwave-assisted acid incubation cleaves proteins at aspartic acid residues, with high specificity in seconds or minutes (1) and that tandem mass spectra of the peptide products of this proteolytic reaction are suitable for bioinformatics searching in high throughput proteomic strategies (2,3).
Acetic (or other) acid serves as a chemical enzyme that can cleave at both sides of aspartic acids, via a mechanism that has been considered previously (3,4). This method was demonstrated for rapid identification of viruses (5) and Bacillus spores (1,6). More recently, the effect of hot acid has been evaluated on acetylation, oxidation and phosphorylation of proteins (3). In the present study we evaluate the suitability of this chemical proteolysis for analysis of glycoproteins and proteins with disulfide bonds.
Ribonuclease A and ribonuclease B were used to validate the method for analysis of N-linked glycoproteins and proteins with internal disulfide bonds. Ribonuclease A is a non-glycosylated protein, which serves as a control for ribonuclease B, as they have the same primary structure. Ribonuclease B carries an N-linked glycan at Asp 34, whose structure has been characterized as a high-mannose type with a N-acetylglycosamine core (GlcNAc) and 4 to 9 mannose residues (Man) attached to the core (7, 8). Additionally, both of these relatively small proteins have four internal disulfide bonds, which make their structures stable and relatively difficult to digest. In proteomic strategies, an incubation time of an hour or longer is usually required to reduce disulfide bonds with relatively large amounts of reducing agents such as tris(2-carboxyethyl)phosphine (TCEP) or dithiothreitol (DTT). We demonstrate in this report that we were able to cleave the disulfide bonds in RNase A and B and digest these model proteins concurrently within 5 minutes, by adding dithiothreitol to the acidic microwave reaction. The acetic acid cleaves the protein at one or both sides of aspartic acid when the disulfide bridges are reduced by DTT.
It was of primary interest to determine if carbohydrate-protein linkages would be affected by the microwave-accelerated acid digestion and if the oligosaccharide chain would be cleaved. Carbohydrate heterogeneity in the acid cleavage products of RNase B was characterized by LC-ESI-MS mass spectrometry and compared to that of the products of a parallel tryptic digestion. Alpha crystallin A chain carries a single O-linked GlcNac at S162 (9), which allowed evaluation of the stability of O-linkages during acid catalyzed proteolysis.
Experimental section
Materials
HPLC gradients (acetonitrile, water, formic acid) were purchased from Burdick & Jackson (Morristown, NJ), glacial acetic acid was purchased from Fisher (Fair lawn, NJ), α-cyanohydroxycinnamic acid (CHCA) and dithiothreitol (DTT) were purchased from Sigma (St. Louis, MO), protein calibration standard kit, ribonuclease A, and ribonuclease B were purchased from Sigma. Alpha-crystallin A chain was purchased from Streegen Bioreagents (Ann Arbor, MI). Trypsin was purchased from Promega (Madison, WI). All chemicals and proteins were used without further purification.
Microwave-assisted acetic acid digestion
A Discover Benchmate microwave system (CEM Corp, Matthews, NC) was utilized to perform the protein digestions which allowed control of the temperature, pressure, power, and time. Ribonuclease A was dissolved in Milli-Q water to make a 2 mg/ml solution. Two and a half μL of this protein solution was mixed with 6.25 μL of acetic acid, 25 μL of 10 mM DTT, and 16.25 μL of Milli-Q water in a 300 μL micro-glass vial and exposed to microwave irradiation in the open vessel mode. The incubation time was 5 minute with a fixed microwave irradiation power at 300W and a maximum temperature of 140o. The same procedure was used for ribonuclease B. Alpha-crystallin A chain came in phosphate buffer solution at 1.2mg/mL ( 0.15M NaCl, 0.05M phosphate, pH 7.2). Two and one-tenth μL of this protein solution was mixed 6.25 μL acetic acid and 25 μL of 10 mM DTT, and water was added to reach a final volume of 50 μL.
Tryptic digestion
Ammonium bicarbonate (79 mg) was mixed with 10 mL of Milli-Q water to reach a final concentration of 100 mM. Ammonium bicarbonate solution (1.6 ml) was added directly to a vial containing 20 μg immobilized trypsin. Ribonuclease B solution (2.5 μL) was incubated with 30 μL 100 mM DTT for 3 hour at 57o and allowed to cool to room temperature. Fifty μL trypsin was added to the protein solution, followed by incubation overnight at 37°C. For the Alpha crystallin, 5μL solution was mixed with 45 μL 10 mM DTT, and processed as described above.
MALDI-TOF-MS analysis
The samples from the acetic acid digestion were analyzed using an Axima-CFR Plus MALDI-TOF mass spectrometer (Shimadzu Biotech, Columbia MD). The matrix solution was prepared by dissolving 10mg CHCA in 1 mL water containing 70% acetonitrile and 0.1%TFA. The sample was applied to the MALDI plate via a sandwich method. A layer of 0.5 μL matrix was pipetted onto the plate first, followed by 0.5 μL sample solution and another layer of 0.5 μL matrix. Each layer was allowed to air dry before the next layer was applied. The spectra were obtained in the linear positive ion mode, with a 337 nm N2 laser, by collecting and summing 200 profiles from 1500–5500 Da.
HPLC-ESI-MS analysis
The peptide mixtures of RNase B from both the tryptic digestion and the acetic acid digestion were each separated on a nanoACQUITY UPLC System (Waters, Milford, MA). Ten μL of sample solution was introduced onto a reverse phase C-18 column (1.0mm i.d.×100 mm) with 1.7 μm bridged ethyl hybrid (BEH) particle packing (Waters, Milford, MA). The peptides were eluted via a binary solvent system (solvent A: 0.1% TFA and 1% water in acetonitrile; solvent B: 0.1% TFA and 1% acetonitrile in water) using a linear gradient from 0% B to 40% B in 40 min. The flow rate was set at 50 μl/min. The HPLC system was directly coupled to the ESI-MS. All mass spectra were acquired between 400 Da-2000 Da on an LTQ XL ion trap (Thermo Electron, San Jose, CA). The electrospray voltage was 4 kV, and the ESI nebulizing gas was nitrogen.
The peptide mixture obtained from alpha-crystallin A chain by acetic acid digestion was separated and analyzed using the same system. A linear 60 min gradient from 0%–50% B was applied.
Mascot database search
A Mascot search (Matrix Science Ltd., London UK) was carried out using the peptide mass fingerprint to analyze the MS spectra from acetic acid digestion. All the m/z values in the spectrum in Figure 1 were entered except for the doubly charged ions. The search was performed against SwissProt database and all species using “formic acid” as the enzyme with a peptide mass tolerance of 4 Dalton. Four missed cleavages were allowed. The average mass of [M+H]+ was selected, while no modification was entered.
Figure 1.
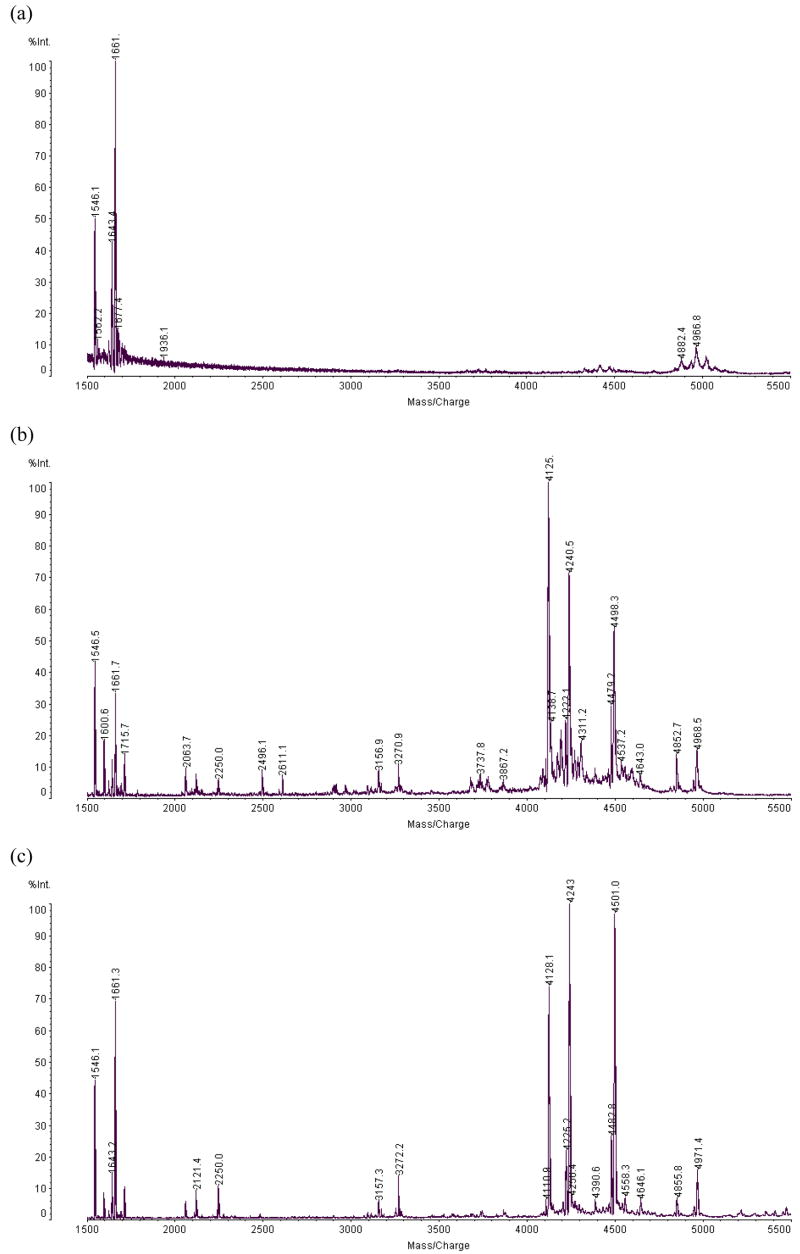
MALDI MS spectra of peptide product s of the acetic acid digestion (a) of RNase A without the DTT (b) of RNase A with 5mM DTT, and (c) ribonuclease B with 5mM DTT.
Results and discussion
Ribonuclease A and B each contain four disulfide bonds. For acid cleavage (as well as tryptic cleavage) good digestion could not be realized without reduction of the disulfide bonds. This is illustrated for RNase A in Figure 1a, where it can be seen that only the N-terminal peptide [1–13] and [1–14] is released by acid treatment of the native protein. When DTT was added directly to the protein solution with acetic acid before microwave radiation, the reduction of disulfide bonds and cleavage of the peptide backbone were performed concurrently in 5 minutes, as analyzed in Figure 1b. No further cleanup was needed before the MS analysis.
N-linked glycoprotein--RNase B
The MALDI spectra of peptides recovered from reduced ribonuclease A and B are shown in Figure 1b and c. Pairs of peaks separated by 115 Da can be observed in the spectra, because acetic acid can cleave the polyamide chain on both sides of aspartic acid. These pairs help to recognize and identify peptide products. Peptides were identified that provide 100% sequence coverage of RNase A, as listed in Table 1. For RNase B, the peptides identified covered 80% of the amino acid sequence (Figure 1c and Table 2). The missing sequence was associated with the glycopeptide [15–38], which carries carbohydrate attached to Asn34. The glycopeptides were subsequently analyzed using ESI, following fractionation by HPLC.
Table 1.
Peptides from the acid digestion of ribonuclease A identified by MASCOT
| Position | Obs. | Mr(expt) | Mr(calc) | Delta | Miss | Sequence |
|---|---|---|---|---|---|---|
| 1–13 | 1546.5000 | 1545.4926 | 1546.7496 | −1.2570 | 0 | -.KETAAAKFERQHM.D |
| 1–14 | 1660.6000 | 1659.5926 | 1661.8371 | −2.2444 | 1 | -.KETAAAKFERQHMD.S |
| 1–14 | 1661.7000 | 1660.6926 | 1661.8371 | −1.1444 | 1 | -.KETAAAKFERQHMD.S |
| 15–37 | 2496.1000 | 2495.0926 | 2496.7533 | −1.6606 | 0 | D.SSTSAASSSNYCNQMMKSRNLTK.D |
| 15–38 | 2611.1000 | 2610.0926 | 2611.8407 | −1.7480 | 1 | D.SSTSAASSSNYCNQMMKSRNLTKD.R |
| 39–53 | 1715.7000 | 1714.6926 | 1715.9275 | −1.2349 | 1 | D.RCKPVNTFVHESLAD.V |
| 39–82 | 4852.7000 | 4851.6926 | 4855.4469 | −3.7543 | 2 | D.RCKPVNTFVHESLADVQAVCSQKNVACKNGQTNCYQSYSTMSIT.D |
| 39–83 | 4968.5000 | 4967.4926 | 4970.5343 | −3.0417 | 3 | D.RCKPVNTFVHESLADVQAVCSQKNVACKNGQTNCYQSYSTMSITD.C |
| 54–82 | 3156.9000 | 3155.8926 | 3157.5347 | −1.6421 | 0 | D.VQAVCSQKNVACKNGQTNCYQSYSTMSIT.D |
| 54–83 | 3270.9000 | 3269.8926 | 3272.6221 | −2.7295 | 1 | D.VQAVCSQKNVACKNGQTNCYQSYSTMSITD.C |
| 84–120 | 4125.0000 | 4123.9926 | 4127.6406 | −3.6480 | 0 | D.CRETGSSKYPNCAYKTTQANKHIIVACEGNPYVPVHF.D |
| 84–121 | 4240.5000 | 4239.4926 | 4242.7280 | −3.2354 | 1 | D.CRETGSSKYPNCAYKTTQANKHIIVACEGNPYVPVHFD.A |
| 84–124 | 4498.3000 | 4497.2926 | 4500.0143 | −2.7217 | 2 | D.CRETGSSKYPNCAYKTTQANKHIIVACEGNPYVPVHFDASV.- |
Table 2.
Peptides from the acid digestion of ribonuclease B identified by MASCOT
| Position | Obs. | Mr(expt) | Mr(calc) | Delta | Miss | Sequence |
|---|---|---|---|---|---|---|
| 1–13 | 1546.1000 | 1545.0926 | 1546.7496 | −1.6570 | 0 | -.KETAAAKFERQHM.D |
| 1–14 | 1660.2000 | 1659.1926 | 1661.8371 | −2.6444 | 1 | -.KETAAAKFERQHMD.S |
| 1–14 | 1661.3000 | 1660.2926 | 1661.8371 | −1.5444 | 1 | -.KETAAAKFERQHMD.S |
| 39–53 | 1715.3000 | 1714.2926 | 1715.9275 | −1.6349 | 1 | D.RCKPVNTFVHESLAD.V |
| 39–82 | 4855.8000 | 4854.7926 | 4855.4469 | −0.6543 | 2 | D.RCKPVNTFVHESLADVQAVCSQKNVACKNGQTNCYQSYSTMSIT.D |
| 39–83 | 4971.4000 | 4970.3926 | 4970.5343 | −0.1417 | 3 | D.RCKPVNTFVHESLADVQAVCSQKNVACKNGQTNCYQSYSTMSITD.C |
| 54–82 | 3157.3000 | 3156.2926 | 3157.5347 | −1.2421 | 0 | D.VQAVCSQKNVACKNGQTNCYQSYSTMSIT.D |
| 54–83 | 3272.2000 | 3271.1926 | 3272.6221 | −1.4295 | 1 | D.VQAVCSQKNVACKNGQTNCYQSYSTMSITD.C |
| 84–120 | 4128.1000 | 4127.0926 | 4127.6406 | −0.5480 | 0 | D.CRETGSSKYPNCAYKTTQANKHIIVACEGNPYVPVHF.D |
| 84–121 | 4243.0000 | 4241.9926 | 4242.7280 | −0.7354 | 1 | D.CRETGSSKYPNCAYKTTQANKHIIVACEGNPYVPVHFD.A |
| 84–124 | 4501.0000 | 4499.9926 | 4500.0143 | −0.0217 | 2 | D.CRETGSSKYPNCAYKTTQANKHIIVACEGNPYVPVHFDASV.- |
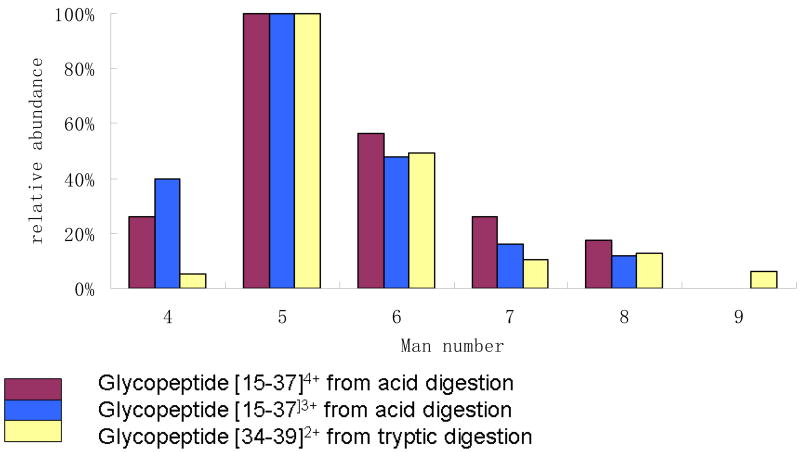
Relative abundances of the glycoforms produced from the same sample by acid cleavage and trypsin, were compared in order to evaluate the stability of bonds within the carbohydrate chain during the short treatment with hot acid. Four small tryptic glycopeptides were detected, [34–49], [32–49], [34–37], [32–37], while the acetic acid digestion produced two glycopeptides [15–37], [15–38] with molecular masses around 4000 Da. Analysis of the former was optimized for [34–39] and the latter for [15–37].The latter glycopeptides weighed around 4kDa, including the carbohydrate, and were ionized mainly in two charge states. The relative abundances of glycoforms of [34–39]2+, [15–37]3+ and [15–37]4+ are plotted in Figure 2. The relative abundances of glycoforms containing Man-5, 6, 7 and 8 Man residues are comparable. However, a glycopeptide with Man-9 is observed only among the tryptic products, and the abundance of the Man-4 glycoforms is higher in the acid products. These differences may reflect the preferential analysis and detection of the smaller ions in the series of heavy glycopeptides, however the possibility of a small amount of glycolysis cannot be ruled out.
Figure 2.
Relative abundances of glycopeptides produced by acetic acid and tryptic digestions of ribonuclease B.
O-linked glycoprotein--alpha crystallin A chain
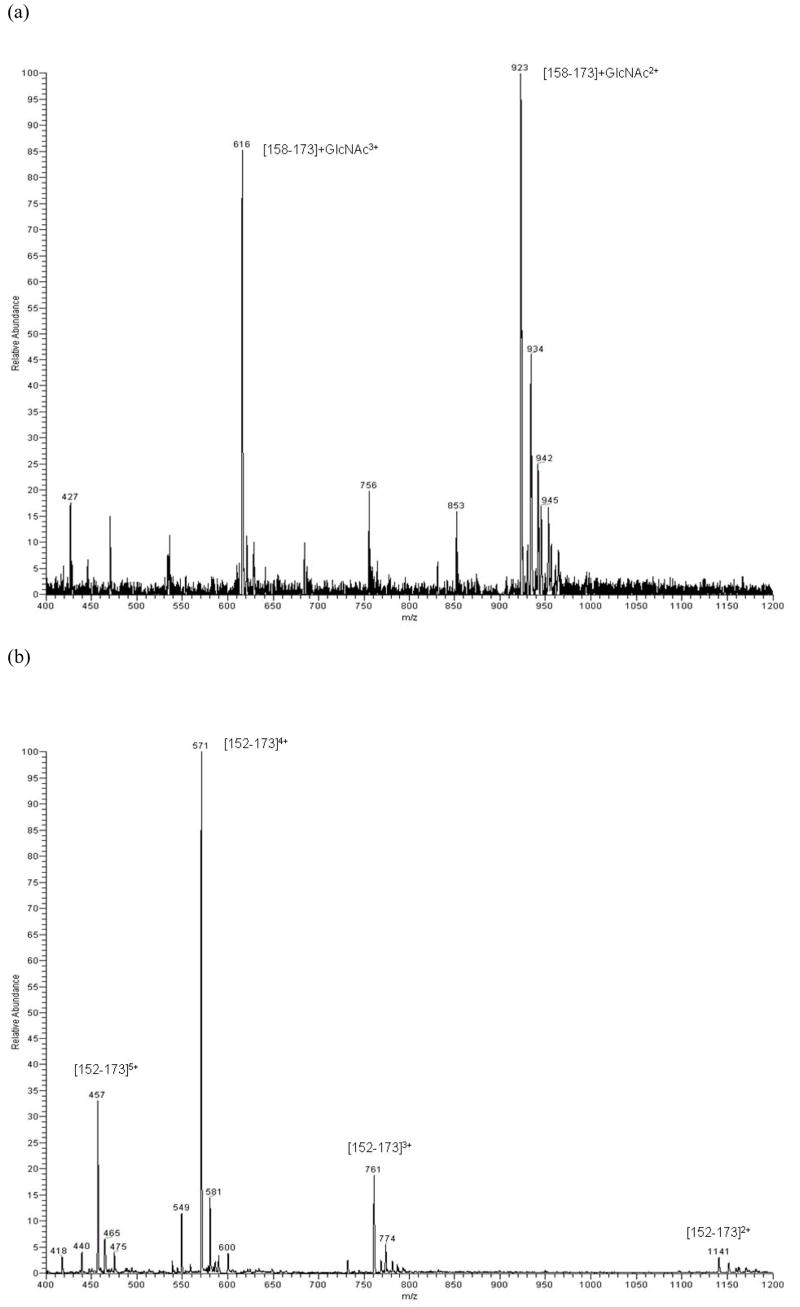
The electrospray spectrum of the O-linked glycopeptide produced by tryptic digestion of alpha crystallin A is shown in Figure 3a. The intact glycopeptide [158–173] is characterized in two charge states, +2 and +3. Figure 3b presents the spectrum of peptide [152–173], recovered from the acid digestion of alpha crystallin A chain. The spectrum supports the conclusion that the O-linked GlcNAc attached to Ser162 was cleaved during the microwave acid digestion process.
Figure 3.
(a) MS spectrum of the glycopeptide [158–173]+GlcNAc from tryptic digestion; (b) deglycosylated peptide [152–173] from acid digestion of alpha crystallin A chain.
Conclusion
Studies of the model proteins ribonuclease A and B lead to the conclusions that reduction of disulfide bonds is required to allow rapid and comprehensive residue specific acid cleavage; that such reduction is effectively carried out concurrently with proteolysis; and that the classic N-linkage of carbohydrate chains to asparagine residues is not cleaved by acid under microwave irradiation. Analysis of glycoforms indicates that degradation of the high mannose side chain occurs slowly if at all, relative to proteolysis, and that glycopeptide products will allow an estimation of glycoforms heterogeneity. However, the O-linked glycan was cleaved completely by the acid treatment of a model O-linked glycoprotein.
Footnotes
Publisher's Disclaimer: This is a PDF file of an unedited manuscript that has been accepted for publication. As a service to our customers we are providing this early version of the manuscript. The manuscript will undergo copyediting, typesetting, and review of the resulting proof before it is published in its final citable form. Please note that during the production process errors may be discovered which could affect the content, and all legal disclaimers that apply to the journal pertain.
References
- 1.Swatkoski SS, Russell S, Edwards N, Fenselau C. Rapid chemical digestion of small acid soluble spore proteins for analysis of Bacillus spores. Anal Chem. 2006;78:181–188. doi: 10.1021/ac051521d. [DOI] [PubMed] [Google Scholar]
- 2.Swatkoski S, Gutierrez P, Ginter J, Petrov A, Dinman JD, Edwards N, Fenselau C. Integration of residue-specific acid cleavage into proteomic workflows. J Proteome Res. 2007;6:4525–4527. doi: 10.1021/pr0704682. [DOI] [PubMed] [Google Scholar]
- 3.Swatkoski S, Gutierrez P, Wynne C, Petrov A, Dinman JD, Edwards N, Fenselau C. Microwave accelerated residue-specific acid cleavage for proteomic applications. J Proteome Res. 2008;7:579–586. doi: 10.1021/pr070502c. [DOI] [PubMed] [Google Scholar]
- 4.Li AQ, Sowder RC, Henderson LE, Moore SP, Garfinkel DJ, Fisher RJ. Chemical cleavage at aspartyl residues for protein identification. Anal Chem. 2001;73:5395–5402. doi: 10.1021/ac010619z. [DOI] [PubMed] [Google Scholar]
- 5.Swatkoski S, Russell S, Edwards N, Fenselau C. Analysis of a model virus using residue specific chemical cleavage and MALDI TOF mass spectrometry. Anal Chem. 2007;79:654–658. doi: 10.1021/ac061493e. [DOI] [PubMed] [Google Scholar]
- 6.Fenselau C, Russell S, Swatkoski S, Edwards N. Proteomic strategies for rapid analysis of microorganisms. Eur J Mass Spectrom. 2007;13:35–39. doi: 10.1255/ejms.845. [DOI] [PubMed] [Google Scholar]
- 7.An HJ, Peavy TR, Hedrick JL, Lebrilla CB. Determination of N-glycosylation sites and site heterogeneity in glycoproteins. Anal Chem. 2003;75:5628–5637. doi: 10.1021/ac034414x. [DOI] [PubMed] [Google Scholar]
- 8.Pitchayawasin S, Isobe M. Mass spectrometric assignment of Smith degradation glycopeptides derived from ribonuclease B. Bioscience, Biotechnology, and Biochemistry. 2004;68:1424–1433. doi: 10.1271/bbb.68.1424. [DOI] [PubMed] [Google Scholar]
- 9.Roquemore EP, Dell A, Morris HR, Panico M, Reason AJ, Savoy LA, Wistow GJ, Zigler JS, Earles BJ, Hart GW. Vertebrate lens alpha-crystallins are modified by O-linked N-acetylglucosamine. J Biol Chem. 1992;267:555–563. [PubMed] [Google Scholar]


