

Abstract
Many different cell types are able to migrate by formation of a thin actin-based cytoskeletal extension. Recently, it became evident that this extension consists of two distinct substructures, designated lamellipodium and lamellum, which differ significantly in their kinetic and kinematic properties as well as their biochemical composition. We developed a stochastic two-dimensional computer simulation that includes chemical reaction kinetics, G-actin diffusion, and filament transport to investigate the formation of growing actin networks in migrating cells. Model parameters were chosen based on experimental data or theoretical considerations. In this work, we demonstrate the system's ability to form two distinct networks by self-organization. We found a characteristic transition in mean filament length as well as a distinct maximum in depolymerization flux, both within the first 1–2 μm. The separation into two distinct substructures was found to be extremely robust with respect to initial conditions and variation of model parameters. We quantitatively investigated the complex interplay between ADF/cofilin and tropomyosin and propose a plausible mechanism that leads to spatial separation of, respectively, ADF/cofilin- or tropomyosin-dominated compartments. Tropomyosin was found to play an important role in stabilizing the lamellar actin network. Furthermore, the influence of filament severing and annealing on the network properties is explored, and simulation data are compared to existing experimental data.
INTRODUCTION
Many cells are able to migrate in a directed fashion, which is of enormous relevance for various biological systems and indispensable for multicellular organisms. Typically the cell protrudes by formation of a thin cytoskeletal extension, designated lamellipodium and lamellum, with actin as the main structural component. Within this cytoskeletal extension, actin filaments are densely packed with their fast growing plus-ends mostly oriented toward the cell front (1,2). It has been shown experimentally (3,4) as well as theoretically (5) that actin polymerization provides sufficient force to extend the cell during locomotion.
The growing cytoskeletal extension is not a homogenous entity. Speckle microscopy (6–8) as well as electron microscopy (2) and fluorescence data (9) have revealed that the leading actin network in motile cells is composed of at least two different types of actin networks. In this article, we distinguish between lamellipodium and lamellum following the definition of Chhabra and Higgs (10). Initiated directly at the cell membrane, the lamellipodium extends ∼1–2 μm back to where the lamellum begins. The lamellum typically covers a larger area and spans up to the convergence zone, which marks the transition between the cytoskeletal extension and the cell body (Fig. 1). Electron micrographs reveal detailed actin network design (2,11). Beneath the leading membrane, a dendritically branched actin network dominates with predominantly short filaments, while the network further away from the leading membrane mainly consists of long unbranched actin filaments. It has been shown that the actin branches at the front are induced by Arp2/3 complex, which was found to be highly enriched in the lamellipodium (11). Recently, however, the existence of the highly branched network at the cell front has been challenged (12,13). Further experiments on motile cells will have to ascertain actin network design. Speckle microscopy techniques have allowed observation of actin polymerization dynamics within lamellipodia (6–8,14,15). For the lamellipodial actin network, significantly higher polymerization as well as depolymerization activity was found as compared to the lamellum (7). Experimental data indicates that most of the total depolymerization takes place within this first zone (14). Moreover, experiments have revealed that the lamellipodium shows a high level of actin-bound ADF/cofilin while tropomyosin is virtually absent, whereas the lamellum was found to be dominated by tropomyosin (2,8,9). Characteristics of these two networks, however, might differ substantially between different cell types.
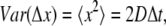
FIGURE 1.

(A) Illustration of cytoskeletal architecture within fish keratocytes. The shaded narrow rectangle specifies the scope of the computer simulation. Lp, lamellipodium; La, lamellum; Cz, convergence zone. (B) Simulated actin network based on values from Table 1. Angular variance used was 20° at ±35°. (C) F-actin concentration along the x axis (in μM). (D) G-actin concentration along the x axis (in μM).
The dynamics of branched actin networks have been studied using in vitro bead and pathogen motility assays (4,16) or actin polymerization-driven vesicles and oil drops (17–19) as well as computer simulations and mathematical models (reviewed by Mogilner (20)). Elaborate models have been developed to understand the growth of branched actin networks against obstacles (21–23). In addition to these microscopic models, macroscopic elastic continuum models based on experimental data on bead motility have been suggested (24,25). Furthermore, computer simulations have been used to study the organization of actin filaments at the leading edge of motile cells and have considered interactions between actin filaments and the cellular membrane (26,27). Few approaches, however, have sought to model the whole cytoskeletal extension (28,29). To date, no model has been able to explain the formation of lamellipodium and lamellum. In this study, we focus on three important questions: First, we search for a minimal set of mechanisms sufficient to explain the formation of two distinct networks that differ in filament length and depolymerization rate. Second, plausible mechanisms to further control actin filament length and actin disassembly are investigated. Third, we study how spatial separation of the actin bound proteins ADF/cofilin and tropomyosin can be achieved.
We investigate actin network growth using Monte Carlo computer simulations. The Monte Carlo approach allows us to mimic cell experiments with a control of parameters that extends beyond that of in vivo systems.
A typical simulated actin network is shown in Fig. 1 together with the underlying distributions of filamentous and monomeric actin. The simulation's essential elements are outlined in Fig. 2. Internal polarity of the system is introduced by restricting filament nucleation sites to one boundary of the system, reflecting nucleation triggered by local signaling at the plasma membrane of motile cells. We model the modulation of F-actin assembly and disassembly by the important actin-associated proteins ADF/cofilin, tropomyosin, and a plus-end capper. This work proposes and explores a plausible mechanism of the formation of distinct lamellipodial and lamellar networks by self-organization. The most important criteria used to distinguish the two networks are mean filament length and depolymerization flux. We define the mean filament length (in μm) as the arithmetic mean of all filaments crossing a line parallel to the leading edge and the depolymerization flux as the actin concentration transfer per time from the filamentous to the monomeric actin pool (in μM/s). Both properties are measured along the x axis. We show that spatial separation of ADF/cofilin and tropomyosin takes place only if we consider ADF/cofilin deactivation.
FIGURE 2.

Scheme of the model. Actin monomers perform random walks determining local G-actin concentration G. Constant nucleation takes place at x = 0. Filaments subsequently grow until capped. Network transport velocity equals the mean of the filaments' growth velocities. F-actin monomers are subject to stochastic chemical reaction events, which occur with rate-dependent probabilities in every time step Δt. The convergence zone is mimicked by instantaneous disassembly at the rear of the system. Detailed description of the model is given in the text.
We obtain respective ADF/cofilin unbinding rates which are significantly higher than values measured in vitro and which can possibly be explained by Lim kinase-triggered phosphorylation (30). The properties of our in silico actin networks are in good agreement with numerous experiments with different kinds of cells. Even without assuming further mechanisms for filament nucleation and elongation, e.g., by proteins of the formin family (31), two different subnetworks form in a self-organized manner, suggesting that lamellipodium and lamellum originate from one single common nucleation source.
METHODS
Computer simulation
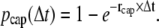
The computer simulation presented is implemented in MATLAB (MatLab 7.5.0, R2007b, The MathWorks, Natick, MA) and uses the kinetic Monte Carlo method. Actin monomer movement is described as stochastic Brownian motion. Probabilities of biochemical events are derived from known on- and off-rate equations. Time is discretized into fixed time steps (typically 50 ms) that are fine enough to capture the system dynamics while still accomplishing the simulation within a reasonable computation time (typically ≤1 day). In each time step, the stochastic events experienced change the system state. After a certain simulated time (typically ∼1–3 min) the system reaches a steady state where the network properties fluctuate only slightly (Fig. 3).
FIGURE 3.

Simulation results for different initial conditions. (A) The system converges to a steady state after ∼1–2 min of simulated time. Although the simulation starting without F-actin displays stronger oscillations, both initial states converge to the same steady state. (B) Steady-state F-actin concentration curves show no significant variations upon strong variation of the initial percentage of F-actin.
Actin monomers are assumed to diffuse independently undergoing random walks. In each time step Δt, every single G-actin monomer is displaced by Gaussian-distributed values Δx and Δy. The variance of the distribution and the length of a time step are related by the Einstein-Smoluchowski equation
 |
(1) |
where D is the diffusion coefficient of monomeric actin in the network. The value Δt has a strong influence on computation time and must be chosen to be sufficiently small to model all events independently. For the data presented, time was discretized in 50-ms steps, which are small enough to model the fastest actin binding proteins (with rates of ∼1 s−1) and which is well below the typical lifetime of an actin monomer in solution (see also Appendix).
Cyclic boundary conditions were applied to the two biochemically inactive system boundaries, while the two active boundaries (x = 0 and x = 10 μm) are modeled as perfectly reflecting borders. Nucleation takes place exclusively at the leading edge with a constant nucleation rate rnuc. The nucleation rate was estimated based on experimental data as described in the Appendix, where we also discuss alternative nucleation models. A random angle α of either +35° or −35° with respect to the x axis is associated with every new filament. For comparison, we used two Gaussian distributions peaked at ±35° with respect to the x axis, mimicking experimentally observed angular distributions (32). Varying the angular variance around the peak values from 0 to 20°, we found that the different angular distributions did not significantly alter the average network properties in our model. Coarse-grained pseudo fluorescence pictures of the actin network for different angular distributions can be found in the Supplementary Material, Data S1.
Average rate equations for plus-end growth are known from experiments (33,34). Under consideration of the Brownian ratchet model of Mogilner and Oster (5), plus-end growth is described by 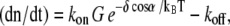 with kon and koff the on- and off-rate constants, δ cos α the length increment per monomer in x direction, and kBT the thermal energy. The average force F along the leading edge of a cell has been estimated to be ∼100 pN μm−1 (28). To obtain the force f per growing filament, we divide the total force by the number of growing filaments at the front. The local G-actin concentration G is determined by counting the number of monomers that are located in a defined area around the plus-end. For all data shown we used a probe area of ∼0.04 μm2 to determine the local G-actin concentration (for discussion of this value, see Appendix).
Plus-end capping and minus-end uncapping are modeled as first-order and zero-order reactions, respectively, with rates given in Table 1. The probability that a growing plus-end is capped within a certain time step Δt can be expressed as
 |
(2) |
Minus-ends of nascent filaments are assumed to be capped by Arp2/3 complex. Uncapping takes place with a rate ruc, thus the probability that uncapping has happened after time Δt is
 |
(3) |
TABLE 1.
Parameters and constants incorporated in the model; parameter estimations are explained in the Appendix
| Symbol | Value | Description | Source |
|---|---|---|---|
 |
12 μM−1 s−1 | On-rate constant of ATP-actin monomers to uncapped plus-end. | (57) |
 |
0.3 s−1 | Off-rate of ADP-actin monomers from minus-end. | (57) |
 |
30 × 0.3 s−1 | Off-rate of ADF/cofilin-actin monomers from minus-end. | (33) |
| l | 10 μm | Length of lamellipodium/lamellum. | (2) |
| h | 0.17 μm | Mean height of lamellipodium/lamellum. | (46) |
| δ | 2.7 nm | Filament length increment per monomer. | (34) |
| D | 5 μm2 s−1 | G-actin diffusion coefficient. | (74) |
| A | 350 μM | Total actin concentration. | Estimated in Appendix, based on (32,40,46). |
| B | ∼100 μm−1 | Growing plus-end density at the leading edge. | (66) |
| F | 100 pN μm−1 | Membrane resistance force per unit edge length. | (28) |
| rnuc | 100 μm−1 s−1 | Steady-state nucleation rate at the leading edge. | (28,66) |
| rcap | 1 s−1 | Plus-end capping rate. | Estimated in Appendix based on (34,67). |
| rac | 0.5 s−1 | ADF/cofilin binding rate to ADP-F-actin. | Estimated in Appendix, based on (33,69,70). |
 |
0.2 s−1 | ADF/cofilin unbinding rate. | Fit parameter. |
| rtm | 0.2 s−1 | Tropomyosin binding rate to ADP-F-actin. | Estimated in Appendix, based on (71). |
| rhyd | 0.3 s−1 | ATP hydrolysis rate within F-actin. | (54) |
| ruc | 0.5 s−1 | Minus-end uncapping/debranching rate. | Estimated in Appendix, based on (2). |
In a similar fashion, we modeled stochastic binding of ADF/cofilin and tropomyosin to actin filaments. The probabilities for plus-end capping, minus-end uncapping, and tropomyosin and ADF/cofilin binding or unbinding are applied each time step to each F-actin monomer.
Minus-end disassembly strongly depends on the state of the terminal F-actin monomers. For undecorated and tropomyosin-decorated F-actin, we assume the same dissociation rate of 0.3 s−1, while ADF/cofilin decoration leads to a 30-fold increase in off-rate (33). Thus, we consider ADF/cofilin to be a depolymerization enhancer as proposed by most experimental studies (33–35) instead of being a direct polymerization promoter (36). We average over the terminal 10 F-actin monomers to determine the mean dissociation rate. Depending on the number of ADF/cofilin-decorated monomers nac within this terminal end, we get the mean dissociation rate
 |
(4) |
For comparison, minus-end disassembly was also modeled without averaging, taking into account only the state of the very terminal F-actin monomer. Although we were still able to reproduce experimental data (data not shown), the averaged off-rate better reflects the fact that filaments partially decorated with ADF/cofilin already show significantly higher depolymerization rates (33). Without averaging, the filament destabilizing effect of ADF/cofilin is underestimated, which results in comparably low off-rates and only slight differences between partially ADF/cofilin decorated and ADF/cofilin free filaments.
All F-actin traversing the border of our system (at x = 10 μm) instantaneously disassembles. This ad hoc mechanism was used to limit network extension as observed in motile cells (14) and is discussed below (see Assumptions and Model).
The total actin concentration was 350 μM for all simulation runs. As initial conditions, we chose either a randomized uniform distribution of G-actin monomers or a randomized distribution with 80% of actin in filamentous form. An exponential initial length distribution was assumed for the actin filaments together with a random position and a random angle of ±35°. In both cases, we started without bound ADF/cofilin or tropomyosin. We could not observe significant differences between steady-state values that originated from the two different initial conditions (Fig. 3).
Filament severing and annealing
We assume that a filament can only be fragmented where ADF/cofilin is bound. At every ADF/cofilin-decorated F-actin monomer, we apply a constant severing rate rsev. Recently, a nontrivial relation between ADF/cofilin concentration and severing activity was reported (37). This, however, has not been included in this model. We ignore filament diffusion after severing, i.e., in our simulation the filaments are transported with the network even after a fragmentation event. We justify this with the fact that, in entangled actin networks, filament diffusion is very slow (38). Furthermore, the lamellipodial actin network is believed to contain transient cross links (39–41). Both arguments do not apply to very short fragments, which indeed will be able to diffuse within the network. Nevertheless, the negation of filament diffusion seems a valid first approximation.
Filament annealing demands a more complex modeling approach because it is a second-order reaction that additionally depends on the length of the actin filaments (42,43). Following Andrianantoandro et al. (43), we describe filament annealing by
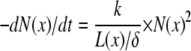 |
(5) |
 |
(6) |
where N(x) is the number concentration of filaments and k the annealing rate constant (in μM−1 s−1 times length in subunits). L(x) is the mean filament length at position x (in μm) and δ the length increment per monomer (see Table 1). Following Fass et al. (44), we use a length-dependent pseudo-first-order annealing rate kanneal. To determine N(x), only filaments without capped minus-ends are considered. This reflects the fact that in our model Arp2/3 is treated as a minus-end capper. During annealing, the filament farther away from the leading edge is removed and pasted to the minus-end of the front filament.
Plotting of simulation data
Unless otherwise mentioned, all simulation curves were averaged from 60 frames taken at intervals of 1 s (simulated time). Within this time period the network undergoes approximately one full array treadmilling cycle, i.e., based on typical velocities of ∼10 μm/min, the whole network is recycled completely. By this average, we obtain mean value curves where most steady-state fluctuations are smoothed out (Data S1).
For comparison with experimental fluorescence images we coarse-grained our simulation data. To mimic the limited optical resolution of fluorescence microscopy, we applied a Gaussian blur based on an estimated optical resolution of 0.61 × λ/NA (45), similar to the method developed in Schaub et al. (32).
ASSUMPTIONS AND MODEL
In this study, we focused on modeling the central part of the keratocyte cytoskeletal extension (Fig. 1). As a reasonable approximation, we model a system that is 1-μm wide, 10-μm long, and 0.17-μm in height. Parameters and variables used in the simulation are summarized in Tables 1 and 2. One of the short boundaries of the system represents the cell's leading edge where filament nucleation takes place. The opposite boundary functions as a convergence zone, i.e., all F-actin traversing this border of the system disassembles. The actin network is modeled in two dimensions due to the extreme flatness of the lamellar network in motile cells (46). Our frame of reference is fixed to the cell's leading edge. Thus, in our frame of reference the F-actin network is transported backward with respect to the leading boundary at x = 0, whereas in the laboratory frame it remains stationary in the case of migrating keratocytes.
TABLE 2.
Variables incorporated in the model
| Symbol | Unit | Description |
|---|---|---|
| G(x, y) | μM | Local G-actin concentration. |
| Jd(x) | μM s−1 | Depolymerization flux. |
| M(x) | μM | Minus-end concentration. |
| N(x) | μM | Number concentration of filaments. |
| F(x) | μM | F-actin concentration (F-actin monomer concentration). |
| L(x) | μm | Mean filament length. |
| Mux(x) | μM | Uncapped minus-end concentration. |
Every actin monomer is modeled individually. We distinguish freely diffusing actin monomers in solution (G-actin monomers) and actin monomers incorporated into filaments (F-actin monomers). While G-actin monomers perform two-dimensional random walks, F-actin monomers are part of one of the possible F-actin subpopulations and are transported away from the leading edge with the network. The F-actin subpopulations modeled are ATP-F-actin, ADP-F-actin, ADF/cofilin-F-actin, and tropomyosin-F-actin (Fig. 2). Filament transport with respect to the leading edge depends on the polymerization rate of the uncapped filaments at the leading edge. As a first approximation, we assume retrograde filament transport with constant velocity throughout the system based on observations of keratocytes (47–49). The network transport velocity is derived for each time step by taking the arithmetic mean of all growing plus-ends within 100 nm behind the leading edge.
In each time step, all F-actin monomers are addressed independently for stochastic binding and unbinding of several actin-associated proteins. The simulation includes plus-end capping (e.g., by CapZ), minus-end decapping, ADF/cofilin and tropomyosin binding to F-actin, ADF/cofilin unbinding, and ADF/cofilin-induced severing as well as filament annealing. The rates and rate constants used are given in Table 1.
Filament nucleation takes place exclusively at the leading edge (x = 0) with a constant rate rnuc (see Table 1). Experimentally observed ±35° angles are assigned randomly to all newly formed filaments (2,32). Actin polymerization at uncapped plus-ends depends on local G-actin concentration, whereas actin disassembly at the minus-ends is concentration-independent (34) but varies strongly for actin decorated with ADF/cofilin or tropomyosin. ADF/cofilin binding to F-actin enhances actin monomer dissociation from the minus-end 20–30-fold (30-fold in our model) (33). Thus, in agreement with indications from a majority of experimental studies on ADF/cofilin behavior, we consider ADF/cofilin to increase depolymerization (33–35). Contrary hypotheses that ADF/cofilin might act as a polymerization promoter have not been included in our model (36). Nevertheless, we are able to reproduce findings from Ghosh et al. (36). In vitro experiments show that binding of ADF/cofilin additionally promotes filament severing (37,50). In our model, severing takes place at F-actin monomers decorated with ADF/cofilin with a severing rate rsev. In contrast to ADF/cofilin, tropomyosin decoration has a strong stabilizing effect on F-actin by slowing down minus-end depolymerization (51) and inhibiting filament severing (52).
To focus on tropomyosin's main functions, filament stabilization and inhibition of ADF/cofilin binding, we ignore its detailed molecular structure. Tropomyosin-binding behavior is reduced in complexity by assuming it to attach to single F-actin monomers with a constant rate rtm instead of binding to six or seven neighboring monomers as reported by Cooper (53). Thus, we explore the lower bounds of the effects caused by tropomyosin binding. Functions of tropomyosin other than blocking of ADF/cofilin binding and inhibition of filament severing (e.g., promotion of annealing) have not been included in our model.
ADF/cofilin preferentially binds to ADP-F-actin, which results in binding characteristics that are delayed by ATP hydrolysis (33). Significantly lower binding rates to ATP-F-actin are neglected and we assumed a similar binding behavior for tropomyosin. Thus, in our model both ADF/cofilin and tropomyosin only bind to ADP-F-actin. Random hydrolysis is assumed (54) with an ATP-hydrolysis rate of rhyd ∼ 0.3 s−1 (Table 1). In vitro, both ADF/cofilin and tropomyosin have been shown to bind to ADP-F-actin with high affinity, leading to negligible unbinding rates regarding the short turnover times in motile cells (55). However, based on indications from live-cell experimental data we assume that ADF/cofilin can be deactivated, most likely by phosphorylation (e.g., by Lim kinases) (30,56,57). We incorporated this deactivation by assuming a significantly higher unbinding rate for this molecule. Lacking experimental data, the respective intracellular ADF/cofilin unbinding rate  remains the model's primary unknown quantity. We used
  as a fitting parameter leading to testable predictions for the ADF/cofilin unbinding rate.
The convergence zone in our model is not described by molecular mechanisms and is primarily phenomenologically motivated. At the rear of the actin network extension, molecular motors (e.g., myosin II) are highly enriched, which leads to network contraction (58). It has been shown that within the convergence zone, actin depolymerizes and that this depolymerization is coupled to myosin activity (14). From the leading edge, the dense actin network extension typically spans ∼10 μm (11), which justifies the choice of our simulation geometry. We assume all filaments to be rigid rods, which is a reasonable approximation because simulated mean filament lengths are typically ∼0.5 μm, and hence clearly below the persistence length of actin filaments (59). The actin network within the lamellipodium is a dense entangled network (2,32), and several authors assume that it is highly cross-linked by transient cross links (39–41). This is reflected by the fact that the actin gel within the lamellipodium is only weakly compressible, which makes the description as an incompressible gel a reasonable simplification (41). Furthermore, it has been found for migrating keratocytes that actin filaments remain approximately stationary relative to the substrate (47–49). Based on these findings, we assume stiff coupling between the pushing filaments at the front and the whole actin network. This approach excludes any conclusions concerning changes in filament ordering, bending, or elastic properties of the growing network. Our main interest, however, is not a detailed structural reproduction of the leading actin network but an explanation of the separation of the two distinct networks by means of self-organization. Similar to Mogilner and Edelstein-Keshet (28), we effectively consider Arp2/3 a minus-end capper. Newly generated filaments have capped minus-ends, and uncapping takes place with a rate ruc ∼ 0.5 s−1 (Table 1). Thus, we do model Arp2/3 branching but—for technical reasons—do not model Arp2/3 branching geometry in detail. It should be mentioned at this point that it is still uncertain to which extent Arp2/3-induced branches dominate the leading actin network (12,13). Finally, consistent with the effect of high cellular concentrations of profilin and other sequestering proteins, minus-end growth as well as spontaneous filament nucleation are neglected (34).
RESULTS AND DISCUSSION
Experimental data from motile cells can be reproduced
Using model parameters for keratocytes based on estimates or taken from literature (Table 1), we obtained actin network properties in agreement with experimental data. We typically achieved growth velocities between 10 and 15 μm/min and filament densities of ∼500 filaments intersecting an area of 1 μm2, which is consistent with experimental data (1,2,13,60). Under the assumption that all filaments adopt angles of ±35° with respect to the normal to the front, this filament density corresponds to an F-actin concentration of ∼400 μM.
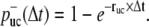
A comparison with data from Svitkina and Borisy (11) shows that simulated F-actin and ADF/cofilin-F-actin profiles agree well with measured fluorescence curves (Fig. 4). In particular, fluorescence data (11) show a crossover of bound ADF/cofilin intensity and F-actin intensity, i.e., the fraction of F-actin decorated with ADF/cofilin decreases after reaching a first maximum at ∼2 μm. This can only be explained with an ADF/cofilin deactivating element, which in our model is realized by a combination of ADF/cofilin unbinding ( ) and tropomyosin binding (rtm), and with a timescale of ADF/cofilin deactivation of a few seconds. Spatial separation could only be achieved with a significant difference between ADF/cofilin and tropomyosin unbinding rates. Whenever the unbinding rates of ADF/cofilin and tropomyosin were similar, the respective distributions showed no spatial separation, and fluorescence data could not be reproduced (Data S1), not even with unrealistically pronounced differences in binding rates (data not shown). ADF/cofilin unbinding rates (
 ) necessary to reproduce the fluorescence curves from Svitkina and Borisy (11) are typically ∼0.2 s−1, while at the same time tropomyosin unbinding is assumed to be negligible.
FIGURE 4.

Simulated concentration curves for F-actin, ADF/cofilin-F-actin, and tropomyosin-F-actin, normalized to compare results with experimental fluorescence curves (11). (A) F-actin as well as ADF/cofilin-F-actin signals are in good agreement with data from Svitkina and Borisy (11). ADF/cofilin-decorated F-actin dominates within the first ∼2 μm, whereas for x ≥ 2 μm, tropomyosin is the dominating element. (B) Localization of the ADF/cofilin-F-actin maximum shows a strong dependence upon variation of the hydrolysis rate rhyd for the ATP-F-actin → ADP-F-actin reaction. AC, ADF/cofilin; TM, tropomyosin.
The transition from mainly short to mostly long actin filaments takes place at ∼1 μm (Fig. 5 B), which is in good agreement with experimental observations (2,7).
FIGURE 5.

Simulated actin network characteristics, indicating a transition between two distinct substructures that is located ∼1–2 μm behind the leading edge. (A) The uncapped minus-end concentration Muc(x) reaches a maximum at x ∼1.5 μm. Similarly, the total depolymerization flux Jd shows a maximum between 1 and 2 μm. (B) The mean dissociation rate Jd(x)/Muc(x) shows a maximum at 1.5–2 μm. The mean filament length strongly increases within the first ∼1 μm, an important indicator of the transition between the two distinct substructures. The F-actin concentration steadily decreases within the lamellum. Lp, lamellipodium; La, lamellum.
Speckle microscopy studies have revealed that most of the actin disassembly takes place within the lamellipodium and the lamellipodium-lamellum junction (14). We show that depolymerization throughout the network depends strongly on the protective function of tropomyosin, i.e., on assumed tropomyosin binding kinetics (Fig. 6). Without tropomyosin, the depolymerization flux had a maximum at 2–2.5 μm, and actin disassembly was less pronounced within the first 2–3 μm. With tropomyosin the depolymerization flux is limited to a higher degree to the front part of the network (Fig. 6 A). In agreement with findings from Schaub et al. (49) and Ponti et al. (7), we find that polymerization takes place within a narrow zone at the leading edge (within a few nanometers; data not shown).
FIGURE 6.

Dependence of F-actin network properties on tropomyosin binding rate rtm (left panel) and ADF/cofilin binding rate rac (right panel). (A) Depolymerization flux decreases with increasing tropomyosin binding rate. The maximum of the depolymerization flux shifts toward the leading edge from ∼3 μm without tropomyosin to ∼1 μm with a high tropomyosin binding rate. (B) Mean dissociation rate strongly depends on tropomyosin binding. Without tropomyosin the mean dissociation rate reaches a plateau after ∼3 μm, while with tropomyosin a local maximum appears, with position and height depending on tropomyosin binding rate. (C) The decline of F-actin concentration decreases upon enhanced tropomyosin binding. (D) Depolymerization flux increases with increasing ADF/cofilin binding rates rac. (E) Higher depolymerization flux is based on a strong increase of the mean dissociation rate. Increase of ADF/cofilin binding shifts the maximum off-rate away from the leading edge. (F) F-actin concentration drops due to enhanced disassembly when ADF/cofilin binding rates are increased. Spatial separation into ADF/cofilin-dominated and tropomyosin-dominated substructures is more pronounced with higher ADF/cofilin binding rates. All rates were set to the values given in Table 1 except those illustrated within the respective figures. AC, ADF/cofilin; TM, tropomyosin.
The lamellum is not an independent structure but evolves from the lamellipodium by means of self-organization
Using the Monte Carlo simulation described, we obtained two distinct substructures within the growing actin network. The two distinct subnetworks achieved can be characterized by at least three properties (Fig. 5):
Within the initial ∼1 μm, we found a transition from short filaments to significantly longer ones.
The actin disassembly profile drops after the first ∼1–2 μm, where it has its maximum. Related to this, we found a drop of the minus-end concentration as well as a maximum of the mean dissociation rate at ∼2 μm, respectively.
The actin network organized into a mostly ADF/cofilin-dominated front part and a subsequent tropomyosin-dominated section. This is in good agreement with experimental observations (8,9), which point out that tropomyosin is absent from regions of the leading edge. Thus, tropomyosin can potentially be considered a marker of the lamellum.
As a further important aspect of the lamellipodium-lamellum system, Ponti et al. (7) found distinct kinematics for the lamellar and lamellipodial actin network. These characteristics observed in epithelial cells, however, are not present in the fast moving keratocytes (48). Since we use the keratocyte as our primary model system, our aim was not to reproduce the two kinematically distinct actin networks. It would be necessary to abandon the assumption of incompressibility to allow different transport velocities within the actin network. This could be part of future modeling attempts.
The criteria mentioned directly correspond to criteria used by various experimentalists to distinguish lamellipodium and lamellum (7,10,14). Thus, we suggest that both networks do not form due to independent mechanisms but originate from the same source, i.e., from Arp2/3-induced nucleation at the leading edge. This also means that, although lamellipodium and lamellum are structurally and spatially distinct networks, we do not expect them to be stacked on top of each other, consistent with assumptions by Danuser (61) and Koestler et al. (13). With nucleation taking place exclusively at one side and the polymerization driving the network along one specific direction, the system possesses internal polarity. The temporal separation imprinted in a multistep reaction scheme is thus translated into a spatial separation manifested as two different network structures.
The steep increase of actin filament length at a certain distance from the leading edge can be better understood by examining filament length distributions (Fig. 7). At the leading edge, we find an exponentially decaying distribution that mainly arises from stochastic plus-end capping. Subsequently the capped filaments are transported backward and continuously depolymerize at their minus-ends. Although short as well as long filaments depolymerize from their minus-ends, the system starts with a higher number of short filaments that vanish quickly. Thus, the filaments that remain after the first micrometer do not show an exponential length distribution and are, on average, much longer. This finding might also explain quantitative fluorescence speckle microscopy data (7): similar to Koestler et al. (13), we suggest that long-lived speckles can be understood to belong to the long filaments while the short-lived speckles predominantly emerge from the many short filaments at the leading edge and vanish quickly.
FIGURE 7.

Filament length distribution at different distances x from the leading edge depending on filament severing and annealing. (Top row) Length distributions without severing and annealing. At the leading edge (x = 0–0.1 μm), filament length is distributed nearly exponentially. At x = 1–1.1 μm, the pronounced peak of short filaments has vanished. (Center row) Length distributions with ADF/cofilin-induced filament severing. A second peak (marked black) at length ∼2.5 μm arises ∼5 μm behind the leading edge. (Bottom row) Length distributions with filament annealing. Filament annealing shifts the length distributions toward longer filaments. At distances >∼5 μm, short filaments are rare.
Self-organization of the network into two distinct substructures is a robust effect. We started from different initial conditions to study the stability of the system's steady state. Independent of whether all actin was initially purely monomeric or whether most of it was randomly distributed as actin filaments, the same steady-state network was obtained (Fig. 3).
Interestingly, even in the absence of tropomyosin, the network formed two distinct actin sections (Fig. 6). In addition, in the presence of tropomyosin we can distinguish an ADF/cofilin dominated region closer to the leading edge and a mostly tropomyosin-dominated region closer to the rear (Figs. 4 and 6). This is in agreement with fluorescence measurements in epithelial cells (8) and fibroblasts (62). Since tropomyosin inhibits Arp2/3-induced filament branching (63), this distribution could account for the mostly unbranched architecture of the lamellar actin network (2). Moreover, we found that the stabilizing effect of tropomyosin indeed plays a fundamental role in the self-organization process of the actin network: by varying the tropomyosin-binding rate, the F-actin concentration curve as well as the actin disassembly profile can be adjusted (Fig. 6). Moreover, we find that an increased tropomyosin binding rate (i.e., an increased tropomyosin concentration) slows down the network growth significantly and shortens the lamellipodium (Fig. 6 and Fig. 8 A). This is consistent with experimental data that state a loss of the lamellipodium and a decreased protrusion time after injection of skeletal tropomyosin into epithelial cells (15).
FIGURE 8.

Network growth velocities as functions of ADF/cofilin and tropomyosin binding rates. (A) Increased tropomyosin binding rates slow down network growth by limiting actin turnover (Fig. 6, A and B). (B) Higher ADF/cofilin binding rates result in faster actin turnover (Fig. 6, D and E), increasing network growth velocity. Error bars are standard deviations (n = 8 simulation runs for each data point).
We find drastic changes of the network properties upon regulation by ADF/cofilin. As expected, raised ADF/cofilin binding rates (i.e., higher ADF/cofilin concentrations) lead to a higher mean dissociation rate (Fig. 6 E) and thus to significantly higher depolymerization flux (Fig. 6 D). This enhances actin turnover and accounts for the more rapid decline of the F-actin concentration (Fig. 6 F). Due to the faster turnover, we observe higher growth velocities (Fig. 8 B), which is in agreement with experimental observations on migrating cells upon activation of caged cofilin (36).
Filament severing and annealing regulate network properties
ADF/cofilin-induced severing has little effect on the overall depolymerization profile but changes the filament length distribution, which is consistent with Monte Carlo simulation results obtained by Fass et al. (44). Astonishingly, a strong increase of ADF/cofilin induced filament severing leads to only slightly increased depolymerization (Fig. 9 A). Counterintuitively, filament severing was found to drastically increase mean filament length (Fig. 9 B). This can be explained by the fact that severing by ADF/cofilin creates both a new minus- and a new plus-end. Although the minus-ends constantly depolymerize while the plus-ends are capped relatively quickly, the very high G-actin concentrations within the lamellum (50–100 μM; Fig. 1 D) result in significant filament elongation before capping. Simple calculations render this hypothesis plausible (Appendix and Data S1). In agreement with the calculations, we see a filament-shortening effect within the first 2 μm and a filament-lengthening effect further back (Fig. 9 B). The increase in the number of filaments due to severing, together with the observed filament lengthening effect, leads to an increase of the total amount of polymerized actin, explaining experimental findings from Ghosh et al. (36). We observed an increase from 74% of actin in its filamentous form without severing to 84% with high severing activity (rsev = 2 × 10⁻⁴ s−1; data not shown).
FIGURE 9.

Filament severing (left panel) and annealing (right panel) significantly alter actin network design. (A) ADF/cofilin-induced filament severing slightly effects the depolymerization flux. (B) Severing causes significantly increased mean filament lengths due to rapid elongation of newly created plus-ends at the rear of the network filaments. (C) Filament annealing leads to a shift of the depolymerization flux maximum toward the leading edge and strongly decreases the depolymerization flux further away from the leading edge. (D) Mean filament length strongly increases upon enhanced annealing. All rates were set to the values given in Table 1 except those illustrated within the respective figures.
In addition to severing, filament annealing also induces an increase of mean filament lengths, which was observed in several in vitro studies (42,43). The role of filament annealing in motile cells, however, is still a matter of debate (57). In particular, it remains uncertain to what extent annealing takes place between CapZ-bound filaments. It has been shown that annealing still occurs in the presence of high CapZ concentrations, but with drastically reduced rates (43). Tropomyosin, on the other hand, might enhance filament annealing (42). Based on Andrianantoandro et al. (43) and Fass et al. (44), we incorporated filament annealing dependent upon both the local mean filament length and the local filament concentration (see Methods for detailed description).
Annealing rate constants k with significant effects on network properties were found to be in the range of 0.05 μM−1 s−1 to 0.5 μM−1 s−1 times filament length in subunits (Fig. 9, C and D). Below this range, annealing was too slow in comparison to the short network lifetime (∼1 min) to significantly affect it. Annealing rates above this range were unrealistically fast. The rates found are plausible with regard to experimental data (42,43) (see Appendix). Filament annealing has two main effects: First, it drastically increases the mean filament length (Fig. 7 and Fig. 9 D); and second, annealing strongly decreases the number of free minus-ends, which lowers the total integrated depolymerization flux. Reducing the number of minus-ends also slows down the turnover of the network, and hence we observe a depolymerization flux that concentrates closer to the leading edge (Fig. 9 C).
It might be a combination of annealing and severing that accounts for the very long actin filaments in lamellar networks. Furthermore, cross-linker proteins such as filamin interconnect actin filaments and hence will also crucially determine cytoskeletal architecture. Filamin induced cross linking leads to weblike actin networks (39) and might combine actin filaments in a way such that barely any free ends remain visible, as seen in electron micrographs (2,11).
Another important parameter for regulating the mean filament length is the capping rate rcap. As expected, we found that (while adjusting the nucleation rate to obtain similar velocities) the average filament length increases with decreased capping rates (Data S1). Knowing that all three mechanisms—severing, annealing, and decreased capping rates—produce longer filaments, it is difficult to tell which one might dominate in cells. Regulating filament length via capping does not appear a very reasonable strategy for cells due to the strong effect capping has on many network properties in parallel such as density of growing plus-ends, growth velocity, or F-actin concentration. We found that both annealing and severing only slightly affect the overall F-actin concentration and depolymerization profile but have a strong impact on mean filament length. Little is known about filament annealing and severing in vivo. Considering the fact that most filament plus-ends are tightly bound to capping protein, the detailed mechanism of filament annealing remains vague. In vitro experiments, however, indicate that annealing still occurs, although strongly decreased (43). Severing is very likely to be important in lamellipodial networks, and internal stress might even increase severing rates known from in vitro studies. At this point, it is not possible to determine whether annealing, severing, or both are mainly responsible for the filament lengthening observed in cells. However, based on the two very distinct length distributions we observed (Fig. 7), this probably can be revealed by more detailed analysis of the lamellar network (see Appendix, Experimental Tests of the Model).
CONCLUSIONS
Through the use of a simplified two-dimensional in silico model of the cytoskeletal extension of motile cells, this study demonstrates the system's ability to form two distinct self-organized networks which coincide with the lamellipodium and the lamellum discussed in the literature. Within the first 1 μm from the leading edge we found a transition from short to longer actin filaments. Approximately 1–2 μm behind the leading edge the depolymerization flux reaches its maximum and drops within the subsequent part of the simulated network. These findings were robust with respect to a variation of the initial conditions.
These findings prove that two different networks can form without the need to assume multiple distinct nucleation mechanisms. A single filament nucleation mechanism, stochastic capping, F-actin transport and (de-) polymerization at the filament ends are already sufficient for a spatial separation into two distinct zones by means of self-assembly. In contrast, the role of alternative nucleation mechanisms like formins for lamellipodium and lamellum formation remains poorly understood, demanding further experimental and theoretical studies (31).
By comparison to existing experimental data we found that a molecular mechanism that causes ADF/cofilin detachment is necessary to explain observed ADF/cofilin and tropomyosin distributions in cells (8,9,11). We proposed and quantitatively tested a plausible reaction scheme that leads to respective domination of ADF/cofilin at the front and of tropomyosin further back. The spatial separation of ADF/cofilin- and tropomyosin-dominated compartments that we found in the simulated networks is of great interest given the fact that tropomyosin binding has been shown to inhibit Arp2/3-induced filament branching in vitro (63). This suggests that the tropomyosin-enriched lamellum can be associated with Arp2/3 suppression, leading to a network without Arp2/3 branches. This is in agreement with electron micrographs and fluorescence stains showing the Arp2/3 distribution in cells (11). In addition, we found that filament stabilization by tropomyosin plays a crucial role in regulating the depolymerization flux and F-actin concentration profiles.
In our model, filament length within the lamellum was controlled by varying severing activity or filament annealing rates. An increase of either one results in higher mean filament lengths within the lamellum. High annealing rates dramatically increase the mean filament length within the lamellum, with a strong decrease in the fraction of short actin filaments. More knowledge of the molecular details of filament annealing is necessary, however, to further understand its role in the establishment of lamellar architecture. Annealing rates sufficient to significantly alter mean filament lengths in our model are 1–2 orders-of-magnitude below values measured in vitro in the absence of capping protein but are in good agreement with decreased values in the presence of capping protein (43). The role of tropomyosin and capping protein in regard to filament annealing will have to be investigated further to draw conclusions on in vivo annealing behavior. Moreover, the influence of the structural order inherent to the actin network on annealing has not yet been considered.
It has already been argued by various authors that, due to the creation of new plus-ends, ADF/cofilin induced severing causes an increase of total F-actin instead of simply enhancing actin network disassembly, which is confirmed by our results. Additionally, we found that filament growth after severing is sufficient to even yield a net increase of average filament length. This is due to the high G-actin concentrations further back from the leading edge of the simulated actin network. Although both severing and annealing cause an increase of the mean filament length, the respective filament distributions for each mechanism differ strongly. While annealing reduces the number of short filaments and thus shifts the length distribution to longer ones, filament severing induces a second subpopulation of long filaments that exists in addition to the main population of filaments of shorter lengths.
We still find an irreconcilable gap between in vitro measurements and in vivo data. The in vivo visualized spatial offset between F-actin and ADF/cofilin-F-actin (11) (Figs. 4 and 10) could be reproduced using an actin hydrolysis rate of ∼0.3 s−1, a value that corresponds to the rate for the ATP-actin → ADP+Pi-actin reaction measured in vitro (54). It is known that actin hydrolysis is followed by release of phosphate on a timescale of minutes in vitro (33) and that this step is requisite for efficient ADF/cofilin binding (34). We found, however, that lower simulated hydrolysis rates shift the distribution of F-actin bound ADF/cofilin in such a way that agreement with in vivo data could no longer be obtained. Our results thus show that if phosphate release is really necessary for efficient ADF/cofilin binding, it must be drastically accelerated in cells.
FIGURE 10.

Computer-generated pseudo-fluorescence signals. The simulated F-actin network (A) is coarse-grained using a Gaussian blur to mimic the optical resolution limit of light microscopy (see text), yielding pseudo-fluorescence F-actin (B) and ADF/cofilin (C) signals. An angular variance of 15° was used. (D) Overlay of F-actin and ADF/cofilin signal is in qualitative agreement with experimental data (11).
Investigating the processes underlying the formation of the convergence zone between lamellum and cell body will be of enormous relevance for a greater understanding of cell migration. The observed steep decline of F-actin concentration can probably not be explained by currently known actin disassembly mechanisms. Using an ad hoc mechanism we found that an actin disassembly zone at the rear of the network plays a crucial role for cell motility. Without this boundary condition, network growth slows down significantly and network extensions reach values far beyond those observed in vivo.
A more detailed knowledge about several essential molecular players will be necessary to both further understand actin network growth in motile cells and test the presented model (additional tests of our model are proposed in the Appendix). More quantitative data on ADF/cofilin regulation in cells will help us to understand its role in modulating the network design. Little is known about the interactions between tropomyosin and ADF/cofilin or Arp2/3. A richer understanding of these fundamental mechanisms may shed light on the significant differences between results obtained in reconstituted motility assays and those from motile cells (31). To this end, extended reconstituted model systems could address several of these important remaining open questions regarding lamellar organization, thus providing a more extensive understanding of this important cellular component.
SUPPLEMENTARY MATERIAL
To view all of the supplemental files associated with this article, visit www.biophysj.org.
Supplementary Material
Acknowledgments
We thank Dr. Madan Rao, Dr. Alexander Verkhovsky, Brian Gentry, and Dr. Michael Bachmann for helpful discussions as well as the reviewers for helpful suggestions and comments.
This work was supported by Leipzig School of Natural Sciences, “Building with Molecules and Nano-Objects” (BuildMoNa), and the EC Sixth Framework Program (STREP Active Biomics contract No. NMP4-CT-2004-516989.
APPENDIX
Nucleation
The process of actin filament nucleation, i.e., the creation of new actin filaments, is the subject of a rich field of ongoing research. The most common forms of actin nucleation treated in literature are Arp2/3-driven nucleation (F-actin-dependent tip and side branching, and F-actin-independent de novo nucleation (64)), spontaneous nucleation, and nucleation by formins and spire protein. Profilin and thymosin-β4 are known to strongly inhibit spontaneous nucleation in cells, and so we assume spontaneous nucleation to be negligible (34). Furthermore, formins have mostly been associated with filopodial growth. For lamellipodial actin growth there is no clear evidence that formins play a significant role, which is why we only focus on Arp2/3-driven filament generation.
To nucleate filaments, Arp2/3 has to be activated by WASP/WAVE proteins that are located at the plasma membrane. It is still a matter of debate whether the Arp2/3 complex diffuses freely after activation or remains attached to the WASP/WAVE protein (26,64,65). Following arguments from Carlsson (22), we consider a nucleation scenario where Arp2/3 and its activation are rate-limiting. Thus, new filaments form at a rate nearly independent of the F-actin concentration at the leading edge, and we assume a constant nucleation rate rnuc (in μm−1 s−1). The assumption of a constant nucleation rate is adequate for our purpose of focusing on steady-state conditions (28). The total number of growing plus-ends in the system's steady state can be calculated from the nucleation rate rnuc and the capping rate rcap (in μm−1 s−1 and s−1, respectively) as
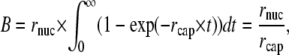 |
(7) |
where B is a one-dimensional number density. One possible way to determine B for living cells are stall force measurements. Using AFM techniques, stall forces for keratocyte lamellipodia have been obtained (60,66). In combination with the Brownian ratchet model it is possible to infer the density of growing actin filaments, which then corresponds to ∼100 polymerizing actin filaments per micrometer of the leading edge (66). This filament density is in agreement with previous estimates by Abraham et al. (46). Assuming that capping takes place with a rate of rcap ∼1 s−1 (34,67), we therefore estimate the steady-state nucleation rate to be 100 μm−1 s−1.
Detailed studies of the initiation phase of actin network growth would demand more sophisticated nucleation models, which include all main parts of the activation cascade (65). As an alternative to the assumption of a constant nucleation rate, we tested G-actin-dependent nucleation with a linear relation between the G-actin concentration at the front and the nucleation rate. In Data S1, we present data obtained with G-actin-dependent nucleation, which is very similar to steady-state results with a constant nucleation rate. Upon variation of the simulations parameters, however, the system reacts slightly differently (see Data S1). This has been expected, because any nonconstant nucleation rate introduces a feedback mechanism. This might include an F-actin or a G-actin dependence, which will be systematically studied in future simulation approaches.
Total actin concentration
Various approaches have been used to determine the total lamellipodial actin concentration. It is believed that most of the lamellipodial actin is in its filamentous form. Fleischer et al. (40) estimated the actin concentration to be ∼250 μM by comparing tessellation models to electron micrographs. Schaub et al. (32) compared coarse-grained simulation data with fluorescence pictures and electron micrographs and found an actin concentration of ∼900 μM. Upon variation of the total actin concentration we obtained the best fit for an actin concentration of 350 μM (data not shown). This total actin concentration was used for all data shown.
Debranching
In our model we consider Arp2/3 debranching as minus-end decapping, similar to Mogilner and Edelstein-Keshet (28). Although debranching caused by ATP hydrolysis on Arp2/3 has been studied in vitro (68), the measured rates are far too low to explain electron micrographs of keratocyte lamellipodia/lamella (2), which show that the Arp2/3 induced branches are limited to the foremost 1-μm region of the cytoskeleton. Assuming a typical network transport velocity of ∼0.25 μm/s, we estimated the debranching rate ruc to be ∼0.5 s−1.
Tropomyosin and ADF/cofilin binding
ADF/cofilin binding rate constants have been estimated by Blanchoin and Pollard (69) and Muhlrad et al. (70). Typical cellular ADF/cofilin concentrations are in the range of 20–100 μM (34). We ignore effects of cooperative binding and simply assume a single constant binding rate rac to ADP-F-actin of 0.5 s−1, which corresponds to a concentration of ∼10 μM of free ADF/cofilin. The resulting F-actin-bound ADF/cofilin concentrations are typically ∼100 μM, which determines the ratio of unbound/bound ADF/cofilin to be ∼1:10.
Depending on the choice of the ADF/cofilin binding and unbinding rates (rac,  ), different tropomyosin binding rates rtm lead to reasonable agreement with fluorescence data. For plausible ADF/cofilin binding rates of ∼0.5–1 s−1, those of tropomyosin have to be ∼0.1–1 s−1. This is in good agreement with in vitro assays where the half-time of tropomyosin assembly with actin filaments was found to be ∼1 s−1 (71). Based on experiments carried out by Ono and Ono (55), we assume tropomyosin unbinding to be negligible on the short timescales relevant for the system presented.
Together with the first-order hydrolysis reaction of F-actin monomers, tropomyosin and ADF/cofilin binding and unbinding can be described using the chemical rate equations
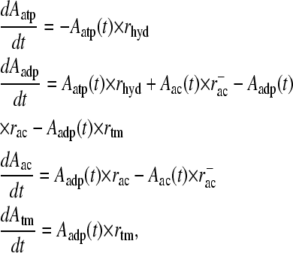 |
(8) |
where Aatp, Aadp, Aac, and Atm stand for the respective fraction of ATP-F-actin, undecorated ADP-F-actin, ADF/cofilin-bound F-actin, and tropomyosin-bound F-actin. Together with appropriate boundary conditions
 |
 |
(9) |
these equations can be solved analytically, yielding
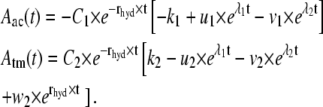 |
(10) |
The constants within the exponential can be calculated to be
 |
(11) |
while the constants k1, k2, u1, u2, v1, and v2 only depend on the system parameters rhyd, rac,  and rtm.
Filament severing
Filament severing is still a controversial topic. Although it has clearly been shown that severing occurs in vitro, the biological implications and its role in cell migration are not well understood (31,72). In vitro experiments have shown that actin filament fragmentation is promoted by ADF/cofilin (37,50). Obtained severing rates differ strongly, and the dependence of the severing rate on ADF/cofilin concentration remains uncertain (37). Mogilner and Edelstein-Keshet (28) assumed a constant severing rate along filaments of ∼1 × 10⁻³ s−1 per F-actin monomer in cells. In the in vitro experiments, values down to 3 × 10⁻⁵ s−1 per monomer have been measured using cofilin concentrations of only 10 nM (37). These values are consistent with estimates by Carlsson (73), who modeled filament severing in vitro with rates in the range of 1 × 10⁻⁶ to 5 × 10⁻⁶ s−1 per subunit. This gives a range of severing rates between 1 × 10⁻⁶ s−1 and 1 × 10⁻³ s−1 per F-actin monomer that has been used in this study. Severing rates of ∼10−3 s−1 have a far too drastic effect on F-actin network, while rates at ∼10−6 s−1 have no visible effect on network properties. Modulation of the actin network by severing rates between 10−5 s−1 and ∼10−4 s−1 is shown in Fig. 9.
In contrast to previous studies which found that severing reduces the filament length (37,50), we obtained a significant increase of the mean filament length due to filament severing. A simple calculation shows that this effect can be explained by the overcompensation of shortening by growth due to elevated G-actin concentrations away from the leading edge. If we take a typical filament with a length of 0.5 μm and with a capped plus-end, the mean filament length  will drop from
  to
to  upon severing. In our case, however, severing induces one uncapped plus-end that will continue to grow until being capped. Taking typical capping rates, the half-life of an uncapped end is ∼1 s, and thus the increase in length during this period is Δl = δ × (
 ) (see Table 1). As shown in Fig. 1, the G-actin concentration away from the leading edge is much higher than at the front with typical values of ∼50 μM. This gives a mean elongation Δl of the filament of ∼1.5 μm, which leads to a new mean filament length of
  +
+  In good approximation, depolymerization will take place at a very similar rate at both minus-ends and thus does not affect this simple calculation. Furthermore, whenever the severed front (i.e., capped) part of the filament is short, it will vanish quickly and thus enhance the increase of the mean filament length. The mean filament length curves in Fig. 9 clearly show that, in the front region, severing has a shortening effect while further back, the mean length increases. A more detailed analytic analysis of this effect can be found in Data S1.
Filament annealing
Filament annealing is considered a second-order reaction that depends on filament length (42,43). The way annealing is incorporated in our model is described in detail in Methods. In vitro experiments resulted in diverse estimates for filament annealing rates. Whereas Andrianantoandro et al. (43) estimated the proportionality constant (see Eq. 6) to be ∼1000 μM−1 s−1 times filament length in subunits, Teubner and Wegner (42) appraised an annealing rate constant of ∼1 μM−1 s−1 without considering the influence of filament lengths. Thus, for typical filament lengths in our simulated networks of ∼100 subunits or more, the given annealing rates are in the range of 1–10 μM−1 s−1. It was found that saturating concentrations of capping protein strongly decrease annealing rates, probably by a few orders of magnitude (43). This would agree with the annealing rates for which we found significant effects on network properties (0.05–0.5 μM−1 s−1 times filament length in subunits). However, the detailed mechanisms by which capping proteins and tropomyosin alter filament annealing behavior remains largely unknown. Filament ordering (as observed in dense actin networks) might have an additional effect on the annealing rate.
Choice of time discretization and probe area
The fastest actin binding proteins in our model are capping protein and ADF/cofilin, both with binding rates of ∼1 s−1. We found that the depolymerization flux peaks at ∼1–2 μm from the leading edge. Virtually all growing plus-ends are located in very close proximity to the leading edge, thus an actin monomer typically has to diffuse at least ∼1 μm before adding to an uncapped plus-end. To treat actin diffusion accurately, a simulation time step should be smaller than this typical lifetime of an actin monomer in solution. Taking a G-actin diffusion coefficient of D = 5 μm2 s−1 (74) and Eq. 1, a time step has to fulfill Δt < 0.1 s, which justifies our time discretization of, typically, 50 ms. We further tested the dependence of simulation results on the choice of the time step and found no significant differences when we used slightly longer or clearly shorter time steps (10–100 ms, data not shown).
The probe area used is chosen based on the length of the time step and the diffusion coefficient. We studied the effect of varying the probe size on the simulation results. We found that the overall network properties remained virtually unchanged as long as the probe area remained large enough to contain a sufficient number of monomers to support filament growth during one time step (data not shown). Based on these tests we have chosen a time step of 50 ms for further simulations. This area is too large to capture the stochastics of filament growth on a molecular scale. However, we are interested in the overall network properties and do not aim to model the fluctuations on the millisecond scale.
Experimental tests of the model
Several testable predictions arise from our model. Regarding the time evolution of our system we believe that reconstituted in vitro experiments might shed light on the initiation of actin network growth. Starting with purely monomeric actin we see a very fast initial growth phase such that, within <1 min, ∼80% of the actin has already been converted into its filamentous form (Fig. 3 A). For the G-actin-dependent nucleation model, we observed faster F-actin saturation due to a higher initial nucleation rate (data not shown). Testing this initial growth phase in the context of our model would require tight control of the total actin content, demanding well-sealed microfabricated systems.
Specifically testing the predicted filament lengthening upon severing would demand in vitro experiments out of equilibrium, e.g., with G-actin concentrations much higher than the typical critical concentrations. One possible way to achieve this would be to use preformed actin filaments that are all capped at their plus-ends such that a high G-actin concentration can be maintained (∼20 μM or higher). Subsequent addition of ADF/cofilin will cause severing of capped actin filaments and should lead to an increase of the mean filament length as predicted by our model. Although both annealing and severing lead to an increase of the mean filament length, the respective length distributions differ (Fig. 7). In conjunction with a detailed analysis of actin filament lengths within motile cells, these distinct, predicted characteristics might provide a tool to determine the relative importance of filament annealing and severing in cells.
In Fig. 6 we show the effect of variation of tropomyosin and ADF/cofilin on the network properties. In vitro as well as in vivo experiments varying the respective protein concentrations should be able to test our model. Similar to previous experiments, it is possible to fluorescently image actin, ADF/cofilin, and tropomyosin in cells (2,8). In the case of keratocytes, the obtained distributions should be directly comparable to the curves shown in this article.
Editor: Michael Edidin.
References
- 1.Small, J. V., M. Herzog, and K. Anderson. 1995. Actin filament organization in the fish keratocyte lamellipodium. J. Cell Biol. 129:1275–1286. [DOI] [PMC free article] [PubMed] [Google Scholar]
- 2.Svitkina, T. M., A. B. Verkhovsky, K. M. McQuade, and G. G. Borisy. 1997. Analysis of the actin-myosin II system in fish epidermal keratocytes: mechanism of cell body translocation. J. Cell Biol. 139:397–415. [DOI] [PMC free article] [PubMed] [Google Scholar]
- 3.Footer, M. J., J. W. J. Kerssemakers, J. A. Theriot, and M. Dogterom. 2007. Direct measurement of force generation by actin filament polymerization using an optical trap. Proc. Natl. Acad. Sci. USA. 104:2181–2186. [DOI] [PMC free article] [PubMed] [Google Scholar]
- 4.Loisel, T. P., R. Boujemaa, D. Pantaloni, and M.-F. Carlier. 1999. Reconstitution of actin-based motility of Listeria and Shigella using pure proteins. Nature. 401:613–616. [DOI] [PubMed] [Google Scholar]
- 5.Mogilner, A., and G. Oster. 1996. Cell motility driven by actin polymerization. Biophys. J. 71:3030–3045. [DOI] [PMC free article] [PubMed] [Google Scholar]
- 6.Watanabe, N., and T. J. Mitchison. 2002. Single-molecule speckle analysis of actin filament turnover in lamellipodia. Science. 295:1083–1086. [DOI] [PubMed] [Google Scholar]
- 7.Ponti, A., M. Machacek, S. K. Gupton, C. M. Waterman-Storer, and G. Danuser. 2004. Two distinct actin networks drive the protrusion of migrating cells. Science. 305:1782–1786. [DOI] [PubMed] [Google Scholar]
- 8.Iwasa, J. H., and R. D. Mullins. 2007. Spatial and temporal relationships between actin-filament nucleation, capping, and disassembly. Curr. Biol. 17:395–406. [DOI] [PMC free article] [PubMed] [Google Scholar]
- 9.DesMarais, V., I. Ichetovkin, J. Condeelis, and S. E. Hitchcock-DeGregori. 2002. Spatial regulation of actin dynamics: a tropomyosin-free, actin-rich compartment at the leading edge. J. Cell Sci. 115:4649–4660. [DOI] [PubMed] [Google Scholar]
- 10.Chhabra, E. S., and H. N. Higgs. 2007. The many faces of actin: matching assembly factors with cellular structures. Nat. Cell Biol. 9:1110–1121. [DOI] [PubMed] [Google Scholar]
- 11.Svitkina, T. M., and G. G. Borisy. 1999. Arp2/3 complex and actin depolymerization factor/cofilin in dendritic organization and treadmilling of actin filament array in lamellipodia. J. Cell Biol. 145:1009–1026. [DOI] [PMC free article] [PubMed] [Google Scholar]
- 12.Resch, G. P., N. G. Kenneth, A. Hoenger, and J. V. Small. 2002. Pure F-actin networks are distorted and branched by steps in the critical-point drying method. J. Struct. Biol. 137:305–312. [DOI] [PubMed] [Google Scholar]
- 13.Koestler, S. A., S. Auinger, M. Vinzenz, K. Rottner, and J. V. Small. 2008. Differentially oriented populations of actin filaments generated in lamellipodia collaborate in pushing and pausing at the cell front. Nat. Cell Biol. 10:306–313. [DOI] [PubMed] [Google Scholar]
- 14.Vallotton, P., S. L. Gupton, C. M. Waterman-Storer, and G. Danuser. 2004. Simultaneous mapping of filamentous actin flow and turnover in migrating cells by quantitative fluorescent speckle microscopy. Proc. Natl. Acad. Sci. USA. 101:9660–9665. [DOI] [PMC free article] [PubMed] [Google Scholar]
- 15.Gupton, S. L., K. L. Anderson, T. P. Kole, R. S. Fischer, A. Ponti, S. E. Hitchcock-DeGregori, G. Danuser, V. M. Fowler, D. Wirtz, D. Hanein, and C. M. Waterman-Storer. 2005. Cell migration without a lamellipodium: translation of actin dynamics into cell movement mediated by tropomyosin. J. Cell Biol. 168:619–631. [DOI] [PMC free article] [PubMed] [Google Scholar]
- 16.Cameron, L. A., M. Tatyana, D. V. Svitkina, J. A. Theriot, and G. G. Borisy. 2001. Dendritic organization of actin comet tails. Curr. Biol. 11:130–135. [DOI] [PubMed] [Google Scholar]
- 17.Upadhyaya, A., J. R. Chabot, A. Andreeva, A. Samadani, and A. van Oudenaarden. 2003. Probing polymerization forces by using actin-propelled lipid vesicles. Proc. Natl. Acad. Sci. USA. 100:4521–4526. [DOI] [PMC free article] [PubMed] [Google Scholar]
- 18.Giardini, P. A., D. A. Fletcher, and J. A. Theriot. 2003. Compression forces generated by actin comet tails on lipid vesicles. Proc. Natl. Acad. Sci. USA. 100:6493–6498. [DOI] [PMC free article] [PubMed] [Google Scholar]
- 19.Boukellal, H., O. Camps, J.-F. Joanny, J. Prost, and C. Sykes. 2004. Soft Listeria: actin-based propulsion of liquid drops. Phys. Rev. E Stat. Nonlin. Soft Matter Phys. 69:061906. [DOI] [PubMed] [Google Scholar]
- 20.Mogilner, A. 2006. On the edge: modeling protrusion. Curr. Opin. Cell Biol. 18:32–39. [DOI] [PubMed] [Google Scholar]
- 21.Carlsson, A. E. 2001. Growth of branched actin networks against obstacles. Biophys. J. 81:1907–1923. [DOI] [PMC free article] [PubMed] [Google Scholar]
- 22.Carlsson, A. E. 2003. Growth velocities of branched actin networks. Biophys. J. 84:2907–2918. [DOI] [PMC free article] [PubMed] [Google Scholar]
- 23.Alberts, J. B., and G. M. Odell. 2004. In silico reconstitution of Listeria propulsion exhibits nano-saltation. PLoS Biol. 2:2054–2066. [DOI] [PMC free article] [PubMed] [Google Scholar]
- 24.Gerbal, F., P. Chaikin, Y. Rabin, and J. Prost. 2000. An elastic analysis of Listeria monocytogenes propulsion. Biophys. J. 79:2259–2275. [DOI] [PMC free article] [PubMed] [Google Scholar]
- 25.Bernheim-Groswasser, A., J. Prost, and C. Sykes. 2005. Mechanism of actin-based motility: a dynamic state diagram. Biophys. J. 89:1411–1419. [DOI] [PMC free article] [PubMed] [Google Scholar]
- 26.Atilgan, E., D. Wirtz, and S. X. Sun. 2005. Morphology of the lamellipodium and organization of actin filaments at the leading edge of crawling cells. Biophys. J. 89:3589–3602. [DOI] [PMC free article] [PubMed] [Google Scholar]
- 27.Schaus, T. E., E. W. Taylor, and G. G. Borisy. 2007. Self-organization of actin filament orientation in the dendritic-nucleation/array-treadmilling model. Proc. Natl. Acad. Sci. USA. 104:7086–7091. [DOI] [PMC free article] [PubMed] [Google Scholar]
- 28.Mogilner, A., and L. Edelstein-Keshet. 2002. Regulation of actin dynamics in rapidly moving cells: a quantitative analysis. Biophys. J. 83:1237–1258. [DOI] [PMC free article] [PubMed] [Google Scholar]
- 29.Rubinstein, B., K. Jacobson, and A. Mogilner. 2005. Multiscale two-dimensional modeling of a motile simple-shaped cell. Multiscale Mod. Sim. 3:413–439. [DOI] [PMC free article] [PubMed] [Google Scholar]
- 30.Bamburg, J. R. 1999. Proteins of the ADF/cofilin family: essential regulators of actin dynamics. Annu. Rev. Cell Dev. Biol. 15:185–230. [DOI] [PubMed] [Google Scholar]
- 31.Bugyi, B., C. Le Clainche, G. Romet-Lemonne, and M.-F. Carlier. 2008. How do in vitro reconstituted actin-based motility assays provide insight into in vivo behavior? FEBS Lett. 582:2086–2092. [DOI] [PubMed] [Google Scholar]
- 32.Schaub, S., J.-J. Meister, and A. B. Verkhovsky. 2007. Analysis of actin filament network organization in lamellipodia by comparing experimental and simulated images. J. Cell Sci. 120:1491–1500. [DOI] [PubMed] [Google Scholar]
- 33.Carlier, M.-F., V. Laurent, J. Santolini, R. Melki, D. Didry, G. X. Xia, Y. Hong, N. H. Chua, and D. Pantaloni. 1997. Actin depolymerizing factor (ADF/cofilin) enhances the rate of filament turnover: implication in actin-based motility. J. Cell Biol. 136:1307–1323. [DOI] [PMC free article] [PubMed] [Google Scholar]
- 34.Pollard, T. D., L. Blanchoin, and R. D. Mullins. 2000. Molecular mechanisms controlling actin filament dynamics in nonmuscle cells. Annu. Rev. Biophys. Biomol. Struct. 29:545–576. [DOI] [PubMed] [Google Scholar]
- 35.Bamburg, J. R., A. McGough, and S. Ono. 1999. Putting a new twist on actin: ADF/cofilins modulate actin dynamics. Trends Cell Biol. 9:364–370. [DOI] [PubMed] [Google Scholar]
- 36.Ghosh, M., X. Song, G. Mouneimne, M. Sidani, D. S. Lawrence, and J. S. Condeelis. 2004. Cofilin promotes actin polymerization and defines the direction of cell motility. Science. 304:743–746. [DOI] [PubMed] [Google Scholar]
- 37.Andrianantoandro, E., and T. D. Pollard. 2006. Mechanism of actin filament turnover by severing and nucleation at different concentrations of ADF/cofilin. Mol. Cell. 24:13–23. [DOI] [PubMed] [Google Scholar]
- 38.Käs, J., H. Strey, J. X. Tang, D. Finger, R. Ezzell, E. Sackmann, and P. A. Janmey. 1996. F-actin, a model polymer for semiflexible chains in dilute, semidilute, and liquid crystalline solutions. Biophys. J. 70:609–625. [DOI] [PMC free article] [PubMed] [Google Scholar]
- 39.Flanagan, L., J. Chou, H. Falet, R. Neujahr, J. Hartwig, and T. Stossel. 2001. Filamin A, the Arp2/3 complex, and the morphology and function of cortical actin filaments in human melanoma cells. J. Cell Biol. 155:511–517. [DOI] [PMC free article] [PubMed] [Google Scholar]
- 40.Fleischer, F., R. Ananthakrishnan, S. Eckel, H. Schmidt, J. Käs, T. Svitkina, V. Schmidt, and M. Beil. 2007. Actin network architecture and elasticity in lamellipodia of melanoma cells. New J. Phys. 9:420. [Google Scholar]
- 41.Kruse, K., J. F. Joanny, F. Jülicher, and J. Prost. 2006. Contractility and retrograde flow in lamellipodium motion. Phys. Biol. 3:130–137. [DOI] [PubMed] [Google Scholar]
- 42.Teubner, A., and A. Wegner. 1996. The rate of annealing of actin tropomyosin filaments depends strongly on the length of the filaments. Biochim. Biophys. Acta. 1297:214–218. [DOI] [PubMed] [Google Scholar]
- 43.Andrianantoandro, E., L. Blanchoin, D. Sept, J. A. McCammon, and T. D. Pollard. 2001. Kinetic mechanism of end-to-end annealing of actin filaments. J. Mol. Biol. 312:721–730. [DOI] [PubMed] [Google Scholar]
- 44.Fass, J., C. Pak, B. James, and A. Mogilner. 2008. Stochastic simulation of actin dynamics reveals the role of annealing and fragmentation. J. Theor. Biol. 252:173–183. [DOI] [PMC free article] [PubMed] [Google Scholar]
- 45.Born, M., and E. Wolf. 1999. Principles of Optics, 7th Ed. Cambridge University Press, Cambridge, UK.
- 46.Abraham, V. C., V. Krishnanmurthi, D. L. Taylor, and F. Lanni. 1999. The actin-based nanomachine at the leading edge of migrating cells. Biophys. J. 77:1721–1732. [DOI] [PMC free article] [PubMed] [Google Scholar]
- 47.Theriot, J. A., and T. J. Mitchison. 1991. Actin microfilament dynamics in locomoting cells. Nature. 352:126–131. [DOI] [PubMed] [Google Scholar]
- 48.Vallotton, P., G. Danuser, S. Bohnet, J.-J. Meister, and A. B. Verkhovsky. 2005. Tracking retrograde flow in keratocytes: news from the front. Mol. Biol. Cell. 16:1223–1231. [DOI] [PMC free article] [PubMed] [Google Scholar]
- 49.Schaub, S., S. Bohnet, V. M. Laurent, J.-J. Meister, and A. B. Verkhovsky. 2007. Comparative maps of motion and assembly of filamentous actin and myosin II in migrating cells. Mol. Biol. Cell. 18:3723–3732. [DOI] [PMC free article] [PubMed] [Google Scholar]
- 50.Pavlov, D., A. Muhlrad, J. Cooper, M. Wear, and E. Reisler. 2007. Actin filament severing by cofilin. J. Mol. Biol. 365:1350–1358. [DOI] [PMC free article] [PubMed] [Google Scholar]
- 51.Broschat, K. O. 1990. Tropomyosin prevents depolymerization of actin filaments from the pointed end. J. Biol. Chem. 265:21323–21329. [PubMed] [Google Scholar]
- 52.Nyákern-Meazza, M., K. Narayan, C. E. Schutt, and U. Lindberg. 2002. Tropomyosin and gelsolin cooperate in controlling the microfilament system. J. Biol. Chem. 277:28774–28779. [DOI] [PubMed] [Google Scholar]
- 53.Cooper, J. A. 2002. Actin dynamics: tropomyosin provides stability. Curr. Biol. 12:R523–R525. [DOI] [PubMed] [Google Scholar]
- 54.Blanchoin, L., and T. D. Pollard. 2002. Hydrolysis of ATP by polymerized actin depends on the bound divalent cation but not profilin. Biochemistry. 41:597–602. [DOI] [PubMed] [Google Scholar]
- 55.Ono, S., and K. Ono. 2002. Tropomyosin inhibits ADF/cofilin-dependent actin filament dynamics. J. Cell Biol. 156:1065–1076. [DOI] [PMC free article] [PubMed] [Google Scholar]
- 56.DesMarais, V., M. Ghosh, and J. Condeelis. 2005. Cofilin takes the lead. J. Cell Sci. 118:19–26. [DOI] [PubMed] [Google Scholar]
- 57.Pollard, T. D., and G. G. Borisy. 2003. Cell motility driven by assembly and disassembly of actin filaments. Cell. 112:453–465. [DOI] [PubMed] [Google Scholar]
- 58.Verkhovsky, A. B., T. M. Svitkina, and G. G. Borisy. 1999. Self-polarization and directional motility of cytoplasm. Curr. Biol. 9:11–20. [DOI] [PubMed] [Google Scholar]
- 59.Isambert, H., P. Venier, A. C. Maggs, A. Fattoum, R. Kassab, D. Pantaloni, and M.-F. Carlier. 1995. Flexibility of actin filaments derived from thermal fluctuations. J. Biol. Chem. 270:11437–11444. [DOI] [PubMed] [Google Scholar]
- 60.Brunner, C. A., A. Ehrlicher, B. Kohlstrunk, D. Knebel, J. A. Käs, and M. Goegler. 2006. Cell migration through small gaps. Eur. Biophys. J. 35:713–719. [DOI] [PubMed] [Google Scholar]
- 61.Danuser, G. 2005. Coupling the dynamics of two actin networks—new views on the mechanics of cell protrusion. Biochem. Soc. Trans. 33:1250–1253. [DOI] [PubMed] [Google Scholar]
- 62.Hillberg, L., L.-S. Zhao Rathje, M. Nyakern-Meazza, B. Helfand, R. D. Goldman, C. E. Schutt, and U. Lindberg. 2006. Tropomyosins are present in lamellipodia of motile cells. Eur. J. Cell Biol. 85:399–409. [DOI] [PubMed] [Google Scholar]
- 63.Blanchoin, L., K. J. Amann, H. N. Higgs, J.-B. Marchand, D. A. Kaiser, and T. D. Pollard. 2001. Inhibition of the Arp2/3 complex-nucleated actin polymerization and branch formation by tropomyosin. Curr. Biol. 11:1300–1304. [DOI] [PubMed] [Google Scholar]
- 64.Dawes, A. T., G. B. Ermentrout, E. N. Cytrynbaum, and L. Edelstein-Keshet. 2006. Actin filament branching and protrusion velocity in a simple 1D model of a motile cell. J. Theor. Biol. 242:265–279. [DOI] [PubMed] [Google Scholar]
- 65.Beltzner, C. C., and T. D. Pollard. 2008. Pathway of actin filament branch formation by Arp2/3 complex. J. Biol. Chem. 283:7135–7144. [DOI] [PubMed] [Google Scholar]
- 66.Prass, M., K. Jacobson, A. Mogilner, and M. Rademacher. 2006. Direct measurement of the lamellipodial protrusive force in a migrating cell. J. Cell Biol. 174:767–772. [DOI] [PMC free article] [PubMed] [Google Scholar]
- 67.Schafer, D. A., P. B. Jennings, and J. A. Cooper. 1996. Dynamics of capping protein and actin assembly in vitro: uncapping barbed ends by polyphosphoinositides. J. Cell Biol. 135:169–179. [DOI] [PMC free article] [PubMed] [Google Scholar]
- 68.Le Clainche, C., D. Pantaloni, and M.-F. Carlier. 2003. ATP hydrolysis on actin-related protein 2/3 complex causes debranching of dendritic actin arrays. Proc. Natl. Acad. Sci. USA. 100:6337–6343. [DOI] [PMC free article] [PubMed] [Google Scholar]
- 69.Blanchoin, L., and T. D. Pollard. 1999. Mechanism of interaction of Acanthamoeba actophorin (ADF/cofilin) with actin filaments. J. Biol. Chem. 274:15538–15546. [DOI] [PubMed] [Google Scholar]
- 70.Muhlrad, A., I. Rings, D. Pavlov, M. Peyser, and E. Reisler. 2006. Antagonistic effects of cofilin, beryllium fluoride complex, and phalloidin on subdomain 2 and nucleotide-binding cleft in F-actin. Biophys. J. 91:4490–4499. [DOI] [PMC free article] [PubMed] [Google Scholar]
- 71.Weigt, C., A. Wegner, and M. J. J. Koch. 1991. Rate and mechanism of the assembly of tropomyosin with actin filaments. Biochemistry. 30:10700–10707. [DOI] [PubMed] [Google Scholar]
- 72.Edelstein-Keshet, L., and G. B. Ermentrout. 2001. A model for actin-filament length distribution in a lamellipod. J. Math. Biol. 43:325–355. [DOI] [PubMed] [Google Scholar]
- 73.Carlsson, A. E. 2006. Simulation of actin polymerization by filament severing. Biophys. J. 90:413–422. [DOI] [PMC free article] [PubMed] [Google Scholar]
- 74.McGrath, J. L., Y. Tardy, C. F. J. Dewey, J. J. Meister, and J. H. Hartwig. 1998. Simultaneous measurements of actin filament turnover, filament fraction, and monomer diffusion in endothelial cells. Biophys. J. 75:2070–2078. [DOI] [PMC free article] [PubMed] [Google Scholar]
Associated Data
This section collects any data citations, data availability statements, or supplementary materials included in this article.