Abstract
Details of the reaction coordinate for DNA melting are fundamental to much of biology and biotechnology. Recently, it has been shown experimentally that there are at least three states involved. To clarify the reaction mechanism of the melting transition of DNA, we perform 100-ns molecular dynamics simulations of a homo-oligomeric, 12-basepair DNA duplex, d(A12)·d(T12), with explicit salt water at 400 K. Analysis of the trajectory reveals the various biochemically important processes that occur on different timescales. Peeling (including fraying from the ends), searching for Watson-Crick complements, and dissociation are recognizable processes. However, we find that basepair searching for Watson-Crick complements along a strand is not mechanistically tied to or directly accessible from the dissociation steps of strand melting. A three-step melting mechanism is proposed where the untwisting of the duplex is determined to be the major component of the reaction coordinate at the barrier. Though the observations are limited to the characteristics of the system being studied, they provide important insight into the mechanism of melting of other more biologically relevant forms of DNA, which will certainly differ in details from those here.
INTRODUCTION
Reaction paths for nucleic acid hybridization and its opposite, melting, have never been completely revealed in atomic detail experimentally. At room temperature, DNA exists in a mixed equilibrium of different native forms. The predominant form at ambient temperatures for complementary strands of sufficient length is the Watson and Crick (WC) double helix where two complementary strands interact with hydrogen bonds and the bases stack upon one and other. At elevated temperatures, a DNA duplex melts and the strands separate. DNA denaturation can also occur at physiological temperature. During replication, transcription, recombination, and DNA repair, a DNA duplex is locally unwound so that its genetic information becomes accessible (1). This is a critical step in all polymerase chain reactions as well. Though DNA denaturation is central to those processes, very little is known about its mechanism.
During hybridization, on forming a random collision complex in solution, complementary nucleic acid strands must search both orientation and sequence to form a stable duplex. A central question is whether DNA searching its own sequence requires remelting and if so, to what extent. In the case of a sequence that starts off poorly paired, to increase the efficiency of the process, DNA might come apart and recollide. The other possibility is to continue the one-dimensional search from the less than optimal starting complex. In melting, the reverse of these mechanisms opens other possibilities. With a temperature near or above the melting point, especially when there are tracks of a single nucleotide, the system might be able to “search” along the sequence to accomplish denaturation.
Experiments have begun to unravel aspects of the melting and/or folding process. A recent spectroscopic experiment (2) studying the folding of a DNA hairpin suggested the possibility of an intermediate state between the fully formed hairpin and the unfolded form. Another recent work confirmed the existence of a possible intermediate state (3) from the dynamics of melting of DNA hairpins using an ultrafast T-jump technique. This intermediate state is described as a nucleation state before the search of sequence to reach the native state. In this article, we report a series of simulation studies and analyses that geometrically and dynamically characterize the intermediate states and the equilibrium connectivity of the states. We find that not all of the states are accessible from each other and that pathways exist that determine the mechanism.
Previous computational studies have used lattice models (4–11) to investigate the statistical mechanics of hybridization and denaturation. Some newer models even include a coarse degree of freedom representing the twisting of basepairs to obtain some correspondence with the helical structure of DNA. Although informative, such models are still far from providing a realistic atomic picture of DNA. Lately, another coarse-grained model (12,13) of DNA was developed to facilitate mesoscale dynamics simulation of DNA melting. It represents each nucleotide by two sites, one for the base and one for the sugar and the phosphate backbone. That model is simple enough to allow long simulations to study DNA melting with low computational cost. It also coarsely models conformations of DNA strands during the melting transition, allowing the calculation of melting curves for oligonucleotides of various lengths. However, this model also lacks the atomistic details and driving forces from a realistic solution environment to form a complete picture of the denaturation transition.
Well-established, empirical thermodynamic models (14) are capable of statistically predicting melting. These thermodynamic models can handle various motifs, e.g., Watson-Crick basepairs, mismatches, and dangling ends. Coupling with the empirical equations, they can nearly quantitatively predict melting temperatures and other thermodynamic quantity changes such as in free energies, enthalpies, and entropies at different salt concentrations. Nevertheless, such methods yield no information about the structural or dynamic mechanism of how the DNA melts.
Given the significance of understanding DNA melting in biology and biotechnology, we conduct molecular dynamics simulations of DNA using an all-atom model in an explicit salt water environment to reveal the mechanism of DNA denaturation. We characterize the states of DNA during the melting transition by considering principal component projections of the trajectory. We find that not all the identified states during the process are directly accessible from each other. Particular pathways must therefore exist among the native form, the states that search for correct base pairing, and those that lead to melting.
METHODS
To simulate the melting of DNA in a computationally feasible time frame, we choose a simple homo-oligonucleotide d(A12).d(T12), which has an estimated melting temperature of 318 K in our simulated solution environment (14). Clearly the “ideal” nature of this system gives us a model view with less complication than a hetero sequence. Once the ideal case is characterized, we can easily enrich the picture by adding sequence complexity. Two simulations are performed to confirm the results. They are carried out at a temperature of 400 K to further speed up the melting of the DNA, analogous to a computational T-jump experiment.
The initial configuration of the DNA is created in canonical B-form with Nucleic Acid Builder (15). It is then placed inside a cubic simulation box of 8.4 nm, along with 17,886 TIP3P (16) water molecules, 59 sodium, and 37 chloride ions. This yields a solution of 2.8 mM DNA in 0.1 M sodium chloride, and overall charge neutral. Since the duplex is only 4.4 nm long and 2.1 nm wide, the simulation box has more than enough volume to accommodate the separation of strands when the DNA melts. Although oligo(dA)·oligo(dT) duplexes at room temperature are known to adopted conformations unlike canonical B-form (17), as will be shown later, conformations of the duplex in our simulations at 400 K change constantly and differ significantly from a regular duplex. Therefore, our results have little dependence on the choice of the initial duplex form.
Using the molecular dynamics program ESP (18) developed in our lab, we perform two simulations in the microcanonical (NVE) ensemble (19) with the CHARMM27 DNA force field (20,21) and periodic boundary conditions. The electrostatic interactions are treated with an Ewald sum (22) using a fast linked-cell (23,24) algorithm. The cutoff of the Lennard-Jones interactions and the real-space part of Ewald sum is 1.90 nm, the Ewald sum convergence factor is 1.65 nm−1, and the k-space cutoff is 10.4 nm−1. During the simulation, all bond lengths and water bond angles are constrained by the RATTLE algorithm (25). Equations of motion are then solved by the velocity Verlet (26) integrator with a time step of 2 fs.
The simulations begin with steepest descent minimization to eliminate overlapping among atoms. Subsequently, the system is equilibrated with the DNA fixed and the velocity of water and ions reassigned regularly at 400 K for 1 ns. Another 1 ns of equilibration is then performed with regular velocity reassignment but with the DNA free to move. The system is observed to remain at 401 ± 1 K and 20 ± 90 atm after equilibration. The two production runs are then performed for nearly 100 ns, and trajectory data is saved every 0.1 ps for analysis. The second trajectory to confirm the analysis from the first is generated with the same procedure but differs in the random velocity assignments.
Principal component analysis
Principal component analysis (PCA) is a standard statistical tool to decompose the motions of macromolecules in simulations (27–36). It defines a new coordinate system as linear transformations of atomic coordinates such that the new coordinates are orthogonal and along the quasi-harmonic mode directions. By keeping only a few of the new coordinates with the largest variances, or smallest frequencies, PCA reduces dimensionality of the trajectory while maintaining features of the largest scale dynamics in the system.
A molecular dynamics trajectory of M time snapshots of a molecule of N atoms has coordinates in the trajectory denoted by  where i = 1, …, 3N and t = 1, …, M. The atomic mass of atoms, mi, indexes the appropriate atom. We find the principle components by diagonalization of the 3N × 3N covariance matrix
 |
(1) |
from the coordinates where
 |
(2) |
is the coordinate of the mean conformation. Equivalently, we may perform a singular value decomposition on the mass weighted coordinate deviations,  To eliminate the contribution of translational and rotational motion in the covariance matrix, each snapshot is translated and rotated to best fit the mean conformation and minimize the mass weighted square deviation. Since each snapshot is fitted to the mean conformation, and the mean conformation is obtained by averaging all the snapshots, the processes of fitting and averaging need to be iterated to obtain the mean conformation self-consistently.
The eigenvalue, λi, (related to frequencies) and their corresponding eigenvectors vi, i = 1, …, 3N, are arranged in descending order of the eigenvalues. The principal component (PCs) can be conveniently projected back onto the Cartesian coordinates or any other basis set. By definition, they are all uncorrelated and their variances are given by the eigenvalues λi. The first few PCs with the largest eigenvalues depict the important slow and global motions of the macromolecule in the simulation that correspond to biological significant conformational changes.
To help interpret and visualize motions in different PCs, it is useful to construct reduced trajectories that represent motions of a few or even a single PC. For example, for the ith PC,
 |
(3) |
where yi(t) can be the actual values of the PC calculated from the simulation trajectory or any other convenient values.
RESULTS AND DISCUSSION
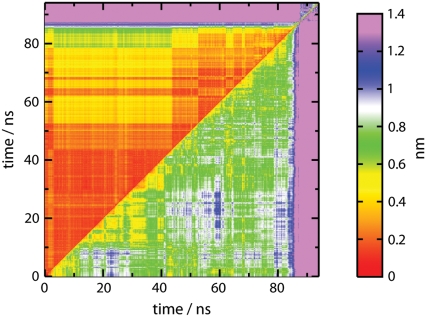
The physical description of a PC amounts to assignment of the mode of motion. Consequently, for complex systems undergoing a transition such as melting, we find that no single assignment remains significant globally for the entire duration. Thus, below we compare and contrast assigned motions in windows corresponding to periods and/or physical segments of DNA where the motions are of a similar character. We define characteristic periods where the root mean-square deviations (RMSDs) between any two configurations are similar. In Fig. 1, we display the RMSD between every pair of snapshots along the trajectory and show it as a two-dimensional map for the whole DNA in the lower triangular region and for the central six basepairs in the upper triangle.
FIGURE 1.
Time-ordered RMSD map (in nm) for the whole oligonucleotide (lower right region) and the middle six basepairs (upper left region).
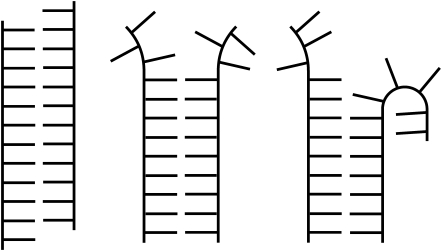
In the simulations, we observe several relevant motions and conformational states, which are illustrated in Fig. 2. By Watson-Crick-like, we mean that some or all nucleotides on the strands are canonically basepaired with the strands twisted with considerable stacking in place even where the basepairs may be absent. Fraying is the lack of WC structure at the ends of the duplex. Peeling refers to motions where untwisting is augmented by noncanonical H-bonds with the backbone of a strand. Searching is the incremental swapping of WC H-bonds resulting in the change in relative sequence registry of one strand with another.
FIGURE 2.
Schematic to show conformational states of searching (left), fraying (middle), and peeling (right). The twisting is omitted for clarity.
Soon after the rapid heating (computational T-jump), the conformation deviates significantly from the initial canonical B-form. Separate simulation at 300 K for nearly 50 ns confirms the room temperature stability near B-form. At 400 K the conformation of the oligonucleotide moves rapidly from its initial form and varies continually in the simulation. Along the lower diagonal of Fig. 1, the yellow regions between 10 and 40 ns correspond to a few metastable global conformations, but each conformation never lasts for more than a few nanoseconds. The motion between those structures corresponds to the frayed ends looping back to make transient H-bonds with the backbone coupled with some untwisting. These motions appear to peel the DNA strands apart. The low frequency of the loop motions is analogous to the observation that the lowest frequencies in globular proteins in solution also correspond to loop motions (37).
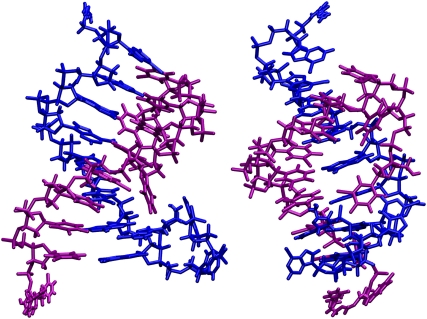
As an example, Fig. 3 shows the average conformation between 30 and 34 ns. The 5′-end of the T-strand loops back toward the middle of the duplex, and the DNA forms a noncanonical metastable structure which we designate as a peel state. Molecular dynamics simulations of oligonucleotide duplexes at room temperature routinely show fraying and reannealing of terminal basepairs, especially for A·T pairs (38,39). In our study, melting does not start in the middle or in a randomly distributed fashion but clearly begins at both ends. Significant fraying and peeling at this temperature is interdispersed with some reannealing of WC structure and subsequent base complementarity searching along the sequence. Obtaining complementarity in this case is of course trivial by design.
FIGURE 3.
Perpendicular views of the average conformation of DNA between 30 and 34 ns. The A-strand is blue and T-strand is purple. The 5′-end of the A-strand is near the bottom.
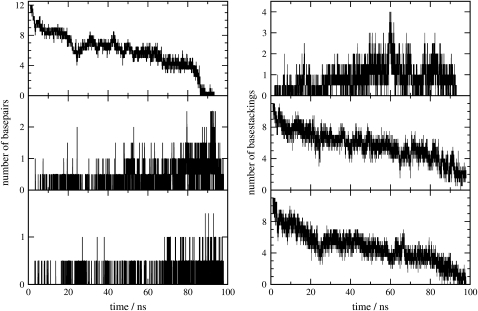
Basepairing and base stacking are the major driving forces in the formation of DNA helices. As a useful structural measure, we calculate the number of interstrand and intrastrand basepairs with the package 3DNA (40) for both trajectories and plot the averages as a function of time on the left-handed side of Fig. 4. Initially, the duplex has 12 basepairs. Within a few nanoseconds of the T-jump to 400 K, ∼⅓ of the basepairs begin to fray. The number of intact basepairs fluctuates with time. A small number of intrastrand basepairs also form, more on the A-strand. In the central part of the trajectory, the duplex is held together by an average of six basepairs. Near the melting point where >50% of bases are no longer paired, the number of intrastrand basepairs increases slightly. Within a few nanoseconds of that, the remaining interstrand basepairs break, one after another, and show very little tendency to reform. At this point, the duplex dissociates, and this sudden dynamic reflects the nature of the melting transition for this oligoduplex. The duplex is at most metastable at 400 K on the nanosecond timescale. Consequently, once a spontaneous fluctuation appears where too many basepairs are broken, the system moves to the thermodynamical state of lowest free energy where the strands separate.
FIGURE 4.
(Left) Average number of WC interstrand basepairs as a function of time (top) from the two trajectories. Number of intrastrand basepairs on the A-strand (middle) and T-strand (bottom). (Right) Average number of interstrand base stackings as a function of time (top) from the two trajectories. Number of intrastrand base stackings on the A-strand (middle) and T-strand (bottom).
For the stability of DNA helices, base stacking plays an important role as much as basepairing. Therefore, we also calculate the number of inter- and intrastrand base stacking and show them on the right-handed side of Fig. 4. Our calculation uses a geometrical criterion that two bases are stacked when the distance between the centers of the rings is <0.45 nm, and the angle between the normals to the bases is <30° or >150°. The figure shows that a small number of interstrand base stackings are formed, which probably stabilize the helix before it melts. The intrastrand base stacking also shows a trend similar to that of interstrand basepairing, which means melting not only disrupts the interstrand basepairing but also intrastrand base stacking in the duplex.
Since terminal basepairs fray and peel constantly, conformational changes of basepairs near the center of the oligomer become central to the reaction coordinate of the melting process. It is easy to see in the upper part of Fig. 1 that the middle part of the DNA shows considerably smaller fluctuations compared to the whole DNA. During the first ∼40 ns, the simulation has a central WC core. During the next 40 ns, the system intermittently substantially peels, searches, and subsequently reanneals to a new WC-like structure with overhanging ends.
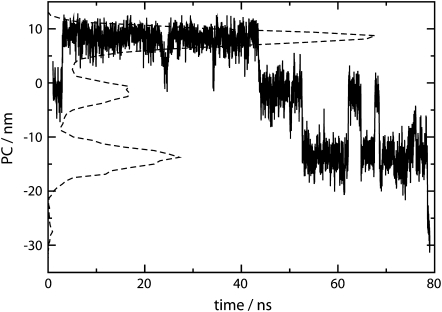
To better understand the conformational changes of the core, we perform PCA on the middle six basepairs using coordinates between 1 and 79 ns. The result shows that this lowest conditional PC describes conformational change among three states during searching. The other PCs have essentially unimodal probability distributions that do not correspond to any major conformational changes and are regarded as constraint-like motions. The first PC is shown in Fig. 5 as a function of time, along with its probability distribution. Inspection reveals that it corresponds to a shifting motion where the two strands search up or down in opposite directions followed by reannealing to a WC-like state.
FIGURE 5.
First PC of the middle six basepairs as a function of time between 1 and 79 ns (solid line) and its probability distribution (dashed line).
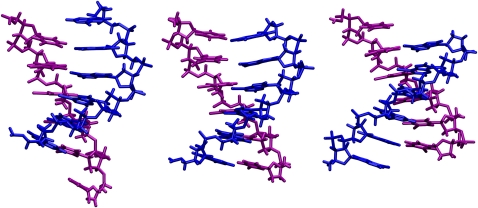
Fig. 6 shows the conformations of the central six basepairs corresponding to the most probable values of the lowest PC at negative, near zero, and positive collective coordinates. Positive values of the PC mean both strands shift toward their 5′-ends and create dangling bases at their 5′-ends whereas negative values mean shifting toward dangling bases at 3′-ends. This shifting motion involves successive breaking and forming of H-bonds in adjacent basepairs. Careful examination of the trajectory shows that the leading end of the basepairs moves forward, leaving unpaired base on the other strand before the tailing end follows and pairs with the open base. Obviously, the nature of this conditional PC partly reflects the homogeneity of the oligonucleotide sequence, and in addition, does not facilitate the melting process.
FIGURE 6.
Search coordinate: conformations of middle six basepairs at PC equals −14 (left), −2 (middle), and 9 (right). The A-strand is colored blue and T-strand is colored purple. The 5′-end of the A-strand is near the bottom.
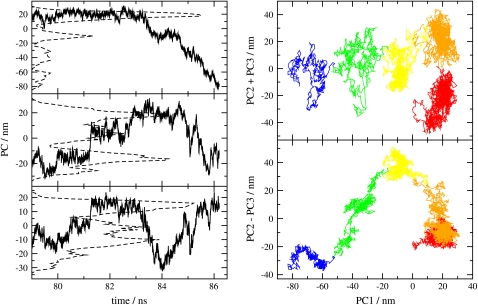
Major conformers observed before 79 ns correspond to WC states with possibly shifted H-bonds with minor conformers appearing as peeling states. The melting occurs after 86 ns. To focus on the final transition, we apply PCA to analyze the trajectory between 79 and 86 ns, using all the DNA atoms. To choose the important PCs to represent the essential motions in melting, we consider both their percentage contributions to the overall motion and the non-Gaussianity of their probability distributions. According to their eigenvalues, the first six PCs contribute 38, 13, 8.4, 6.5, 4.9, and 3.4%, respectively, and hence the first three PCs contribute nearly 60% to the overall motion. Also, except for the first three PCs, all other PCs have unimodal probability distributions, which correspond to nonessential, local motions. Therefore, we focus our analysis on the first three PCs (PC1, PC2, and PC3), and they are shown in Fig. 7 (left-hand side) as a function of time, along with their probability distributions. We see that PC1 stays nearly constant between 79 and 83 ns, but starts to decrease in a stepwise manner after 83 ns, whereas PC2 and PC3 show nonmonotonic trends. To show correlations among the three PCs, we plot both PC2 + PC3 and PC2 − PC3 versus PC1 on the right-hand side of Fig. 7. The sequence of conformations is colored like a rainbow to indicate time. The figure shows that the conformations form a few clusters, which correspond to metastable states adopted by the DNA during the melting transition, similar to the Frauenfelder substates seen in proteins previously (37).
FIGURE 7.
(Left) First three PCs (top, 1; middle, 2; bottom, 3) of the entire DNA duplex as a function of time in the final stages of melting, between 79 and 86.2 ns (solid line) and their probability distributions (dashed line). (Right) Plot of PC2 + PC3 and PC2 − PC3 as a function of PC1 for the same time period. The rainbow of colors (red to blue) indicates the order of time (79–86.2 ns).
Except for the first transition shown on the right-hand side of Fig. 7 from the first cluster (red) to the second (orange), PC1 always decreases in transitions from one cluster to the next, and thus we designate it as the predominant component of the reaction coordinate of DNA melting. Also, the escape from a cluster only occurs when PC2 + PC3 is toward its local maximum inside a cluster, and thus we designate that as marking the rate-determining step of the melting process. To interpret the motions associated with the PCs, reduced trajectory of each PC is generated separately according to Eq. 3. Visual examination of the three reduced trajectories shows that PC1 corresponds to the untwisting of the helix whereas PC2 and PC3 are the fraying and peeling of basepairs near the ends of the helix. Given this and analysis of the last transition in Figs. 5 and 6, we conclude that the untwisting of the helix is predominantly the reaction coordinate of DNA oligomer melting, and the rate is limited by the fraying or peeling of the basepairs near the ends. Clearly, solvent coordinates will be involved in a more complete analysis of the reaction coordinate. Also, the mechanism of melting of hetero-oligonucleotides and longer duplexes may be different from what we observed in our simulations. For polymeric DNA, the fraying that occurs at the ends is expected to play a smaller role than untwisting at the middle of the duplex in the formation of nucleation bubble, which is a mechanically (not thermally) induced process in vivo. Such mechanical untwisting leading to bubble formation in nonoligomeric DNA will be the subject of a separate study.
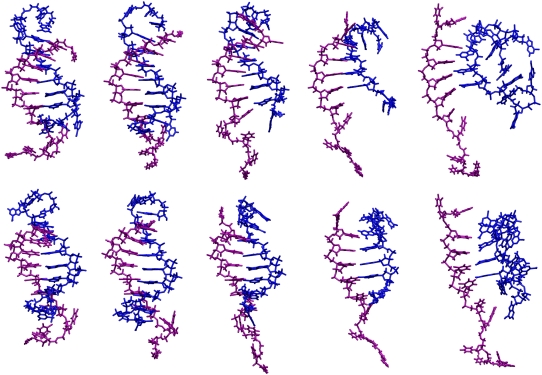
Fig. 8 shows conformations of the duplex near the centers of clusters displayed in Fig. 7. They correspond to metastable intermediates along the pathway of melting. Inspection of the conformations reveals that the structures are stabilized by some non-Watson-Crick motifs near the ends of the helix, e.g., interstrand base stacking and intrastrand base stacking among nonneighboring bases. As the DNA starts to melt, those non-Watson-Crick motifs proceed to break up, which allows the helical region to untwist. The DNA goes through the intermediate microstates (not necessarily thermodynamically stable) along the reaction pathway. In the last two frames of Fig. 8, the T-strand adopts an extended conformation while the A-strand curls up. In this conformation, only four basepairs remain and they resemble an untwisted ladder. As the melting completes, the strands separate, which causes the RMSD to increase significantly and effectively permanently. After the strands separate, they retain a certain degree of base-backbone interactions and base-base stacking. The simulation is subsequently terminated within 10 ns.
FIGURE 8.
Conformations of the DNA duplex during the melting transition at the centers of the substates shown in Fig. 7 from left to right in time order. The upper and lower rows correspond to two different views offset by 45°. The A-strand is colored blue and T-strand is colored purple. The 5′-end of the A-strand is near the bottom.
We also calculate traditional helical parameters of the basepairs and base steps of the four basepairs that remain at 86 ns. Results indicate that as the DNA goes through the intermediate states, the stagger and propeller-twist of basepairs and the shift and slide of base steps all increase whereas the twist of base steps decreases.
CONCLUSIONS
Our simulations offer an atomistic picture of how DNA oligomers melt in a realistic solution environment and provide insight into the mechanism and transition states. We find that melting of DNA is not a simple two-state process. Rather, it consists of a few concerted processes involving more than just the breaking of basepairs between strands. Before melting occurs, the oligonucleotide adopts various metastable conformations very different from the initial duplex form. This agrees with findings from a recent study (41). In addition, we find that when productive peeling and untwisting are not occurring, the DNA is able to search for various possible WC complements. This searching is stopped when the system forms nonnative stacking or peeling states.
We propose a mechanism of DNA melting including the possibility of searching for WC complements with the following scheme:
 |
We observe many basepairs break and reform. The strands also slide and search the local basepairing by alternately forming bifurcated and WC H-bonds. This observed searching or shifting motion is in agreement with the prediction of a recent theoretical model (42), and we believe it also plays an important role in the hybridizatiodn of DNA. In a pair of melting simulations differing only in initial velocities, we did not observe searching to be reachable from the peeling or denaturing states. Searching appears to require some proper WC geometry in the vicinity of the fraying region. Otherwise the searching is geometrically thwarted.
In melting, when stacking is intact with some single strand helix available in the search direction, the two strands will search along each other through the crawling, shifting motion along the basepairs. The search motion enables the two strands to reach a native duplex form where basepairs are perfectly matched. Certainly, for inhomogeneous sequences, because of the different sizes of purines and pyrimidines, the searching motion will involve some local backbone deformations and is expected to occur at timescales different than observed in our simulation for the homogeneous duplex. Also, our simulation shows that the search motion does not appear to be the transition state of the melting process. We find the melting of the DNA involves cooperative backbone deformation where the duplex untwists and peels apart. This motion occurs at a timescale much longer than that of breaking and reforming of basepairs.
Based upon the results, we find the untwisting of the duplex forms the transition state of the denature process. Further, the basepair searching for WC complements along a strand is not directly mechanistically tied to the peeling or dissociation of strands. Our proposed mechanism is in agreement with results from a recent experimental study (3) on the dynamics of melting of DNA hairpins but reveals a richer level of details. In the experiment, ultrafast T-jump techniques were used to perturb the system to nonequilibrium states and then the relaxation dynamics was monitored with two probing methods. Hypochromicity of bases was measured to study base destacking while fluorescence from a marker attached to one of the stem ends indicated the proximity of the two stem ends. Three processes were observed to occur at different time scales: The fastest process observed is the heating of water, which occurred at <20 ps. The slower one is assigned as the destacking of bases in a single strand (≈1 ns). The unfolding of the hairpin is the slowest process, which occurred on the millisecond timescale for the experimental conditions.
Differences between our oligoduplex and the hairpin studied in experiment do not allow a precise, direct comparison, but some characteristics may be related. In the case of the oligo, we only find destacking to commence near the ends and never from the center. The experiment indicates the existence of a compact intermediate state whose stem ends are close but the bases are only partially stacked. This is not contradicted by our findings. This intermediate state was described as a nucleation state before the search progress to reach the native state. An earlier experiment (2) studying the folding of DNA hairpin by multiparameter fluorescence fluctuation spectroscopy also suggested a three-state mechanism of folding.
These findings of a compact intermediate with disrupted basepairs for hairpin systems are consistent with what we observe in our simulation with some differences. Note that in free oligonucleotides as opposed to a hairpin system, the search and peel states are easily separated. We find that searching necessarily needs some preformed twist and stacking in place and is stopped by peeling. The nature of the intermediate state for a stem-loop hairpin no doubt has more constrained dynamics.
Our simulation and other recent studies have brought up the issue of solvent involvement in oligonucleotide melting. Among them, an all-atom molecular dynamics simulation studied the onset of the melting transition of an RNA duplex at 37°C, focusing on the dynamics of water and ions around the duplex (43). Results from the study indicate that the residence time of water molecules in the first coordinate shell is shorter at higher temperature, which agrees with experimental observations. This depicts a “premelting” of the solvent structures around the duplex before structural changes of the duplex itself. There is also suggestion that the rapid motion of water molecules is a “doorway-aiding process” for forming intermediate states in DNA denaturation (3). Thus the melting transition of DNA duplex is a cooperative process involving not only the duplex itself but also the solution environment surrounding it. Further investigations will be needed to reveal details of this complex coupling.
Understanding DNA melting is not only crucial in biology but also is important in the design of DNA microarrays and PCR-based biotechnologies. Recently, the rapid development of DNA microarray technology has found applications in numerous areas, e.g., gene expression profiling, drug design, and DNA-based computing. Hybridization and melting carried out on surfaces are different thermodynamically and kinetically from that in the bulk (44). Achieving the goal of control of surface properties to simultaneously optimize affinity and specificity is aided by knowing the mechanism of DNA melting and hybridization on the microarray surfaces. These will be addressed in our future works.
Acknowledgments
We gratefully acknowledge the National Institutes of Health, and the Robert A. Welch Foundation for the financial support. This research was performed in part using the Molecular Science Computing Facility in the William R. Wiley Environmental Molecular Sciences Laboratory, a national scientific user facility sponsored by the U.S. Department of Energy's Office of Biological and Environmental Research and located at the Pacific Northwest National Laboratory, operated for the Department of Energy by Battelle. Part of this work was also supported by the National Science Foundation through TeraGrid resources provided by San Diego Supercomputer Center and Pittsburgh Supercomputing Center. Some figures were prepared with VMD (45) and Tachyon.
Editor: Ron Elber.
References
- 1.Alberts, B. 2003. DNA replication and recombination. Nature. 421:431–435. [DOI] [PubMed] [Google Scholar]
- 2.Jung, J., and A. V. Orden. 2006. A three-state mechanism for DNA hairpin folding characterized by multiparameter fluorescence fluctuation spectroscopy. J. Am. Chem. Soc. 128:1240–1249. [DOI] [PubMed] [Google Scholar]
- 3.Ma, H., C. Wan, A. Wu, and A. H. Zewail. 2007. DNA folding and melting observed in real time redefine the energy landscape. Proc. Natl. Acad. Sci. USA. 104:712–716. [DOI] [PMC free article] [PubMed] [Google Scholar]
- 4.Peyrard, M., and A. R. Bishop. 1989. Statistical mechanics of a nonlinear model for DNA denaturation. Phys. Rev. Lett. 62:2755–2758. [DOI] [PubMed] [Google Scholar]
- 5.Dauxois, T., M. Peyrard, and A. R. Bishop. 1993. Entropy-driven DNA denaturation. Phys. Rev. E. 47:R44–R47. [DOI] [PubMed] [Google Scholar]
- 6.Zhang, Y.-L., W.-M. Zheng, J.-X. Liu, and Y. Z. Chen. 1997. Theory of DNA melting based on the Peyrard-Bishop model. Phys. Rev. E. 56:7100–7115. [Google Scholar]
- 7.Campa, A., and A. Giansanti. 1998. Experimental tests of the Peyrard-Bishop model applied to the melting of very short DNA chains. Phys. Rev. E Stat. 58:3585–3588. [Google Scholar]
- 8.Barbi, M., S. Cocco, and M. Peyrard. 1999. Helicoidal model for DNA opening. Phys. Lett. A. 253:358–369. [DOI] [PMC free article] [PubMed] [Google Scholar]
- 9.Barbi, M., S. Lepri, M. Peyrard, and N. Theodorakopoulos. 2003. Thermal denaturation of a helicoidal DNA model. Phys. Rev. E. 68:061909. [DOI] [PubMed] [Google Scholar]
- 10.Peyrard, M. 2004. Nonlinear dynamics and statistical physics of DNA. Nonlinearity. 17:R1–R40. [Google Scholar]
- 11.Calvo, G. F., and R. F. Alvarez-Estrada. 2005. Three-dimensional models for homogeneous DNA near denaturation. J. Phys. Condens. Matter. 17:7755–7781. [Google Scholar]
- 12.Drukker, K., and G. C. Schatz. 2000. A model for simulating dynamics of DNA denaturation. J. Phys. Chem. B. 104:6108–6111. [Google Scholar]
- 13.Drukker, K., G. Wu, and G. C. Schatz. 2001. Model simulations of DNA denaturation dynamics. J. Chem. Phys. 114:579–590. [Google Scholar]
- 14.SantaLucia, J., Jr., and D. Hicks. 2004. The thermodynamics of DNA structural motifs. Annu. Rev. Biophys. Biomol. Struct. 33:415–440. [DOI] [PubMed] [Google Scholar]
- 15.Macke, T. J., and D. A. Case. 1998. Modeling unusual nucleic acid structures. In Molecular Modeling of Nucleic Acids. N. B. Leontis and J. SantaLucia Jr., editors. American Chemical Society, Washington, DC. 379–393.
- 16.Jorgensen, W. L., J. Chandrasekhar, J. D. Madura, R. W. Impey, and M. L. Klein. 1983. Comparison of simple potential functions for simulating liquid water. J. Chem. Phys. 79:926–935. [Google Scholar]
- 17.Crothers, D. M., and Z. Shakked. 1999. DNA bending by adenine-thymine tracts. In Oxford Handbook of Nucleic Acid Structure. S. Neidle, editor. Oxford University Press, Oxford, UK. 455–470.
- 18.Smith, P. E., M. E. Holder, L. X. Dang, M. Feig, and B. M. Pettitt, 1996. ESP. University of Houston, Houston, TX.
- 19.Allen, M. P., and D. J. Tildesley. 1987. Computer Simulation of Liquids, 1st ed. Oxford University Press, New York.
- 20.Foloppe, N., and A. D. MacKerell Jr. 2000. All-atom empirical force field for nucleic acids: I. Parameter optimization based on small molecule and condensed phase macromolecular target data. J. Comput. Chem. 21:86–104. [Google Scholar]
- 21.MacKerell, A. D., Jr., and N. K. Banavali. 2000. All-atom empirical force field for nucleic acids: II. Application to molecular dynamics simulations of DNA and RNA in solution. J. Comput. Chem. 21:105–120. [Google Scholar]
- 22.de Leeuw, S. W., J. W. Perram, and E. R. Smith. 1980. Simulation of electrostatic systems in periodic boundary conditions. I. Lattice sums and dielectric constants. Proc. R. Soc. Lond. A. 373:27–56. [Google Scholar]
- 23.Fincham, D. 1994. Optimisation of the Ewald sum for large systems. Mol. Simul. 13:1–9. [Google Scholar]
- 24.Mattson, W., and B. M. Rice. 1999. Near-neighbor calculations using a modified cell-linked list method. Comput. Phys. Commun. 119:135–148. [Google Scholar]
- 25.Andersen, H. C. 1983. Rattle: a “velocity” version of the Shake algorithm for molecular dynamics calculations. J. Comput. Phys. 52:24–34. [Google Scholar]
- 26.Swope, W. C., H. C. Andersen, P. H. Berens, and K. R. Wilson. 1982. A computer simulation method for the calculation of equilibrium constants for the formation of physical clusters of molecules: application to small water clusters. J. Chem. Phys. 76:637–649. [Google Scholar]
- 27.Born, M., and K. Huang. 1954. Dynamical Theory of Crystal Lattices, 1st ed. Oxford University Press, New York.
- 28.Levy, R. M., M. Karplus, J. Kushick, and D. Perahia. 1984. Evaluation of the configurational entropy for proteins: application to molecular dynamics simulations of an α-helix. Macromolecules. 17:1370–1374. [Google Scholar]
- 29.Garćia, A. E. 1992. Large-amplitude nonlinear motions in proteins. Phys. Rev. Lett. 68:2696–2699. [DOI] [PubMed] [Google Scholar]
- 30.Amadei, A., A. B. M. Linssen, and H. J. C. Berendsen. 1993. Essential dynamics of proteins. Proteins Struct. Funct. Genet. 17:412–425. [DOI] [PubMed] [Google Scholar]
- 31.Hayward, S., A. Kitao, and N. Gāo. 1994. Harmonic and anharmonic aspects in the dynamics of BPTI: A normal mode analysis and principal component analysis. Protein Sci. 3:936–943. [DOI] [PMC free article] [PubMed] [Google Scholar]
- 32.Kitao, A., and N. Gāo. 1999. Investigating protein dynamics in collective coordinate space. Curr. Opin. Struct. Biol. 9:164–169. [DOI] [PubMed] [Google Scholar]
- 33.van Aalten, D. M. F., B. L. de Groot, J. B. C. Findlay, H. J. C. Berendsen, and A. Amadei. 1997. A comparison of techniques for calculating protein essential dynamics. J. Comput. Chem. 18:169–181. [Google Scholar]
- 34.Tournier, A. L., and J. C. Smith. 2003. Principal components of the protein dynamical transition. Phys. Rev. Lett. 91:208106. [DOI] [PubMed] [Google Scholar]
- 35.Pérez, A., J. R. Blas, M. Rueda, J. M. López-Bes, X. de la Cruz, and M. Orozco. 2005. Exploring the essential dynamics of B-DNA. J. Chem. Theory Comput. 1:790–800. [DOI] [PubMed] [Google Scholar]
- 36.Maisuradze, G. G., and D. M. Leitner. 2006. Principal component analysis of fast-folding λ-repressor mutants. Chem. Phys. Lett. 421:5–10. [Google Scholar]
- 37.Andrews, B. K., T. Romo, J. B. Clarage, B. M. Pettitt, and G. N. Phillips. 1998. Characterizing global substates of myoglobin. Structure. 6:587–594. [DOI] [PubMed] [Google Scholar]
- 38.Young, M. A., G. Ravishanker, and D. L. Beveridge. 1997. A 5-nanosecond molecular dynamics trajectory for B-DNA: analysis of structure, motions, and solvation. Biophys. J. 73:2313–2336. [DOI] [PMC free article] [PubMed] [Google Scholar]
- 39.Feig, M., and B. M. Pettitt. 1998. Structural equilibrium of DNA represented with different force fields. Biophys. J. 75:134–149. [DOI] [PMC free article] [PubMed] [Google Scholar]
- 40.Lu, X.-J., and W. K. Olson. 2003. 3DNA: a software package for the analysis, rebuilding and visualization of three-dimensional nucleic acid structures. Nucleic Acids Res. 31:5108–5121. [DOI] [PMC free article] [PubMed] [Google Scholar]
- 41.Tikhomirova, A., I. V. Beletskaya, and T. V. Chalikian. 2006. Stability of DNA duplexes containing GG, CC, AA, and TT mismatches. Biochemistry. 45:10563–10571. [DOI] [PubMed] [Google Scholar]
- 42.Neher, R. A., and U. Gerland. 2006. Intermediate phase in DNA melting. Phys. Rev. E. 73:030902. [DOI] [PubMed] [Google Scholar]
- 43.Auffinger, P., and E. Westhof. 2002. Melting of the solvent structure around a RNA duplex: a molecular dynamics simulation study. Biophys. Chem. 95:203–210. [DOI] [PubMed] [Google Scholar]
- 44.Vainrub, A., T. B. Li, Y. Fofanov, and B. M. Pettitt. 2003. Theoretical Considerations for the Efficient Design of DNA Arrays. In Biomedical Technology and Devices Handbook. J. E. Moore Jr. and G. Zouridakis, editors. CRC Press, Boca Raton, FL. 1–12.
- 45.Humphrey, W., A. Dalke, and K. Schulten. 1996. VMD—Visual Molecular Dynamics. J. Mol. Graph. 14:33–38. [DOI] [PubMed] [Google Scholar]


