Abstract
The decay kinetics of the aminoethanol-generated CoII-substrate radical pair catalytic intermediate in ethanolamine ammonia-lyase from Salmonella typhimurium have been measured on timescales of <105 s in frozen aqueous solution from 190 to 217 K. X-band continuous-wave electron paramagnetic resonance (EPR) spectroscopy of the disordered samples has been used to continuously monitor the full radical pair EPR spectrum during progress of the decay after temperature step reaction initiation. The decay to a diamagnetic state is complete and no paramagnetic intermediate states are detected. The decay exhibits three kinetic regimes in the measured temperature range, as follows. i), Low temperature range, 190 ≤ T ≤ 207 K: the decay is biexponential with constant fast (0.57 ± 0.04) and slow (0.43 ± 0.04) phase amplitudes. ii), Transition temperature range, 207 < T < 214 K: the amplitude of the slow phase decreases to zero with a compensatory rise in the fast phase amplitude, with increasing temperature. iii), High temperature range, T ≥ 214 K: the decay is monoexponential. The observed first-order rate constants for the monoexponential (kobs,m) and the fast phase of the biexponential decay (kobs,f) adhere to the same linear relation on an lnk versus T−1 (Arrhenius) plot. Thus, kobs,m and kobs,f correspond to the same apparent Arrhenius prefactor and activation energy (logAapp,f (s−1) = 13.0, Ea,app,f = 15.0 kcal/mol), and therefore, a common decay mechanism. We propose that kobs,m and kobs,f represent the native, forward reaction of the substrate through the radical rearrangement step. The slow phase rate constant (kobs,s) for 190 ≤ T ≤ 207 K obeys a different linear Arrhenius relation (logAapp,s (s−1) = 13.9, Ea,app,s = 16.6 kcal/mol). In the transition temperature range, kobs,s displays a super-Arrhenius increase with increasing temperature. The change in Ea,app,s with temperature and the narrow range over which it occurs suggest an origin in a liquid/glass or dynamical transition. A discontinuity in the activation barrier for the chemical reaction is not expected in the transition temperature range. Therefore, the transition arises from a change in the properties of the protein. We propose that a protein dynamical contribution to the reaction, which is present above the transition temperature, is lost below the transition temperature, owing to an increase in the activation energy barrier for protein motions that are coupled to the reaction. For both the fast and slow phases of the low temperature decay, the dynamical transition in protein motions that are obligatorily coupled to the reaction of the CoII-substrate radical pair lies below 190 K.
INTRODUCTION
The molecular mechanisms of the core steps in enzyme catalysis are often veiled by the kinetic complexity and asynchrony of steady-state turnover. Three methods, which involve formation and spectroscopic monitoring of reaction intermediates in solid state samples at cryogenic temperatures, have been developed to study single, or short sequences of, reaction steps in metalloproteins. The first method is the low temperature photodissociation of metal-ligand complexes, for which the archetype is the optically monitored carbon monoxide or dioxygen migration and rebinding to the heme iron in myoglobin (Mb) after photolysis of the carboxy- or oxy-heme state in frozen solutions at temperatures from 10 to 270 K (1,2). This method has been further developed with Mb (3–6), and has been applied to other heme proteins (7–9) and metalloproteins (10,11). The second method is cryoreduction, in which γ-irradiation of a frozen solution sample at 77 K is used to elicit one-electron reduction of a previously redox-poised metal center in the protein (12,13). Graded annealing of the kinetically trapped state is subsequently performed to relax the nonequilibrium, reduced metal center structure, and to thermally activate and step through a portion of the electron transfer or reaction sequence. This protocol has been applied to heme (12–20) and nonheme (21–25) iron proteins. In the third method, which does not involve irradiation, a kinetically unstable enzyme state is prepared and cryotrapped, and then promoted to relax and react by stepwise cycling between the trapping and annealing temperature (26). Here, we report an experiment of the third type, which is distinguished by continuous, full-spectrum electron paramagnetic resonance (EPR) spectroscopic monitoring during the relaxation of the CoII-substrate radical pair intermediate, at the annealing temperature, in coenzyme B12 (adenosylcobalamin)-dependent ethanolamine ammonia-lyase (EAL; EC 4.3.1.7; cobalamin (vitamin B12)-dependent enzyme superfamily (27,28)) from Salmonella typhimurium (29–31). The experiment is aimed at characterizing the molecular mechanistic features of the core reactions of EAL catalysis, and in particular, to distinguish chemical and protein dynamical components of the reaction.
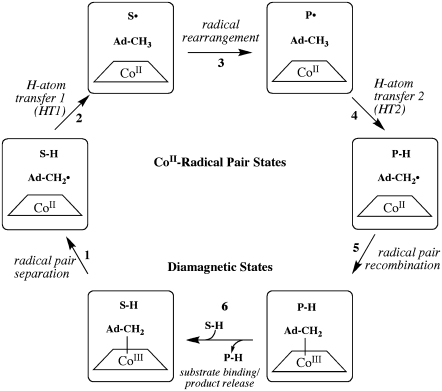
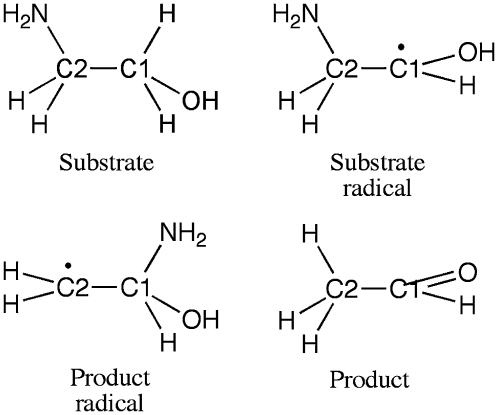
The CoII-substrate radical pair accumulates as the only detectable paramagnetic intermediate during steady-state turnover of aminoethanol by EAL (32), and this state can be cryotrapped (33,34). As shown by the minimal mechanism for the catalytic cycle in Fig. 1 (29,30), the process of CoII-substrate radical pair formation begins with binding of aminoethanol (Scheme 1), which triggers the homolytic cleavage of the cobalt-carbon bond in coenzyme B12, yielding low spin, S = 1/2 CoII in cobalamin and the proposed S = 1/2 5′-deoxyadenosyl radical. The C5′ radical center of the 5′-deoxyadenosyl abstracts a hydrogen atom from the C1 carbon of the substrate (first hydrogen atom transfer, HT1), which forms 5′-deoxyadenosine and the substrate radical (Scheme 1) (35–37). The substrate radical rearranges to a product radical (Scheme 1) in a detectably irreversible step (38,39). The accumulation of the CoII-substrate radical pair during steady-state turnover on aminoethanol indicates that the radical rearrangement step is at least partially rate-limiting. This has also been shown by substrate 14N/15N kinetic isotope effects (40). The product radical reacts by abstracting a hydrogen atom from the C5′-methyl group of 5′-deoxyadenosine (step HT2), which produces a diamagnetic product species and reforms the 5′-deoxyadenosyl radical. After the HT2 step, the 5′-deoxyadenosyl radical recombines with CoII to regenerate the intact coenzyme (41), and products acetaldehyde (Scheme 1) and ammonia are released (42).
FIGURE 1.
Minimal mechanism of catalysis for coenzyme B12-dependent EAL (29,30). The forward direction of reaction is indicated by arrows. The steps are: (1) radical pair separation, (2) first hydrogen atom transfer (HT1), (3) radical rearrangement, (4) second hydrogen atom transfer (HT2), (5) radical pair recombination, and (6) product release/substrate binding. Substrate-derived species are designated S-H (bound substrate), S· (substrate radical), P· (product radical), and PH (diamagnetic products). The 5′-deoxyadenosyl β-axial ligand is represented as Ad-CH2 in the intact coenzyme, and as  (5′-deoxyadenosyl radical) or Ad-CH3 (5′-deoxyadenosine) after cobalt-carbon bond cleavage. The cobalt ion and its formal oxidation states are depicted, but the corrin ring and the dimethylbenzimidazole α-axial ligand of the coenzyme (68,69) are not shown for clarity.
SCHEME 1.
In this report, we show that the cryotrapped aminoethanol-derived CoII-substrate radical pair catalytic intermediate in EAL decays to an EPR-silent state upon annealing at T ≥ 190 K. We have time-resolved the decay after a temperature-step (T-step) from a sample holding temperature of 160 or 180 K. The timescale of the decay in the examined temperature range of 190–217 K (t1/2 = 4 × 10⁵–1 × 10³ s, respectively) is slow relative to the instrument dead time (3.0–6.0 × 101 s), and the spectrum acquisition period (1.0–2.0 × 101 s). The continuous acquisition of EPR spectra during progress of the decay provides the opportunity for the detection and spectroscopic identification of transient paramagnetic intermediates that cannot be addressed at room temperature. The frozen, solid state of the bulk aqueous solvent in the samples restricts product release and substrate binding. Therefore, the decay of the CoII-substrate radical pair state is synchronously initiated by the T-step, and the reaction is terminated at the diamagnetic adenosylcobalamin/bound products state. The decay displays monoexponential kinetics from T = 214–217 K, but partitions into two distinct monoexponential phases, with decrease in temperature, over the narrow range of 207 < T < 214 K. The low temperature experiment isolates internal reaction steps for kinetic study and provides a foundation for distinguishing chemical and protein dynamical contributions to enzyme catalysis in EAL.
MATERIALS AND METHODS
Enzyme preparation
Enzyme was purified from the Escherichia coli overexpression strain incorporating the cloned S. typhimurium EAL coding sequence (43) essentially as described (44), with the exception that the enzyme was dialyzed against buffer containing 100 mM HEPES (pH 7.5), 10 mM potassium chloride, 5 mM dithiothreitol, and 10% glycerol (45). Enzyme activity was determined as described (46) by using the coupled assay with alcohol dehydrogenase/NADH. The specific activity of the purified enzyme with aminoethanol as substrate was 20–30 μmol/min/mg.
Sample preparation
Adenosylcobalamin (Sigma Chemical, St. Louis, MO), 1-13C-aminoethanol and 1,1,2,2-2H4 aminoethanol (Cambridge Isotope Laboratories, Andover, MA), and natural abundance aminoethanol (Aldrich Chemical, St. Louis, MO) were purchased from commercial sources. The reactions were performed in air-saturated or anaerobic buffer containing 10 mM potassium phosphate (pH 7.5). The anaerobic samples were prepared by using the freeze-pump-thaw procedure, with argon gas backfill. All manipulations were carried out on ice under dim red safe-lighting. The final concentration of enzyme was 10–15 mg/ml, which is equivalent to 20–30 μM for a holoenzyme molecular mass of 500,000 g/mol (44), and an active site concentration of 120–180 μM, based on an active site/holoenzyme stoichiometry of 6:1 (47,48) (K. Warncke, unpublished). Adenosylcobalamin was added to 240–360 μM (twofold excess over active sites).
The CoII-substrate radical pair samples were prepared by using a procedure for fast cryotrapping of steady-state intermediate states in EAL (33). Briefly, after manual mixing of the enzyme-adenosylcobalamin solution with substrate, the sample was loaded into a 4 mm outer diameter. EPR tube, and the tube was plunged into liquid nitrogen-chilled isopentane (T = 150 K) to trap the CoII-substrate radical pair state. The total elapsed time from mixing to isopentane immersion was 15 s.
Continuous-wave EPR spectroscopy
EPR spectra were obtained by using a Bruker (Billerica, MA) E500 ElexSys EPR spectrometer equipped with a Bruker ER4123 SHQE cavity. Temperature was controlled with a Bruker ER4131VT liquid nitrogen/gas flow cryostat system, with ER4121VT-1011 evaporator/transfer line, ER4121VT-1013 heater/thermocouple, and 26 liter liquid nitrogen reservoir. For the decay experiments, this temperature control system allowed rapid temperature step changes, relative to the more slowly responding Oxford (Abingdon, UK) ESR900 cryostat, and run times of up to 2–3 × 10⁴ s, depending upon flow rate. Measurements were performed under dim light and with the EPR tubes inserted into the EPR resonator, which shielded the samples from direct exposure to light. Under these conditions with frozen samples, sample degradation owing to coenzyme photolysis is negligible.
Time-resolved EPR measurements
EPR samples were held at a staging temperature of 160 K or 180 K in the ER4131VT cryostat system in the Bruker E560 spectrometer, and the microwave bridge was tuned. T-steps from 160 K or 180 K to the decay measurement temperatures of 190, 193, 197, 200, 203, 207, 210, 214, or 217 K were initiated by changing the E4131VT temperature set point. Once the sample temperature stabilized at the set point, the preset auto-tune/auto-scan mode of the spectrometer was triggered, and the sample was auto-tuned at the high temperature set point, followed immediately by continuous spectrum acquisition. The time from initiation of the temperature step to the start of acquisition of the first spectrum was 3.0–6.0 × 101 s. The zero time of the decay was marked at the first collected EPR spectrum. The EPR spectra were acquired with a 24 s sweep time (2.56 ms time constant). The reported temperatures represent the temperature at the sample, which was determined before each decay run by using an Oxford Instruments ITC503 temperature controller with a calibrated model 19180 four-wire resistance temperature detector probe, which has ±0.3 K accuracy over the decay measurement temperature range. For measurements over the temperature range 190–207 K, the ER4131VT cryostat/controller system provided a temperature stability of ±0.5 K over the length of the EPR sample cavity, as measured by using a thermocouple probe that was translated along the EPR tube axis to achieve different heights within a solution sample. The temperature was therefore stable to ±0.5 K during each run. For measurements at 210, 214, and 217 K, the ER4121VT-1011 evaporator/transfer line and ER4121VT-1013 heater/thermocouple were replaced with the standard ER4131VT components, which increased the flow rate of the gas. This led to a more rapid change in temperature during the temperature step, and a desired diminished instrument dead time. Under the faster gas flow in the ER4131VT system, the temperature stability was approximately ±0.7 K over the length of the EPR sample cavity
Kinetic analysis
EPR spectra acquired continuously during the decay were used directly in the kinetic analysis, or were averaged in blocks of from 2 to 20 spectra to increase the signal/noise ratio (SNR), and the acquisition time was calculated as the average time for the block. For each EPR spectrum, the amplitude of CoII was obtained from the difference between the baseline and the peak feature at g ≈ 2.3, and the substrate radical amplitude was obtained from the difference between peak and trough amplitudes of the derivative feature around g ≈ 2.0. All data processing programs were written in MATLAB (The Mathworks, Natick, MA). The observed decays were fitted to monoexponential (Eq. 1, N = 1) and biexponential (Eq. 1, N = 2) functions by using the expression
 |
(1) |
where  is the normalized total amplitude, Ai is the normalized component amplitude (
 at t = 0), and ki is the first-order rate constant. The data were also fitted to the power law function, where t0 and n are adjustable parameters, as given by the expression
 |
(2) |
The power law function represents a distribution of monoexponential decay rates (2). The fitting of the kinetics was performed by using Origin (OriginLab, Natick, MA).
Temperature-dependence of the first-order rate constant
The temperature dependence of the first-order rate constant, k, is given by the Arrhenius expression (49)
 |
(3) |
where Ea is the activation energy, R is the gas constant, and A is a prefactor that represents the value of k as Ea→0. In a plot of lnk versus T−1 (Arrhenius plot), the intercept of the linear relation is given by lnA and the slope is given by −Ea/R.
RESULTS
CoII-substrate radical pair EPR spectrum
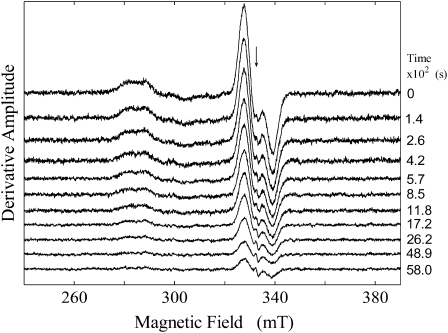
Fig. 2 shows EPR spectra of the aminoethanol-derived CoII-substrate radical pair. The EPR spectrum of the CoII-substrate radical pair after cryotrapping and before annealing is presented in Fig. S1 of the Supplementary Material (Data S1). The CoII intensity is most prominent in the region around 285 mT, which is near to the g⊥ = 2.26 value in the EPR spectrum of isolated cob(II)alamin (50). The CoII transitions extend to the high field edge of the g‖ region at 360 mT. The CoII features in the radical pair spectrum are broadened, relative to isolated cob(II)alamin, by the interaction with the unpaired electron localized on C1 of the substrate radical (51). The substrate radical line shape extends from ∼325 to 345 mT. The unresolved doublet splitting and inhomogeneous line broadening are caused by the interaction with the unpaired electron spin on CoII (33,51). EPR simulations are able to account for all features in the CoII-substrate radical pair spectrum (52,53).
FIGURE 2.
Dependence of the EPR spectrum of the CoII-substrate radical pair state in EAL on time after temperature step to T = 207 K. The free electron resonance position at g = 2.0 is shown by the arrow. Experimental conditions: microwave frequency, 9.3434 GHz; temperature, 207 K; microwave power, 20.25 mW; magnetic field modulation, 1.0 mT; modulation frequency, 100 kHz; scan rate, 6.52 mT/s; and time constant, 2.56 ms.
Time-resolved measurements of EPR spectra during CoII-substrate radical pair decay
EPR spectra were acquired as the decay of the CoII-substrate radical pair progressed at temperatures of 190, 193, 197, 200, 203, 207, 210, 214, and 217 K. Fig. 2 shows a stack plot of a selection of 11 of the 300 total EPR spectra that were collected during the course of a representative decay at 207 K. The CoII and substrate radical EPR signals decay in synchrony (Fig. S2, Data S1). No EPR signals from paramagnetic species other than the CoII-substrate radical pair were detected above the noise level, with the exception of a narrow free radical signal at g = 2.0. As reported previously (33), this signal, which corresponds to <1% of the initial CoII-substrate radical pair amplitude, arises from an organic radical that is formed during the initial sample mixing and cryotrapping procedure. The amplitude of this spurious signal is independent of decay time, and we do not consider it further.
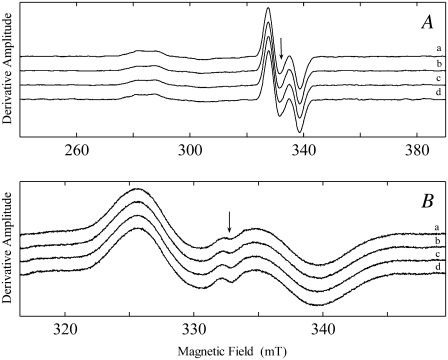
Fig. 3 displays EPR spectra that were acquired in an attempt to observe CoII-radical pair states, other than the CoII-substrate radical pair. Fig. 3 A shows normalized EPR spectra acquired at different stages of the CoII-substrate radical pair decay at 197 K. The SNR in these decay spectra was improved by using 1,1,2,2-2H4-aminoethanol as substrate, which increases the EPR amplitude by threefold relative to natural abundance aminoethanol (33), and by averaging subsets of spectra that correspond to normalized amplitude ranges of 99–90%, 79–70%, and 59–50%. The EPR spectrum of the preannealed sample, collected at 160 K, is also shown in Fig. 3 A. The averaged decay spectra are identical to within the noise level, and do not differ significantly from the line shape of the preannealed sample. The SNR relative to the peak-to-trough amplitude of the substrate radical is 2.4–3.0 × 10² for the averaged decay spectra and 3.0 × 10² for the preannealed spectrum. Therefore, no CoII-radical pair species, other than the CoII-substrate radical pair, are detected during the decay at SNR ≈ 102, relative to the peak-to-trough amplitude of the substrate radical.
FIGURE 3.
Comparison of the EPR spectra of the CoII-substrate radical pair state before annealing and at different levels of decay, for decay performed at T = 197 K. (A) CoII-substrate radical pair state generated by using 1,1,2,2-2H4-aminoethanol as substrate. (a) Preannealling spectrum, obtained at 160 K. (b) Average of spectra corresponding to amplitudes of 99–90% of initial amplitude. (c) Average of spectra corresponding to amplitudes of 79–70% of initial amplitude. (d) Average of spectra corresponding to amplitudes of 59–50% of initial amplitude. (B) CoII-substrate radical pair state generated by using 1-13C-aminoethanol as substrate. (a) Preannealling spectrum, obtained at 160 K. (b) Average of spectra corresponding to amplitudes of 99–90% of initial amplitude. (c) Average of spectra corresponding to amplitudes of 79–70% of initial amplitude. (d) Average of spectra corresponding to amplitudes of 59–50% of initial amplitude. Experimental conditions: (A) Microwave frequency, 9.3390 GHz; microwave power, 20.25 mW; magnetic field modulation, 1.0 mT; modulation frequency, 100 kHz; scan rate, 6.52 mT/s; and time constant, 2.56 ms. (B) Microwave frequency, 9.3390 GHz; microwave power, 20.25 mW; magnetic field modulation, 1.0 mT; modulation frequency, 100 kHz; scan rate, 6.52 mT/s; and time constant, 2.56 ms.
Fig. 3 B shows results from the same protocol that was used in Fig. 3 A, with the exception that 1-13C-aminoethanol was used as the substrate. Again, the averaged decay spectra are identical to within the noise level, and do not differ significantly from the line shape of the preannealed sample. The 1-13C-label at the C1 radical center increases the substrate radical linewidth by 2.4 mT relative to the natural isotopic abundance radical, owing to the hyperfine interaction of the electron spin with the I = 1/2 13C nucleus (33). If the C2-centered product radical was formed in significant concentration, a narrow line shape would be expected to be superimposed on the substrate radical spectrum. No heterogeneity is observed in the line shapes in Fig. 3 B. Therefore, the product radical is not formed in significant concentration during decay of the CoII-substrate radical pair. The absence of detectable paramagnetic species, other than the CoII-substrate radical pair, is consistent with the calculated 5–9 kcal/mol higher free energy of the product radical relative to the substrate radical (54–56), and with the experimentally determined limit on the free energy of the CoII-5′-deoxyadenosyl radical pair of >3.0 kcal/mol relative to the CoII-substrate radical pair state (57).
Attempt to detect aquocobalamin formed during low temperature CoII-substrate radical pair decay
Single electron transfer-mediated decay of CoII-radical pair intermediates to diamagnetic states in the coenzyme B12-dependent enzymes, lysine 5,6-aminomutase (58), diol dehydratase (59), glutamate mutase (60), and methylmalonyl-CoA mutase (61) has been reported. These single electron transfer reactions occur as a natural consequence of catalysis (58), or because the native course of reaction is altered by mechanism-based inhibitors (59,60) or site-directed mutations in the protein (61). Characteristic features of the electron transfer mechanisms are a monoexponential decay, and formation of the stable, inhibitory enzyme-bound aquocobalamin form of the cofactor. The characteristic ultraviolet absorption band of aquocobalamin (difference extinction coefficient for aquocobalamin minus adenosylcobalamin at λmax = 350 nm, Δɛ350 = 20 mM−1 cm−1 (62)) is not detected in the CoII-substrate radical pair samples after the annealing procedure. The monoexponential function also does not fit the decay data for 197–210 K (Fig. S3, Data S1). These results show that the CoII-substrate radical pair recombination reaction is not mediated by a single electron transfer mechanism.
Time and temperature dependence of the substrate radical decay
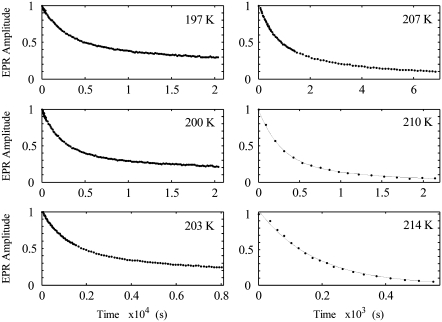
Fig. 4 shows representative decays of the substrate radical EPR signal as a function of time at temperatures of 197, 200, 203, 207, 210, and 214 K. At the higher temperatures of 207, 210 K, and 214 K, the substrate radical signal is observed to decay fully to zero, to within the noise level. At temperatures below 207 K, the long timescale of the decay, and measuring time limit of 6–8 h, imposed by the cryostat system, preclude recording the decay to the zero level. The kinetic fitting results, described below, are also consistent with the complete decay at all temperatures. The complete decay of the substrate radical EPR amplitude indicates that at least one step in the recombination process can be considered as irreversible.
FIGURE 4.
Decay of the substrate radical as a function of time at different temperatures from 197 to 214 K, and overlaid best-fit biexponential functions. The EPR experimental conditions are as described in the legend to Fig. 3. The overlaid solid curves correspond to simulations of the decay with a biexponential function (197–210 K) or monoexponential function (214 K). The simulation parameters are presented in Table 1.
The theoretical curves for 197, 200, 203, 207, and 210 K in Fig. 4 represent fits of the data to a biexponential function (Eq. 1, N = 2). The biexponential function provides an excellent fit to the decay at all of the temperatures examined from 190 to 210 K. In contrast, the monoexponential decay function (Eq. 1, N = 1) provides an unsatisfactory fit to the data obtained at temperatures from 190 to 210 K (Fig. S3, Data S1). The data were also fitted by using the power law function (Eq. 2), which represents a distribution of monoexponential decay rates (2). The heme-carbon monoxide recombination kinetics in Mb at T < 200 K have previously been fitted by using the power law function (2). Overall, the power law function gave reasonable fits to the data, but with statistical criteria that were inferior to the biexponential function (Fig. S4, Data S1). Two-temperature annealing experiments, described below, provide evidence against the power law model. The rate constants (kobs,f and kobs,s) and normalized amplitude coefficients for the fast and slow phases (Aobs,f and Aobs,s) of the biexponential fitting functions for each temperature are presented in Table 1. The table shows that the rate constants increase with increasing temperature, and that the normalized amplitudes of the fast and slow phases are constant, with average values of 0.57 ± 0.04 and 0.43 ± 0.04, respectively, from 190 to 207 K.
TABLE 1.
First-order rate constant and amplitude parameters for the fit of the biexponential function to the CoII-substrate radical pair decay kinetics at different temperatures
| T (K) | kobs,f (s−1) |
 * *
|
kobs,s (s−1) |
 † †
|
R2‡ |
|---|---|---|---|---|---|
| 190 | 6.7 × 10⁻⁵ | 0.60 | 5.3 × 10⁻⁶ | 0.40 | 0.9994 |
| 193 | 1.2 × 10⁻⁴ | 0.54 | 1.3 × 10⁻⁵ | 0.46 | 0.9996 |
| 197 | 3.8(±0.1) × 10−4 | 0.56 ± 0.03 | 2.4(±0.2) × 10−5 | 0.44 ± 0.03 | 0.9996 |
| 200 | 5.3(±0.6) × 10−4 | 0.55 ± 0.05 | 4.1(±0.9) × 10−5 | 0.45 ± 0.05 | 0.9996 |
| 203 | 8.4(±0.6) × 10−4 | 0.58 ± 0.02 | 8.0(±0.5) × 10−5 | 0.42 ± 0.02 | 0.9997 |
| 207 | 1.5(±0.1) × 10−3 | 0.61 ± 0.01 | 2.4(±0.3) × 10−4 | 0.39 ± 0.01 | 0.9995 |
| 210 | 4.3(±0.8) × 10−3 | 0.56 ± 0.17 | 1.5(±0.6) × 10−3 | 0.44 ± 0.17 | 0.9993 |
| 214 | 5.5(±1.6) × 10−3 | 1.00 ± 0.00 | — | — | 0.9979 |
| 217 | 1.0(±0.3) × 10−2 | 1.00 ± 0.00 | — | — | 0.9943 |
Relative fitted amplitude for the fast phase, normalized to the sum, Aobs,f + Aobs,s.
Relative fitted amplitude for the slow phase, normalized to the sum, Aobs,f + Aobs,s.
R, Pearson's correlation coefficient.
The decay of the CoII-substrate radical pair is well-fit by a monoexponential decay function at 214 K and 217 K. Representative data and fit for 214 K are shown in Fig. 4. The first-order rate constants (kobs,m) are presented in Table 1. The results show that, with increasing temperature over the narrow range of 207 < T < 214 K, there is a transition from a bi- to monoexponential form for the decay.
Distinction between biexponential and power law forms of the CoII-substrate radical pair decay
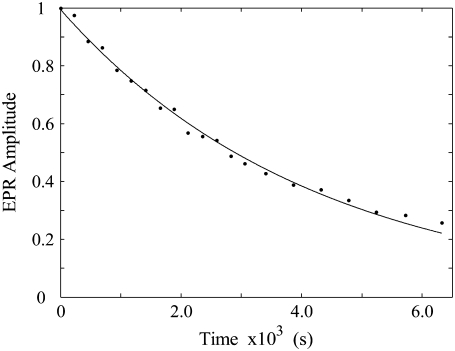
The distinction between biexponential and power law (multiexponential) functional forms for the CoII-substrate radical pair decay was addressed by a two-temperature annealing protocol. The CoII-substrate radical pair intermediate was annealed at a low temperature to reduce the amplitude to 30–40% of the initial amplitude. The low temperature was selected for this step, because the difference between the fast and slow relaxation times increases with decreasing temperature. This allows preparation of a sample which has a nearly “pure” proportion of the slow phase decay component. The sample temperature was then raised to a higher value, and the time dependence of the decay was measured. The decay for a representative two-step annealing experiment performed at 193 and 207 K is shown in Fig. 5. In contrast to the decay that occurred entirely at 207 K (shown in Fig. 4), the decay of the preannealed sample is well fit by a monoexponential function with a rate constant of 2.3 × 10⁻⁴ s−1, which is comparable to the average rate constant of 2.4 × 10⁻⁴ s−1 obtained for the slow phase of the decay in the biexponential fits of 207 K decays. These results support a biexponential decay, rather than a power law decay, for the temperature range of 190–210 K. Power law decays are characterized by a decrease in rate constant with increasing decay time, and are therefore fit poorly by a single exponential function (2).
FIGURE 5.
Decay of the substrate radical EPR amplitude at 207 K after partial decay at T = 193 K. The sample was held at 193 K for 13 h, and the substrate radical amplitude decayed to 38% of the initial amplitude. The subsequent decay at T = 207 K is shown, with overlaid monoexponential fit to the data (solid line). The EPR experimental conditions are as described in the legend to Fig. 3. Simulation parameters: first-order rate constant, 2.3 × 10⁻⁴ s−1; R2 = 0.9967.
DISCUSSION
Temperature dependence of the decay rate constants
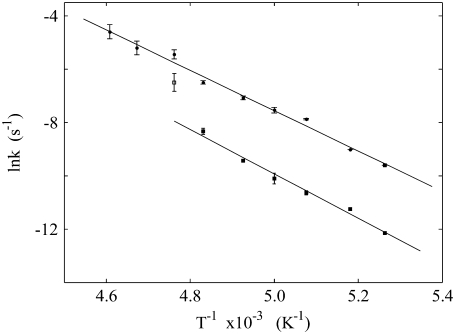
Fig. 6 shows a composite Arrhenius plot of the natural logarithms of the observed rate constants (Table 1) for the monoexponential and the fast and slow phases of the biexponential decay as functions of inverse absolute temperature (Eq. 3). The kobs,m and kobs,f values are well-fit by the same linear relation. The kobs,s values for 190 ≤ T ≤ 207 K are also well fit by a linear relation that displays different slope and ordinate intercept parameters from the kobs,m, kobs,f relation. The kobs,s value for 210 K was not included in the fit, and will be considered below. The adherence of the kobs,m and kobs,f values to the same linear relationship in Fig. 6 indicates that they correspond to the same reaction pathway and rate-limiting step. The different linear relation for kobs,s for 190 ≤ T ≤ 207 K suggests that the slow phase of decay either proceeds by a different pathway, or by the same pathway as for the fast phase, but with a different rate-limiting step.
FIGURE 6.
Arrhenius plots of the observed first-order rate constants for the decay of the CoII-substrate radical pair, kobs,m, kobs,f, and kobs,s. The combined kobs,m and kobs,f values (solid circles) are fitted by the upper line. The kobs,s values corresponding to 190 ≤ T ≤ 207 K (solid squares) are fitted by the lower line. The kobs,s value for 210 K (open square) is not included in the fit. The data are from Table 1. The fitting parameters are presented in Table 2.
TABLE 2.
Apparent Arrhenius reaction rate parameters for the fast and slow components of the CoII-substrate radical pair decay
| Component | log[Aapp (s−1)] | Ea,app (kcal mol−1) | R2* |
|---|---|---|---|
| Fast | 13.0 (±0.4) | 15.0 (±0.6) | 0.9909 |
| Slow | 13.9 (±0.9) | 16.6 (±1.0) | 0.9867 |
R, Pearson's correlation coefficient.
Temperature dependence of the amplitudes of the decay phases
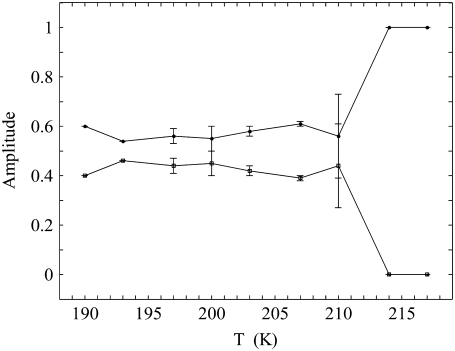
Fig. 7 shows the dependence of the normalized amplitudes of the fast and slow phases of the biexponential decay on temperature. The decay process proceeds with monoexponential kinetics at 217 and 214 K. As the temperature is decreased, the amplitude of the decay becomes split into the fast and slow components, Aobs,f and Aobs,s, over the relatively narrow temperature range of 207 < T < 214 K. This range includes the data point at 210 K. Below 210 K (190 ≤ T ≤ 207 K), the normalized fractions of the fast and slow component amplitudes remain constant, with values of Aobs,f = 0.57 ± 0.04 and Aobs,s = 0.43 ± 0.04, respectively. The constant amplitudes of Aobs,f and Aobs,s at T ≤ 207 K, shown in Fig. 7, and the linear Arrhenius relations for the corresponding rate constants, kobs,f and kobs,s, in Fig. 6, imply that the two decay components are characterized by different, constant values of the apparent Arrhenius parameters, Ea,app and Aapp, at T ≤ 207 K. The Arrhenius parameters are “apparent”, because the rate limitation on the observed reaction may arise from more than one step.
FIGURE 7.
Amplitudes of the fast and slow decay phases of the biexponential decay of the CoII-substrate radical pair, Aobs,f and Aobs,s, respectively, as a function of temperature. The amplitudes for 214 and 217 K correspond to the fit to the monoexponential decay function. The curves are drawn to guide the eye. The data are from Table 1.
Kinetic mechanism for the CoII-substrate radical pair decay
Low temperature range
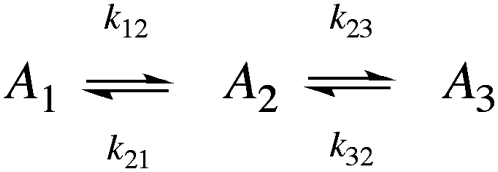
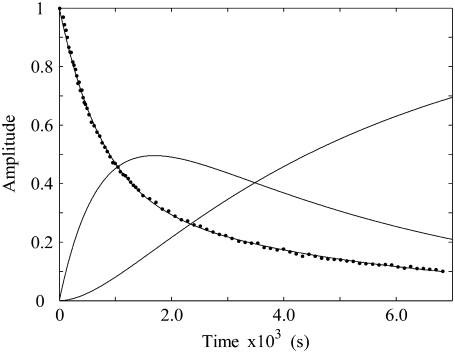
The biexponential decay of the CoII-substrate radical pair state for 190 ≤ T ≤ 207 K could arise from a homogenous process (single CoII-substrate radical pair population decaying by the same mechanism) or from an inhomogeneous process (two populations of CoII-substrate radical pair states that decay by different mechanisms). The minimal kinetic mechanism for a homogeneous biexponential decay is the two-step, three-state mechanism shown in Scheme 2. The experimental decay data, which correspond to the normalized amplitude,  in Scheme 2, has been simulated by using the homogeneous two-step decay model (Eqs. S1–S5, Data S1), and the best-fit kij and λi parameters have been used to predict the values of
  and
and  Fig. 8 shows a representative simulation of the CoII-substrate radical pair decay for T = 207 K. An excellent fit to the decay curve is obtained. However, the simulation predicts a maximum value of 0.5 for
  and simulations for the decay obtained at the other temperatures also predict
  values with maxima of ∼0.5. The relatively large maximum values of
  are required by the biexponential nature of the decay, which, in the homogeneous model, implies the transient accumulation of the intermediate A2 state. The large predicted
  values are inconsistent with the absence of detectable paramagnetic intermediates in the samples (Figs. 2 and 3), other than the CoII-substrate radical pair. Therefore, we conclude that the CoII-substrate radical pair decay at T ≤ 207 K is inhomogeneous. Two independent, parallel decay processes exist, which correspond to a fast decay population (state Af) and a slow decay population (state As) of CoII-substrate radical pairs, with the respective observed first-order rate constants, kobs,f and kobs,s.
SCHEME 2.
FIGURE 8.
Simulation of the CoII-substrate radical decay at 207 K by using the homogeneous linear two-step model (Scheme 2). The experimental decay data are shown as dots. The simulated normalized population of the A1 ( dotted line) state, and the calculated time dependence of the A2 (
 solid line) and A3 (
 dashed line) states, are shown. Simulation parameters: initial normalized populations A1,0 = 1.0, A2,0 = A3,0 = 0; k12 = 9.73 × 10⁻⁴ s−1, k21 = 3.87 × 10⁻⁴ s−1, k23 = 3.09 × 10⁻⁴ s−1, k32 = 0 s−1 (fixed); and R2 = 0.9994.
Transition temperature range
The transition from biexponential to monoexponential behavior with increasing temperature occurs in the interval, 207 < T < 214 K. Only the 210 K parameter set falls in the transition temperature range. Fig. 6 shows that the data point for kobs,s at 210 K lies significantly above the linear Arrhenius relation that fits the kobs,s data from the low temperature range. The value for kobs,s at 210 K in Table 1 (1.5 × 10⁻³ s−1) is 3.5-fold higher than predicted by using the low temperature Arrhenius relation (4.3 × 10⁻⁴ s−1). Therefore, the data at the single temperature of 210 K suggest that the transition from biexponential to monoexponential decay with increasing temperature is associated with a super-Arrhenius temperature dependence of kobs,s. We propose that kobs,s approaches kobs,f as the temperature is increased through the transition region, and therefore, that Ea,app,s, Aapp,s approaches Ea,app,m/f, Aapp,m/f. We also considered an alternative mechanism of an equilibrium, which is highly sensitive to temperature in the transition range, between two populations of CoII-substrate radical pairs, which decay with parameters, (Ea,app,s, Aapp,s) and (Ea,app,m/f, Aapp,m/f), respectively. Simulations based on this mechanism gave poor fits to the decay data at 210 K. A finer temperature sampling interval, lower measuring temperature uncertainty, and two-temperature experiments (Tlow = 193 K, Thigh = 208–213 K), such as presented in Fig. 5, will be used to further characterize the temperature dependence of kobs,s (alone, in the absence of interference from the fast phase), to gain further insight into the mechanism of the transition.
High temperature range
The monoexponential decay at T ≥ 214 K (Figs. 6 and 7, Table 1) is consistent with the increase of kobs,s to the limiting value of kobs,m, kobs,f over the range 210 < T < 214 K. At T ≥ 214 K, the decay channel represented by kobs,s is absent, and all of the decay of the CoII-substrate radical pair proceeds through a single channel, which is characterized by the Arrhenius parameters, Aapp,m = Aapp,f and Ea,app,m = Ea,app,f.
Physical interpretations of the origins of the decay phases
Fast biexponential phase and monoexponential decay processes
The steady-state accumulation, and subsequent cryotrapping, of the CoII-substrate radical pair as the only detectable paramagnetic intermediate, suggest that the step after CoII-substrate radical pair formation is at least partially rate limiting for steady-state turnover. The step after Coll-substrate radical pair formation in the catalytic sequence is the radical rearrangement, which involves conversion of the substrate radical to the product radical (Step 3 in Fig. 1). Partial rate limitation of steady-state turnover by the amine nitrogen-associated radical rearrangement step has also been concluded from substrate 15N/14N kinetic isotope effects on kcat/KM (40). Extrapolation of the linear Arrhenius relation for kobs,f and kobs,m to 298 K gives a value for the decay rate constant of 1.1 × 10² s−1 (uncertainty range: 1.4 × 101–8.0 × 10² s−1). This value is consistent with kcat values of 3.0–8.0 × 101 s−1 per active site that have been reported for EAL (40,63), and to the rate of decay of the CoII-radical pair state to products after substrate depletion (63–65), in room temperature steady-state kinetic experiments. Studies of the hydrogen atom transfer-mediated exchange of 3H between [3H]adenosylcobalamin labeled at the C5′ methylene carbon and aminoethanol in EAL show no detectable 3H equilibration with the free substrate (38,39). Therefore, the reaction of the CoII-substrate radical pair through the reverse of the first hydrogen atom transfer (HT1, Step 2 in Fig. 1) is strongly disfavored, and the radical rearrangement step is effectively irreversible (38,39). Therefore, we assign the observed rate constants for the fast phase of the biexponential decay (190–210 K) and the monoexponential decay (214, 217 K) to the native “forward” reaction of the substrate radical, through the rearrangement reaction.
Slow biexponential phase
We also assign the observed rate constants for the slow phase of the biexponential decay (190–210 K) to the native “forward” reaction of the substrate radical, for the reasons described in the previous section. The 210 K data point suggests a super-Arrhenius increase in kobs,s with increasing temperature, and, therefore a change in the potential energy surface for the slow phase in the transition region. The larger uncertainties in the Aobs values for 210 K relative to the low temperature range (Table 1) are consistent with a sharp transition near 210 K that lies partially within the temperature control uncertainty of ±0.7 K at this temperature (see Methods). The reaction chemistry itself is unlikely to display a mechanistic discontinuity over this temperature range, and therefore, the transition arises from a change in the properties of the protein. A change in the potential energy surface over the relatively narrow temperature range is characteristic of a liquid-glass transition (66). Different proteins display a solvent-dependent, liquid-glass-like transition, or “dynamical transition”, within the temperature range of 180–220 K (67). The slow phase emerges in association with this transition. We propose that a protein dynamical contribution to the reaction of the substrate radical, which is present above the transition temperature (for example, a fluctuation to a conformation that interacts more favorably with the product radical), is lost below the transition temperature, owing to an increase in the activation energy barrier for protein motions that are coupled to the reaction.
Anharmonic protein motions are observed to be restricted below the dynamical transition temperature (67). The dynamical transition alters the kinetics of reactions that are coupled to the protein motions (67). The transition over 207 < T < 214 K in EAL appears to be different from this “classical” protein dynamical transition, because a parallel, mechanistically distinct decay path (the slow phase) emerges as the temperature decreases in a fraction of the population, and both the fast and slow phase decay reactions are observed to continue with further decrease in temperature along temperature-independent potential energy surfaces (temperature independent Aapp, Ea,app) with monoexponential kinetics, rather than the multiexponential (distributed) kinetics that are characteristic of diatomic molecule migration and recombination with iron in Mb and other heme proteins below the dynamical transition (2, 67). For both the fast and slow phases of the low temperature decay of the CoII-substrate radical pair, the dynamical transition in coupled protein motions that are obligatory for the reaction of the CoII-substrate radical pair lies below 190 K.
SUPPLEMENTARY MATERIAL
To view all of the supplemental files associated with this article, visit www.biophysj.org.
Supplementary Material
Acknowledgments
The Supplementary Material includes the EPR spectrum of the CoII-substrate radical pair before annealing, comparison of the decay kinetics of the CoII and substrate radical components of the radical pair EPR lineshape, monoexponential and power law decay function fits to the CoII-substrate radical pair decay at selected temperatures, and expressions from the linear, three-state, two-step decay mechanism that were used for simulation of the homogeneous decay model.
This project was supported by grant No. R01DK054514 from the National Institute of Diabetes and Digestive and Kidney Diseases. The content is solely the responsibility of the authors and does not necessarily represent the official views of the National Institute of Diabetes and Digestive and Kidney Diseases or the National Institutes of Health. The purchase of the Bruker E500 EPR spectrometer was supported by grant No. RR17767 from the National Center for Research Resources of the National Institutes of Health and by Emory University.
Editor: Betty J. Gaffney.
References
- 1.Gibson, Q. H. 1956. An apparatus for flash photolysis and its application to the reactions of myoglobin with gases. J. Physiol. 134:112–122. [DOI] [PMC free article] [PubMed] [Google Scholar]
- 2.Austin, R. H., K. W. Beeson, L. Eisenstein, H. Frauenfelder, and I. C. Gunsalus. 1975. Dynamics of ligand binding to myoglobin. Biochemistry. 14:5355–5373. [DOI] [PubMed] [Google Scholar]
- 3.Frauenfelder, H., P. W. Fenimore, and B. H. McMahon. 2002. Hydration, slaving and protein function. Biophys. Chem. 98:35–48. [DOI] [PubMed] [Google Scholar]
- 4.Fenimore, P. W., H. Frauenfelder, B. H. McMahon, and F. G. Parak. 2002. Slaving: Solvent fluctuations dominate protein dynamics and functions. Proc. Natl. Acad. Sci. USA. 99:16047–16051. [DOI] [PMC free article] [PubMed] [Google Scholar]
- 5.Fenimore, P. W., H. Frauenfelder, B. H. McMahon, and R. D. Young. 2004. Bulk-solvent and hydration-shell fluctuations, similar to alpha- and beta-fluctuations in glasses, control protein motions and functions. Proc. Natl. Acad. Sci. USA. 101:14408–14413. [DOI] [PMC free article] [PubMed] [Google Scholar]
- 6.Dantsker, D., U. Samuni, J. M. Friedman, and N. Agmon. 2005. A hierarchy of functionally important relaxations within myoglobin based on solvent effects, mutations and kinetic models. Biochim. Biophys. Acta. 1749:234–251. [DOI] [PubMed] [Google Scholar]
- 7.Frauenfelder, H., F. Parak, and R. D. Young. 1988. Conformational substates in proteins. Annu. Rev. Biophys. Biophys. Chem. 17:451–479. [DOI] [PubMed] [Google Scholar]
- 8.Tetreau, C., L. Mouawad, S. Murail, P. Duchambon, Y. Blouquit, and D. Lavalette. 2005. Disentangling ligand migration and heme pocket relaxation in cytochrome P450(cam). Biophys. J. 88:1250–1263. [DOI] [PMC free article] [PubMed] [Google Scholar]
- 9.Tetreau, C., M. Tourbez, A. Gorren, B. Mayer, and D. Lavalette. 1999. Dynamics of carbon monoxide binding with neuronal nitric oxide synthase. Biochemistry. 38:7210–7218. [DOI] [PubMed] [Google Scholar]
- 10.Lavalette, D., and C. Tetreau. 1988. Viscosity-dependent energy barriers and equilibrium conformational fluctuations in oxygen recombination with hemerythrin. Eur. J. Biochem. 177:97–108. [DOI] [PubMed] [Google Scholar]
- 11.Ehrenstein, D., and G. U. Nienhaus. 1992. Conformational substates in azurin. Proc. Natl. Acad. Sci. USA. 89:9681–9685. [DOI] [PMC free article] [PubMed] [Google Scholar]
- 12.Blumenfeld, L. A., R. M. Davydov, S. N. Magonov, and R. O. Vilu. 1974. Studies on the conformational changes of metalloproteins induced by electrons in water-ethylene glycol solutions at low temperatures. Cytochrome c. FEBS Lett. 45:256–258. [DOI] [PubMed] [Google Scholar]
- 13.Blumenfeld, L. A., R. M. Davydov, S. N. Magonov, and R. O. Vilu. 1974. Studies on the conformational changes of metalloproteins induced by electrons in water-ethylene glycol solutions at low temperatures. Haemoglobin. FEBS Lett. 49:246–249. [DOI] [PubMed] [Google Scholar]
- 14.Symons, M. C. R., and R. L. Petersen. 1978. Electron-capture by oxyhemoglobin—ESR study. P. Roy. Soc. Lond. B. Bio. 201:285–300. [DOI] [PubMed] [Google Scholar]
- 15.Symons, M. C. R., and R. L. Petersen. 1978. The relative electron affinities of the alpha and beta chains of oxyhaemoglobin as a function of pH and added inositol hexaphosphate. An electron spin resonance study. Biochim. Biophys. Acta. 537:70–76. [DOI] [PubMed] [Google Scholar]
- 16.Gasyna, Z. 1979. Intermediate spin-states in one-electron reduction of oxygen-hemoprotein complexes at low temperature. FEBS Lett. 106:213–218. [DOI] [PubMed] [Google Scholar]
- 17.Davydov, R., V. Kofman, H. Fujii, T. Yoshida, M. Ikedo-Saito, and B. Hoffman. 2002. Catalytic mechanism of heme oxidase through EPR and ENDOR of cryoreduced oxy-heme oxygenase and its Asp 140 mutants. J. Am. Chem. Soc. 124:1798–1808. [DOI] [PubMed] [Google Scholar]
- 18.Davydov, R., T. Matsui, H. Fujii, M. Ikeda-Saito, and B. M. Hoffman. 2003. Kinetic isotope effects on the rate-limiting step of heme oxygenase catalysis indicate concerted proton transfer/heme hydroxylation. J. Am. Chem. Soc. 125:16208–16209. [DOI] [PubMed] [Google Scholar]
- 19.Davydov, R., V. Kofman, J. M. Nocek, R. W. Noble, H. Hui, and B. M. Hoffman. 2004. Conformational substates of the oxyheme centers in alpha and beta subunits of hemoglobin as disclosed by EPR and ENDOR studies of cryoreduced protein. Biochemistry. 43:6330–6338. [DOI] [PubMed] [Google Scholar]
- 20.Davydov, R., R. Perera, S. Jin, T.-C. Yang, T. A. Bryson, M. Sono, J. H. Dawson, and B. M. Hoffman. 2005. Substrate modulation of the properties and reactivity of the oxy-ferrous and hydroperoxo-ferric intermediates of cytochrome P450cam as shown by cryoreduction-EPR/ENDOR spectroscopy. J. Am. Chem. Soc. 127:1403–1413. [DOI] [PubMed] [Google Scholar]
- 21.Blumenfeld, L. A., D. S. Burbaev, R. M. Davydov, L. N. Kubrina, A. F. Vanin, and R. O. Vilu. 1975. Studies on the conformational changes of metalloproteins induced by electrons in water-ethylene glycol solutions at low temperatures III. Adrenal ferredoxin. Biochim. Biophys. Acta. 379:512–516. [DOI] [PubMed] [Google Scholar]
- 22.Ericson, A., B. Hedman, K. O. Hodgson, J. Green, H. Dalton, J. G. Bentsen, R. H. Beer, and S. J. Lippard. 1988. Structural characterization by EXAFS spectroscopy of the binuclear iron center in protein A of methane monooxygenase from Methylococcus capsulatus (Bath). J. Am. Chem. Soc. 110:2330–2332. [Google Scholar]
- 23.De Witt, J. G., J. G. Bentsen, A. C. Rosenzweig, B. Hedman, J. Green, S. Pilkington, G. C. Papaefthymiou, H. Dalton, K. O. Hodgson, and S. J. Lippard. 1991. X-ray absorption, Mössbauer, and EPR studies of the dinuclear iron center in the hydroxylase component of methane monooxygenase. J. Am. Chem. Soc. 113:9219–9235. [Google Scholar]
- 24.Davydov, R., S. Kuprin, A. Gräslund, and A. Ehrenberg. 1994. Electron resonance study of the mixed-valent diiron center in Escherichia coli ribonucleotide reductase produced by reduction of radical-free protein R2 at 77 K. J. Am. Chem. Soc. 116:11120–11128. [Google Scholar]
- 25.Valentine, A. M., P. Tavares, A. S. Pereira, R. Davydov, C. Krebs, B. M. Hoffman, D. E. Edmondson, B. H. Huynh, and S. J. Lippard. 1998. Generation of a mixed-valent Fe(III)Fe(IV) form of intermediate Q in the reaction of soluble methane monooxygenase, an analog of intermediate X in ribonucleotide reductase R2 assembly. J. Am. Chem. Soc. 120:2190–2191. [Google Scholar]
- 26.Lukoyanov, D., B. M. Barney, D. R. Dean, L. C. Seefeldt, and B. M. Hoffman. 2007. Connecting nitrogenase intermediates with the kinetic scheme for N2 reduction by a relaxation protocol and identification of the N2 binding state. Proc. Natl. Acad. Sci. USA. 104:1451–1455. [DOI] [PMC free article] [PubMed] [Google Scholar]
- 27.Hubbard, T. J. P., B. Ailey, S. E. Brenner, A. G. Murzin, and C. Chothia. 1999. SCOP: a structural classification of proteins database. Nucleic Acids Res. 27:254–256. [DOI] [PMC free article] [PubMed] [Google Scholar]
- 28.Sun, L., and K. Warncke. 2006. Comparative model of EutB from coenzyme B12-dependent ethanolamine ammonia-lyase reveals a b8a8, TIM-barrel fold and radical catalytic site structural features. Proteins. 64:308–319. [DOI] [PubMed] [Google Scholar]
- 29.Bandarian, V., and G. H. Reed. 1999. Ethanolamine ammonia-lyase. In Chemistry and Biochemistry of B12. R. Banerjee, editor. John Wiley and Sons, New York. 811–833.
- 30.Toraya, T. 2003. Radical Catalysis in coenzyme B12-dependent isomerization (eliminating) reactions. Chem. Rev. 103:2095–2127. [DOI] [PubMed] [Google Scholar]
- 31.Brown, K. 2005. Chemistry and enzymology of vitamin B12. Chem. Rev. 105:2075–2149. [DOI] [PubMed] [Google Scholar]
- 32.Warncke, K., J. C. Schmidt, and S. C. Ke. 2008. Identification of a rearranged-substrate, product radical intermediate and the contribution of a product radical trap in vitamin B12 coenzyme-dependent ethanolamine deaminase catalysis. J. Am. Chem. Soc. 130:6055. [Google Scholar]
- 33.Warncke, K., J. C. Schmidt, and S.-C. Ke. 1999. Identification of a rearranged-substrate, product radical intermediate and the contribution of a product radical trap in vitamin B12 coenzyme-dependent ethanolamine deaminase catalysis. J. Am. Chem. Soc. 121:10522–10528. [Google Scholar]
- 34.Sun, L., O. A. Groover, J. M. Canfield, and K. Warncke. 2008. Critical role of arginine 160 of the EutB protein subunit for active site structure and radical catalysis in coenzyme B12-dependent ethanolamine ammonia-lyase. Biochemistry. 47:5523–5535. [DOI] [PubMed] [Google Scholar]
- 35.Babior, B. M., T. H. Moss, W. H. Orme-Johnson, and H. Beinert. 1974. The mechanism of action of ethanolamine ammonia lyase, a B12-dependent enzyme: The participation of paramagnetic species in the catalytic deamination of 2-aminopropanol. J. Biol. Chem. 249:4537–4544. [PubMed] [Google Scholar]
- 36.Bandarian, V., and G. H. Reed. 2002. Analysis of the electron paramagnetic resonance spectrum of a radical intermediate in the coenyzme b12-dependent ethanolamine ammonia-lyase catalyzed reaction of S-2-aminopropanol. Biochemistry. 41:8580–8588. [DOI] [PubMed] [Google Scholar]
- 37.Canfield, J. M., and K. Warncke. 2002. Geometry of reactant centers in the COII-substrate radical pair state of coenzyme B12-dependent ethanolamine deaminase determined by using orientation-selection-ESEEM spectroscopy. J. Phys. Chem. B. 106:8831–8841. [DOI] [PubMed] [Google Scholar]
- 38.Weisblat, D. A., and B. M. Babior. 1971. The mechanism of action of ethanolamine ammonia-lyase, a B12-dependent enzyme. VIII. Further studies with compounds labelled with isotopes of hydrogen: Identification and some properties of the rate limiting step. J. Biol. Chem. 246:6064–6071. [PubMed] [Google Scholar]
- 39.Carty, T. J., B. M. Babior, and R. H. Abeles. 1974. The mechanism of action of ethanolamine ammonia-lyase, a B12-dependent enzyme. Evidence for two intermediates in the catalytic process. J. Biol. Chem. 249:1683–1688. [PubMed] [Google Scholar]
- 40.Poyner, R. R., M. A. Anderson, V. Bandarian, W. W. Clelland, and G. H. Reed. 2006. Probing nitrogen-sensitive steps in the free-radical-mediated deamination of amino alcohols by ethanolamine ammonia-lyase. J. Am. Chem. Soc. 128:7120–7121. [DOI] [PMC free article] [PubMed] [Google Scholar]
- 41.Licht, S. S., C. C. Lawrence, and J. Stubbe. 1999. Class II ribonucleotide reductases catalyze carbon-carbon bond reformation on every turnover. J. Am. Chem. Soc. 121:7463–7468. [Google Scholar]
- 42.Bradbeer, C. 1965. The clostridial fermentations of choline and ethanolamine. J. Biol. Chem. 240:4669–4674. [PubMed] [Google Scholar]
- 43.Faust, L. P., J. A. Connor, D. M. Roof, J. A. Hoch, and B. M. Babior. 1990. AdoCbl-dependent ethanolamine amino-lyase from Salmonella typhimurium. J. Biol. Chem. 265:12462–12466. [PubMed] [Google Scholar]
- 44.Faust, L. P., and B. M. Babior. 1992. Overexpression, purification and some properties of AdoCbl-dependent ethanolamine amino-lyase from Salmonella typhimurium. Arch. Biochem. Biophys. 294:50–54. [DOI] [PubMed] [Google Scholar]
- 45.Harkins, T., and C. B. Grissom. 1995. J. Am. Chem. Soc. 117:566–567. [Google Scholar]
- 46.Kaplan, B. H., and E. R. Stadtman. 1968. Ethanolamine deaminase, a cobamide coenzyme-dependent enzyme. J. Biol. Chem. 243:1787–1793. [PubMed] [Google Scholar]
- 47.Hollaway, M. R., A. W. Johnson, M. F. Lappert, and O. C. Wallis. 1980. The number of functional sites per molecule of the adenosylcobalamin-dependent enzyme, ethanolamine deaminase, as determined by a kinetic method. Eur. J. Biochem. 111:177–188. [DOI] [PubMed] [Google Scholar]
- 48.Bandarian, V., and G. H. Reed. 1999. Hydrazine cation radical in the active site of ethanolamine ammonia-lyase: mechanism-based inactivation by hydroxyethylhydrazine. Biochemistry. 38:12394–12402. [DOI] [PubMed] [Google Scholar]
- 49.Moore, J. W., and R. G. Pearson. 1981. Kinetics and Mechanism. Wiley and Sons, New York.
- 50.Pilbrow, J. R. 1982. EPR of B12-dependent enzyme reactions and related systems. In B12. D. Dolphin, editor. Wiley, New York. 431–462.
- 51.Boas, J. F., P. R. Hicks, J. R. Pilbrow, and T. D. Smith. 1978. Interpretation of electron spin resonance spectra due to some B12-dependent enzyme reactions. J. Chem. Soc. Faraday II. 74:417–431. [Google Scholar]
- 52.Canfield, J. M., and K. Warncke. 2005. Active site reactant center geometry in the COII-product radical pair state of coenzyme B12-dependent ethanolamine deaminase determined by using orientation-selection-ESEEM spectroscopy. J. Phys. Chem. B. 109:3053–3064. [DOI] [PubMed] [Google Scholar]
- 53.Ke, S.-C. 2003. Spin-spin interaction in ethanolamine deaminase. Biochim. Biophys. Acta. 1620:267–272. [DOI] [PubMed] [Google Scholar]
- 54.Wetmore, S. D., D. M. Smith, J. T. Bennett, and L. Radom. 2002. Understanding the mechanism of action of B12-dependent ethanolamine ammonia-lyase: synergistic interactions at play. J. Am. Chem. Soc. 124:14054–14065. [DOI] [PubMed] [Google Scholar]
- 55.Semialjac, M., and H. Schwarz. 2003. Computational study on mechanistic details of the aminoethanol rearrangement catalyzed by the vitamin B12-dependent ethanolamine ammonia lyase: His and Asp/Glu acting simultaneously as catalytic auxiliaries. J. Org. Chem. 68:6967–6983. [DOI] [PubMed] [Google Scholar]
- 56.Sandala, G. M., D. M. Smith, and L. Radom. 2005. Divergent mechanisms of suicide inactivation for ethanolamine ammonia-lyase. J. Am. Chem. Soc. 127:8856–8864. [DOI] [PubMed] [Google Scholar]
- 57.Wang, M., and K. Warncke. 2008. Kinetic and thermodynamic characterization of COII-substrate radical pair formation in coenzyme B12-dependent ethanolamine ammonia-lyase in a cryosolvent system by using time-resolved, full-spectrum continuous-wave electron paramagnetic resonance spectroscopy. J. Am. Chem. Soc. 130:4846–4858. [DOI] [PubMed] [Google Scholar]
- 58.Tang, K.-H., C. H. Chang, and P. A. Frey. 2001. Electron transfer in the substrate-dependent suicide inactivation of lysine 5,6-aminomutase. Biochemistry. 40:5190–5199. [DOI] [PubMed] [Google Scholar]
- 59.Magnusson, O. T., and P. A. Frey. 2002. Interactions of diol dehydrase and 3′-4′-anhydroadenosylcobalamin: suicide inactivation by electron transfer. Biochemistry. 41:1695–1702. [DOI] [PubMed] [Google Scholar]
- 60.Huhta, M. S., D. Ciceri, B. T. Golding, and E. N. G. Marsh. 2002. A novel reaction between adenosylcobalamin and 2-methyleneglutarate catalyzed by glutamate mutase. Biochemistry. 41:3200–3206. [DOI] [PubMed] [Google Scholar]
- 61.Vlasie, M. D., and R. Banerjee. 2004. When a spectator turns killer: suicidal electron transfer from cobalamin in methylmalonyl-CoA mutase. Biochemistry. 43:8410–8417. [DOI] [PubMed] [Google Scholar]
- 62.Chen, E., and M. R. Chance. 1993. Continuous-wave quantum yields of various cobalamins are influenced by competition between geminate recombination and cage escape. Biochemistry. 32:1480–1487. [DOI] [PubMed] [Google Scholar]
- 63.Bandarian, V., and G. H. Reed. 2000. Isotope effects in the transient phases of the reaction catalyzed by ethanolamine ammonia-lyase: determination of the number of exchangeable hydrogens in the enzyme-cofactor complex. Biochemistry. 39:12069–12075. [DOI] [PubMed] [Google Scholar]
- 64.Holloway, M. R., H. A. White, K. N. Joblin, A. W. Johnson, M. F. Lappert, and C. O. Wallis. 1978. A spectrophotometric rapid kinetic study of reactions catalyzed by coenzyme B12-dependent ethanolamine ammonia-lyase. Eur. J. Biochem. 82:143–154. [DOI] [PubMed] [Google Scholar]
- 65.Wallis, O. C., R. C. Bray, S. Gutteridge, and M. R. Hollaway. 1982. The extents of formation of cobalt(II)-radical intermediates in the reactions with different substrates catalyzed by the adenosylcobalamin-dependent enzyme ethanolamine ammonia-lyase. Eur. J. Biochem. 125:299–303. [DOI] [PubMed] [Google Scholar]
- 66.Angell, C. A. 1995. Formation of glasses from liquid and biopolymers. Science. 267:1924–1935. [DOI] [PubMed] [Google Scholar]
- 67.Ringe, D., and G. A. Petsko. 2003. The ‘glass transition’ in protein dynamics: what it is, why it occurs, and how to exploit it. Biophys. Chem. 105:667–680. [DOI] [PubMed] [Google Scholar]
- 68.Ke, S.-C., M. Torrent, D. G. Museav, K. Morokuma, and K. Warncke. 1999. Identification of dimethylbenzimidazole axial coordination and characterization of 14N superhyperfine and nuclear quadrupole coupling in Cob(II)alamin bound to ethanolamine deaminase in a catalytically-engaged substrate radical-COII biradical state. Biochemistry. 38:12681–12689. [DOI] [PubMed] [Google Scholar]
- 69.Abend, A., V. Bandarian, R. Nitsche, E. Stupperich, J. Retey, and G. H. Reed. 1999. Ethanolamine ammonia-lyase has a “base-on” binding mode for coenzyme B12. Arch. Biochem. Biophys. 370:138–141. [DOI] [PubMed] [Google Scholar]
Associated Data
This section collects any data citations, data availability statements, or supplementary materials included in this article.


