Abstract
It has been found experimentally that negatively charged phosphatidic acid (PA) lipids and cholesterol molecules stabilize the nicotinic acetylcholine receptor (nAChR) in a functional resting state that can participate in an agonist-induced conformational change. In this study, we compare phosphatidylcholine (PC) and PA lipid behavior in the presence of the nAChR to determine why PC lipids do not support a functional nAChR. For lipids that are located within 1.0 nm of the protein, both PC and PA lipids have very similar order-parameter and bilayer-thickness values, which indicate that the annular lipid properties are protein-dependent. The most significant difference between the PC and PA bilayers is the formation of a lipid domain around the protein, which is visible in the PA bilayer but not the PC bilayer. This suggests that the PA domain may help stabilize the nAChR resting state. The PA lipids in the microdomain have a decreased order compared to a homogeneous PA bilayer and the lipids near the protein attempt to increase the free space in their vicinity by residing in multiple lateral planes.
INTRODUCTION
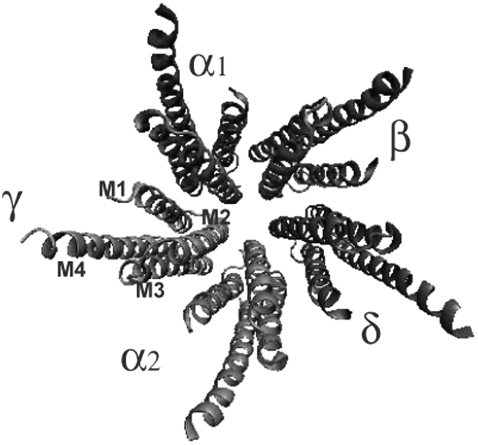
Before a muscle can contract, it must receive an excitatory message from neurons in the neuromuscular junction. One transmembrane protein that plays an important role in this process is the neuromuscular nicotinic acetylcholine receptor (nAChR), which is highly concentrated at the nerve-muscle synapse (1). This receptor consists of three domains: an N-terminal extracellular ligand-binding domain, a transmembrane domain, and a small intracellular domain (1). The transmembrane domain (Fig. 1) contains five homologous subunits: α1, β, δ, α2, and γ. Each subunit consists of four helical segments, M1–M4. The M2 helices form an inner ring that shapes the pore and helices M1, M3, and M4 serve as a buffer between the lipids and the M2 helices.
FIGURE 1.
The nAChR transmembrane region is composed of five subunits: α1, β, δ, α2, and γ. Each subunit contains four helices: M1, M2, M3, and M4 (PDB:1OED (16)).
Lipids can modulate a transmembrane protein conformation through a variety of interactions: hydrogen bonding, hydrophobic interactions, charge interactions, alteration of membrane fluidity, etc. (2). Because transmembrane protein surfaces may contain crevices, lipids that are located very close to the protein may behave quite differently than lipids that are located farther from the surface. When studying a heterogeneous lipid/protein bilayer, lipid molecules can be categorized into three categories: bulk, annular, and nonannular lipids. Bulk lipids are not directly in contact with the protein and have the same properties as lipids in a homogeneous lipid bilayer (2). Annular lipids serve as a solvent to the protein and interact with it nonspecifically. Nonannular lipids are often required for protein activity and they can be located between α-helices (2). Because of their favorable interactions with the protein, most lipids in high-resolution crystal structures are nonannular lipids (2). Using a fluorescence quenching method, Jones and McNamee found that cholesterol molecules interact with the nAChR at nonannular sites and they suggest that cholesterol molecules help stabilize the receptor α-helices (3).
The nAChR requires the presence of a negatively charged lipid and a neutral lipid to maintain a functional nondesensitized state (4). Even though anionic lipids typically comprise only 10–20 mol % of membrane lipids, their presence is required for the activity of several ion channels (5). To determine the importance of lipid headgroup structure and charge on the activity of the nAChR, daCosta et al. compared phosphatidic acid (PA)/phosphatidylcholine (PC) and phosphatidylserine (PS)/PC bilayers, where PA and PS are anionic lipids (6). They found that the nAChR was able to undergo an agonist-induced conformational change in bilayers that contained PA lipids, but not in bilayers that contained PS lipids (6). Hence, even if the nAChR is solvated by negatively charged lipids, this does not guarantee that the nAChR will be in a functional state.
Since the PA/nAChR interactions are not solely dependent on electrostatics, the structure of the PA headgroup must affect the nAChR conformation. A small lipid headgroup can result in tight lipid packing and can order the microenvironment around the channel. Wenz and Barrantes found that when the nAChR was added to a 1-palmitoyl-2-oleoylphosphatidic acid (POPA)/1-palmitoyl-2-oleoylphosphatidylcholine (POPC) bilayer, the channel was able to effectively sequester POPA lipids from the bilayer, such that a small POPA domain formed around the nAChR (7). Using fluorescence measurements, Antollini and Barrantes found that even though the membrane fluidity is different for structurally varied fatty acids, all of the examined lipids occupied equivalent nAChR surface sites and altered the single channel open channel durations in the same manner (8). Hence, PA lipid fluidity cannot be the only factor that is necessary for creating a conducive environment for a functional nAChR.
Under physiological pH and salt (150 mM) concentrations, PA lipids have a negative spontaneous curvature (9). A negative spontaneous curvature is common for lipids with small headgroups and in aqueous solution these lipids may aggregate to form a nonlamellar structure. The characteristic shape that a lipid exhibits is not only dependent on the area occupied by the headgroup and the acyl chains, but also on the environmental conditions, such as pH, temperature, and salt concentration (10). Even though some lipids prefer to exist in nonlamellar aggregates in solution, they naturally integrate into biological membranes. Their existence is an interesting phenomenon since their preferred aggregate conformation is not a lamellar structure. It has been found that certain transmembrane proteins require the presence of these types of lipids to maintain functionality and that the stress that the lipids impose on neighboring channels may impact the protein conformational states (2). Therefore, the combination of lipid charge and shape may jointly make PA an adequate solvent for the nAChR.
A number of MD simulations have been conducted on the nAChR in membranes composed of uncharged lipids to study its shape, the dynamics of its pore-lining residues, the passage of water through the channel, and its interactions with anesthetics and noncompetitive inhibitors (11–15). Here, we examine how the interactions between the negatively charged PA lipids and the nAChR differ from the interactions between the neutrally charged PC lipids and the nAChR to highlight how the chemical and structural properties of a lipid can influence its behavior near a transmembrane protein.
METHODS
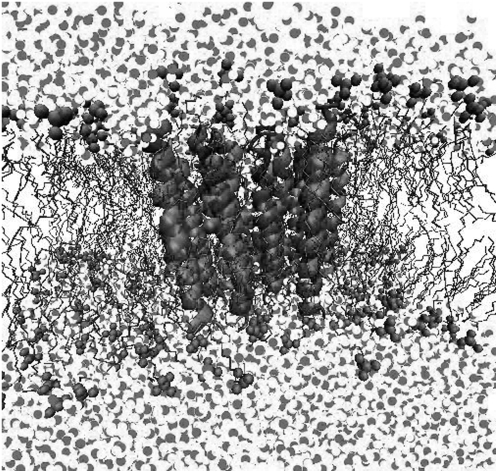
We embedded the transmembrane portion of the nAChR (PDB: 1OED (16)) into a POPA and a POPC bilayer (Fig. 2) (17).
FIGURE 2.
A snapshot of the nAChR in the POPC bilayer.
The lipid structures for each simulation were based on a united atom model, where the lipid acyl chain hydrogen atoms are not explicitly represented. The starting configuration for a 128-lipid POPC bilayer was obtained from the end of a 1.6-ns simulation performed by Kandt et al. (http://moose.bio.ucalgary.ca) and this bilayer was replicated four times to create a bilayer of 512 lipids. This bilayer was equilibrated for 31 ns and the protein was implanted into the equilibrated bilayer using the INFLATEGRO program (18). After protein insertion, the system contained 325 lipids, 15,100 water molecules, and one Na+ ion to maintain system neutrality. To reequilibrate the bilayer, we performed several 100-ps NVT simulations with varying levels of atomic restraints. In the first simulation, all protein and lipid atoms were fixed, leaving only the water molecules unrestrained. In the second simulation, all lipid restraints were removed except for those on the Phosphate (P) atoms. The third simulation included only protein backbone restraints and the final equilibration simulation included a 100-ps NPT simulation with backbone restraints. After this, all restraints were removed. This structure served as the starting point for the POPA system, where the POPC lipids were converted to POPA lipids by replacing the POPC choline group (Fig. 3) with a hydrogen atom.
FIGURE 3.
Structure of a POPC lipid. The POPC choline group is replaced with a hydrogen atom in POPA.
Since POPA has a charge of −1 at a neutral pH, an additional 325 Na+ ions were added to the POPA bilayer. The length of the POPC simulation was 41.3 ns and the length of the POPA simulation was 34.7 ns. The last 23.5 ns of the POPC simulation and the last 26.5 ns of the POPA simulation included 150 mM of salt (NaCl). Thus, there were 43 Na+ ions and 42 Cl− ions in the POPC system and 368 Na+ ions and 42 Cl− ions in the POPA system. Equilibration was monitored by measuring the xy-box size and the root mean-squared deviation (RMSD) of the protein backbone Cα atoms. To ensure that the Na+ ions in the POPA system had equilibrated, we calculated the Na+ ion coordination number for four consecutive 2-ns segments from the data-analysis portion of the trajectory. This value represents the number of oxygen atoms that are located within the first shell of a Na+ ion. To obtain this value, we calculated the radial distribution function (RDF) between the Na+ ions and the oxygen atoms (O7, O11, O14, O16, O33, and O35) and integrated the first peak from 0 to 0.3 nm. The average coordination numbers and their standard deviations (shown in parentheses) are O7, 6.12 (0.03); O11, 4.95 (0.04); O14, 0.094 (0.007); O16, 0.26 (0.02); O33, 0.032 (0.006); and O35, 0.57 (0.03).
The lipid force-field parameters were a combination of nonbonded parameters described by Berger et al. (19) and the GROMOS87 force field (20). The water parameters were from the simple point charge model (21). The partial charges for the POPA phosphate and ester groups were previously calculated at the HF level with the 6-31+G* basis set using the CHELPG method in Gaussian 03 (22,23). Parameters for the protein came from the GROMOS force-field parameter set 43A2 (20,24,25).
The simulations were performed with the MD package GROMACS 3.3 and data was evaluated using GROMACS tools (26–28). The phase transition temperature for POPA is 301 K and for POPC is 268 K (29,30). Both systems were maintained at 310 K using a Berendsen thermostat with a coupling time constant of 0.1 ps (31). The system pressure was maintained anisotropically at 1.0 bar using a Berendsen barostat with a coupling constant of 0.2 ps. Bond lengths were constrained using the LINCS algorithm (32). The Lennard-Jones interaction cutoff was 1.0 nm with a switch function starting at 0.8 nm. The electrostatics were calculated using the particle-mesh Ewald method (33) with a short-range cutoff of 1.2 nm. The time step was 2 fs. The center-of-mass motion of each leaflet was removed at every time step. The last 10 ns of each simulation were used for data analysis. Some data from the POPC/nAChR and POPA/nAChR bilayers are compared with results obtained from previous simulations that were conducted on pure POPC and pure POPA bilayers (23).
RESULTS
Helical stability
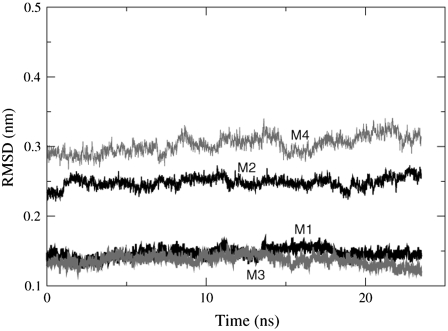
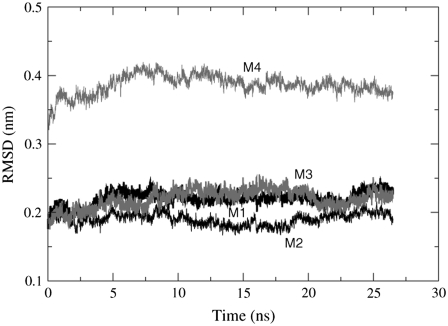
The stability of the transmembrane region of the nAChR was monitored via the root mean-squared deviation (RMSD) of the protein backbone Cα atoms, with the PDB serving as the reference structure. The average RMSD for the nAChR Cα atoms in the POPC bilayer is 0.48 nm ± 0.01 and the RMSD in the POPA bilayer is 0.55 nm ± 0.01. The RMSD of helices M1–M4 is shown in Figs. 4 and 5, where M4 has the largest RMSD in both the POPC and the POPA bilayers. Because the loop connecting helices M3 and M4 is not fully resolved in the crystal structure, this result is not unexpected. In a simulation of the α- and δ-subunits in a 1,2-dioleoyl-sn-glycerol-3-phosphocholine (DOPC) bilayer, Vemparala et al. found that the M1 and M3 helices had lower RMSD values than the M2 and M4 helices in both subunits (34). This is similar to the POPC bilayer results shown in Fig. 4. The M2 loop has the smallest RMSD in the POPA bilayer and one might expect this result because the M2 helices line the channel pore and hence need to have a high level of stability. In a simulation of the nAChR in a dipalmitoylphosphatidylcholine (DPPC) bilayer, Xu et al. found that the M2 helix was the most stable (M1, ∼0.45 nm; M2, ∼0.27 nm; and M3, ∼0.35 nm) (14).
FIGURE 4.
The average RMSD values of the Cα atoms in the five subunits for helices M1–M4 in the POPC bilayer. The RMSD values are shown for the trajectory frames that include a 150 mM salt concentration. Average RMSD helix values: M1 = 0.15 nm ± 0.01, M2 = 0.25 nm ± 0.01, M3 = 0.14 nm ± 0.01, and M4 = 0.30 nm ± 0.01.
FIGURE 5.
The average RMSD values of the Cα atoms in the five subunits for helices M1–M4 in the POPA bilayer. The RMSD values are shown for the trajectory frames that include a 150 mM salt concentration. Average RMSD helix values: M1 = 0.22 nm ± 0.01, M2 = 0.19 nm ± 0.01, M3 = 0.22 nm ± 0.01, and M4 = 0.39 nm ± 0.01.
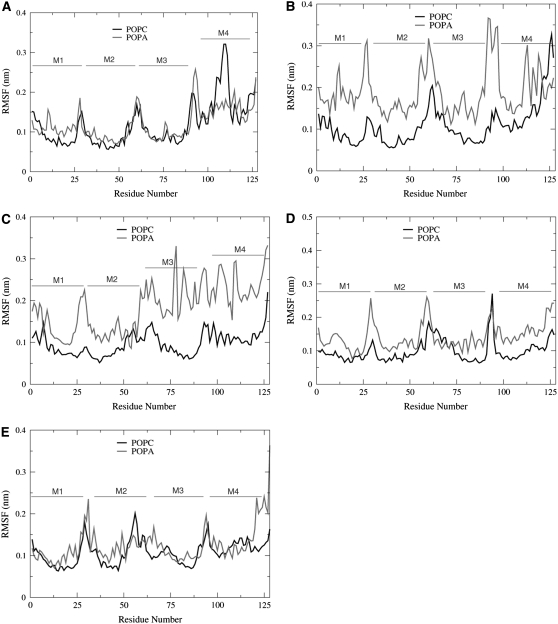
To examine the flexibility of the M1–M4 helices, we calculated the root mean-squared fluctuations (RMSF). Residues that have small RMSF values are more structured and less flexible than residues that have large RMSF values. In calculating the RMSF, each trajectory frame was fit to a common reference structure, which was the initial protein PDB structure. The RMSF values are shown in Fig. 6 for the POPC and POPA trajectory frames that include a 150-mM salt concentration.
FIGURE 6.
The RMSF of the (A) α1, (B) β, (C) δ, (D) α2, and (E) γ-subunits.
We found that the M4 helices typically have larger RMSF values than helices M1–M3, which may again be partially attributed to the unresolved M3-M4 connecting loop. Increased RMSF values for the M4 termini residues were also seen in a MD simulation of a neuronal-type nAChR in a 1,2-dimyristoyl-sn-glycerol-3-phosphocholine (DMPC) bilayer (13). In a simulation of the α- and δ-nAChR subunits, Vemparala et al. found RMSF values <0.1 nm for nonterminal and nonloop residues (34). Fig. 6 shows that for the M1–M3 helices, the RMSF values <0.15 nm, except for the β- and δ-subunits in the POPA bilayer. The helices in the POPC bilayer generally have smaller RMSF values than the helices in the POPA bilayer. One obvious exception to this is seen for the α1-subunit, where the POPC bilayer has a large peak in the M4 helix. Since a large RMSF value indicates that a residue has a high degree of mobility, we calculated the tilt angle of this α1-M4 helix with respect to the bilayer normal. We find that the α1-M4 helix has the largest tilt-angle standard deviation (22.4° ± 3.7°) of the 20 nAChR helices in the POPC bilayer. The large RMSF values seen in the β- and δ-subunits in the POPA bilayer, however, are not caused by large fluctuations in the tilt angle. In the following sections, we examine why the interactions between the POPA lipids and the β- and δ-subunits of the nAChR result in larger fluctuations than seen in the POPC bilayer.
Table 1 shows the average tilt angle for the M1–M4 helices, where 0° corresponds to the bilayer normal. For a neuronal-type nAChR in a DOPC bilayer, Saladino et al. found the tilt angle for M1 to be ∼12.5°, M2 ∼5°, M3 to be slightly above 15°, and M4 to be between 12.5 and 15° (13). These results are similar to the tilt angles that are found in both the POPC and the POPA bilayers. In a simulation study of a model nAChR pore in a DMPC bilayer, Saiz and Klein found that the M2 helices have a tilt angle of ∼12° (12).
TABLE 1.
The average tilt angle (°) and end-to-end distance (nm) of the nAChR helices in subunits α1, β, δ, α2, and γ; the standard deviations are shown in parentheses
| M1 | M2 | M3 | M4 | |
|---|---|---|---|---|
| Tilt angle (POPC) | 7.9 (3.3) | 8.4 (4.0) | 14.3 (3.1) | 17.9 (5.4) |
| Tilt angle (POPA) | 12.2 (5.4) | 7.4 (4.3) | 15.4 (7.7) | 18.8 (6.9) |
| Helical length (POPC) | 4.1 (0.2) | 4.2 (0.2) | 3.5 (0.2) | 4.4 (0.3) |
| Helical length (POPA) | 4.2 (0.3) | 4.1 (0.1) | 3.6 (0.3) | 4.5 (0.4) |
Table 1 shows that the end-to-end distance of the helices, which is the distance between the first and last Cα atoms in the helix along the z-axis, is quite similar for the helices located in the POPC and POPA bilayers.
Bilayer fluidity
Using Fourier-transform infrared spectroscopy, daCosta et al. found that in the presence of the nAChR, POPC/dioleoyl phosphatidic acid (DOPA) bilayers show less water penetration than POPC bilayers, indicating that the POPC/DOPA bilayers have tighter lipid packing and larger chain order than the POPC bilayers (35). They also found that the nAChR increases the lipid transition temperature (Tm) of a POPC bilayer by 1°C, versus 13.4°C for a POPC/DOPA bilayer and 13.0°C for a POPC/POPA bilayer. This indicates that the nAChR is more effective at restraining the conformations of the PA lipids than the PC lipids. To relate these experimental results with our simulations, we calculate the RDF between the water molecules and the lipid oxygen atoms located near the water/bilayer interface, the lipid order parameters, and the bilayer thickness as a function of lateral distance from the nAChR.
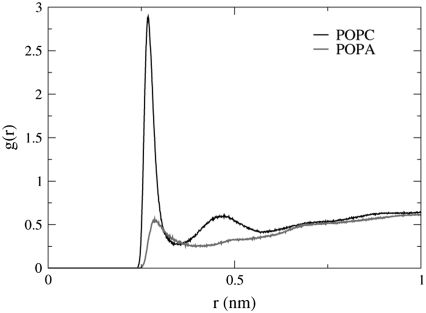
To determine whether there is a difference in water molecule location with respect to the bilayer interface between POPC and POPA, we calculate the RDF between the ester oxygen atoms (O14, O16, O33, and O35) and the water molecule oxygen atoms. Fig. 7 depicts the RDF for oxygen atom O35 and shows that it is five times more likely to find a water molecule near atom O35 in the POPC bilayer than in the POPA bilayer. This finding agrees with the experimental results of daCosta et al., where they found that bilayers that contained DOPA showed less water penetration than pure POPC bilayers (35). The RDF for atoms O14, O16, and O33, however, do not show significant differences between the POPC and POPA bilayers.
FIGURE 7.
The RDF for POPC and POPA ester oxygen atom O35 and the water molecule oxygen atoms. The preferred distance between POPC atom O35 and the water molecules is 0.27 nm (peak height = 2.9) and between POPA atom O35 and the water molecules is 0.29 nm (peak height = 0.56).
The lipid order parameter is another useful measurement for comparing the fluidity of two bilayers. Besides composition, the distance between a particular lipid and the nAChR will have an impact on its acyl chain order. To determine how the nAChR affects POPC and POPA lipid order, we sort the lipids into three bins according to their lateral distance from the protein. The distance between each lipid and the nAChR is calculated in the xy plane as
 |
(1) |
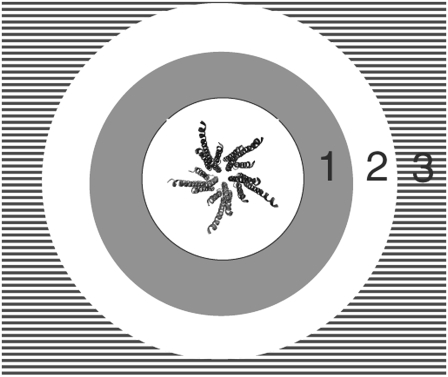
where the distance is measured between lipid atom C* (xl, yl) (Fig. 3) and all protein atoms (xp, yp). Each lipid is assigned to one of three bins (Fig. 8) based on the smallest distance in the xy plane between an individual lipid molecule and all of the protein atoms.
FIGURE 8.
A lipid molecule that has a distance in the xy plane that is <1.0 nm from the protein (depicted in the figure center) is assigned to Bin 1. If the distance between a lipid molecule and the nearest protein atom is >1.0 nm, it is assigned to Bin 2 or Bin 3. Bin distance specifications: Bin 1 (<1.0 nm), shaded; Bin 2 (1.0 nm ≤ 2.0 nm), open; and Bin 3 (2.0 nm ≤), horizontal lines.
Because the distance between the lipids and the protein changes during the 10-ns trajectory used for data analysis, we divide the trajectory into four 2-ns segment time frames (1–3 ns, 3–5 ns, 5–7 ns, and 7–9 ns). The distance between lipid atom C* and the protein atoms is recalculated for each 2-ns time segment and thus the lipids that reside in each bin are different for the four frames. The lipid and protein configurations used to calculate the distances are from the middle of each 2-ns time frame (t = 2 ns, t = 4 ns, t = 6 ns, and t = 8 ns). Since the lipids are reassigned to new bins for each 2-ns time frame, the order parameters and the bilayer thickness values are recalculated for each frame as well.
The order parameter is a useful measurement in simulations because it can be compared with the experimental deuterium order parameter, which can be determined through nuclear magnetic resonance spectroscopy measurements. Since the hydrocarbon chain structures are based on the united atom model, hydrogen atoms are not explicitly represented and the C-H bonds are reconstructed assuming tetrahedral geometry of the CH2 groups. The order parameter is defined as
 |
(2) |
where θCD is the angle between the CD-bond and the bilayer normal in experiments. In simulations, the CD-bond is replaced by the CH-bond. The order parameters are defined for carbon atoms Cn−1 through Cn+1 and thus for the sn-1 chain of the POPC and POPA lipids, the order parameters are calculated for atoms C2 through C15 (Fig. 3).
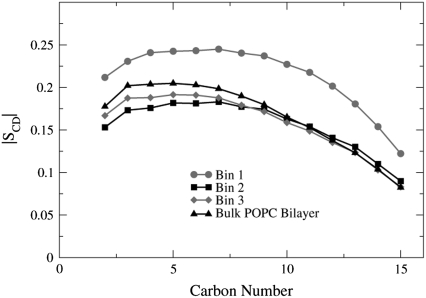
The order parameters for the POPC lipids are shown in Fig. 9. The lipids located in Bin 1 are the most ordered for atoms C2–C15 and the order parameters for the lipids in Bin 2 and Bin 3 are quite similar to the order parameter values for POPC lipids found in a homogeneous bilayer (bulk POPC bilayer) that were calculated in a previous study (22).
FIGURE 9.
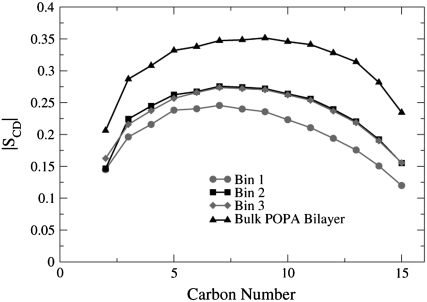
The POPC order parameter profiles for the sn-1 chains. The order parameter values are averaged over the four 2-ns time frames.
Fig. 10 shows that the order parameters for the POPA lipids in Bin 1 are the most disordered, where the POPA lipids found in a homogeneous bilayer (bulk POPA bilayer) have the largest chain order. These results show that the nAChR has an ordering effect on the POPC lipids and a disordering effect on the POPA lipids. The number of lipids whose order parameter is altered due to the presence of the nAChR differs between the two bilayers. For POPC, only the lipids that are located in Bin 1 have order parameter values that differ significantly from the bulk POPC values. However, for POPA, the lipids in all three bins have order parameter values that are smaller than those of the bulk POPA lipids.
FIGURE 10.
The POPA order parameter profiles for the sn-1 chains. The order parameter values are averaged over the four 2-ns time frames.
During the 10-ns trajectory, the average number of lipids in POPC-Bin 1 is 135 and in POPA-Bin 1 is 159. From differential scanning calorimetry thermograms, Poveda et al. estimated that between 120 and 220 dimyristoyl phosphatidic acid lipids form a microdomain around the nAChR (36). Based on this microdomain size, it is likely that the POPA lipids found in Bin 2 or Bin 3 will feel the presence of the nAChR.
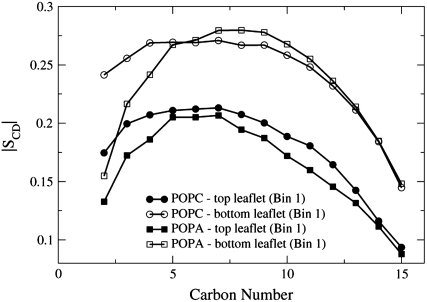
Interestingly, Fig. 11 shows that the order parameter values for the POPC and POPA Bin 1 lipids in the top leaflets have similar values for atoms C5–C15 and that the POPC and POPA Bin 1 lipids in the bottom leaflets also have similar values for those atoms.
FIGURE 11.
The order parameter profiles of the sn-1 chains for the POPC and POPA lipids found in the top and bottom leaflets in Bin 1. The order parameter values are averaged over the four 2-ns time segments.
Protein/lipid thickness matching
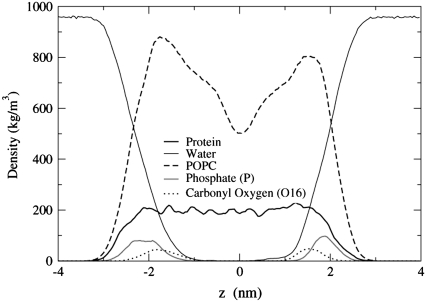
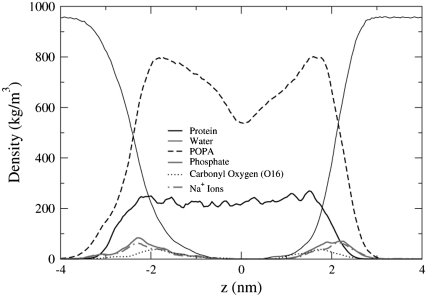
To determine the location of the ends of the transmembrane helices with respect to the lipid phosphate and ester groups, we plot the density profiles of the POPC and POPA systems in Figs. 12 and 13. Depicted in Fig. 12, the transmembrane helices reside within the hydrophobic region of the bilayer, where the length of the helices is slightly larger than the distance between the Phosphate (P) atom density profile peaks in opposing leaflets. In Fig. 13, the location of the Na+ ion density profile is very similar to that of the P atom density profiles. Hence, the likelihood of finding the Na+ ions close to the P atoms is larger than the likelihood of finding the Na+ ions near the ester oxygen atoms. The Na+ ions had a similar location with respect to the lipid headgroup atoms in a pure POPA bilayer that used the same lipid partial charges (23). Unlike the POPC system, the helices in the POPA system do not appear to be symmetrically aligned with the bilayer center.
FIGURE 12.
Density profiles for the POPC system.
FIGURE 13.
Density profiles for the POPA system.
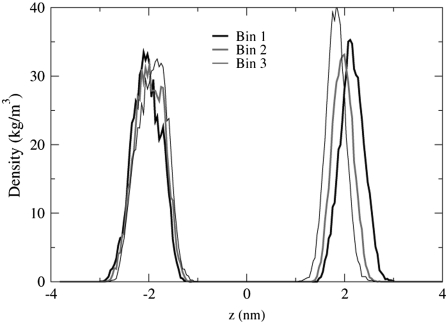
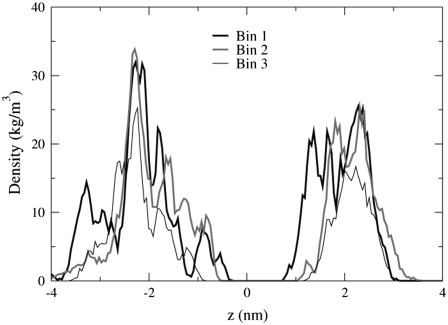
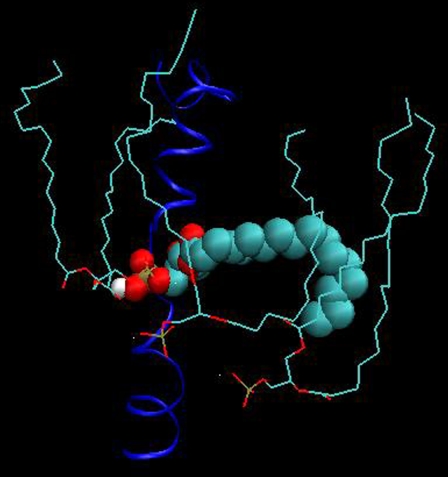
The bilayer thickness can be defined as the distance between the P atom density profile peaks of the top and bottom leaflets. The P atom density profiles shown in Figs. 14 and 15 are considerably different. The roughly parabolic shape of the density profiles in Fig. 14 indicates that the P atoms in the POPC bilayer are located in the same lateral plane. The profiles for POPA in Fig. 15, however, are very jagged and contain multiple peaks, especially for the bottom leaflet profiles (z < 0 nm). The existence of multiple peaks means that the POPA P atoms are not all located in the same lateral plane. It is quite surprising that a small peak exists in Fig. 15 from −1.14 nm to −0.32 nm, as these P atoms will be located near the bilayer center. We find that this peak is comprised of an average of 24 lipids from Bin 1 and that one lipid lies orthogonal to the bilayer normal for the entire 10-ns trajectory (Fig. 16). This lipid forms hydrogen bonds with the M4 helix of the δ-subunit. The POPC bilayer does not have a similarly positioned lipid in this location. The interactions between the POPA lipids located near the center of the δ-subunit M4 helix may contribute to the large fluctuations seen in this helix in Fig. 6. Fig. 15 also shows that the density profiles for Bin 3 appear to be more parabolic than the profiles for Bin 1, indicating that as the lipid/protein distance is increased, the likelihood of finding the POPA P atoms in the same plane increases.
FIGURE 14.
The P atom density profile peaks for the POPC bilayer. The data for this figure comes from the 1–3 ns trajectory time frame.
FIGURE 15.
The P atom density profile peaks for the POPA bilayer. The data for this figure comes from the 1–3 ns trajectory time frame.
FIGURE 16.
A snapshot of the POPA lipid that lies orthogonal to the bilayer normal and forms hydrogen bonds with the M4 helix of the δ-subunit. A similarly positioned lipid is not seen in the POPC bilayer.
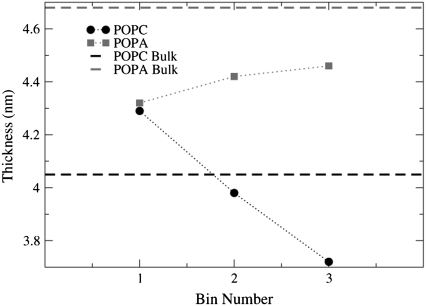
Fig. 17 shows how the bilayer thickness changes as a function of lateral distance from the nAChR and it is interesting that the POPC and POPA values are so similar for the lipids in Bin 1 (POPC = 4.29 nm, POPA = 4.33 nm). Thus, the POPC lipids in Bin 1 stretch relative to their bulk thickness of 4.05 nm and the POPA lipids in Bin 1 compress relative to their bulk thickness of 4.68 nm. The convergence of the lipids on a thickness of ∼4.29–4.33 nm implies that this must be the approximate length of the hydrophobic region of the nAChR.
FIGURE 17.
The bilayer thickness for Bins 1–3 in the POPC and POPA bilayers. The POPC and POPA lipids in Bin 1 converge on a thickness of 4.29–4.33 nm. Each data point is an average over the P atom density profile peaks for the four 2-ns trajectory time frames.
Hydrogen bonding
POPA and POPC have eight oxygen atoms that are hydrogen-bond acceptors (O7, O9, O10, O11, O14, O16, O33, and O35). POPA has one hydroxyl hydrogen atom and hence can form both intramolecular and intermolecular hydrogen bonds. POPC may also serve as a hydrogen-bond donor by lending a hydrogen atom from one of the CHn groups to a neighboring oxygen atom. However, hydrogen bonds of this type are considerably weaker than the hydrogen bonds that form between hydroxyl hydrogen atoms and lipid oxygen atoms and hence we do not consider them here (37,38). The criteria that we use for hydrogen-bond existence is that the distance between the hydrogen atom and the hydrogen-bond acceptor be <3.5 Å and the angle between the hydrogen atom, hydrogen-bond donor, and hydrogen-bond acceptor be <30° (26,27). Table 2 shows the number and location of the different hydrogen bonds that form between the POPA lipids.
TABLE 2.
The number of intramolecular and intermolecular hydrogen bonds that form between different H-bond donors and acceptors at the phosphate group (O7, O9, O10, and O11) and the ester group (O14, O16, O33, and O35) in the POPA bilayer
| H-bond acceptor location | Intramolecular H-bonds | Intermolecular H-bonds |
|---|---|---|
| Phosphate group | 0 | 167 |
| Ester group | 22 | 55 |
During the 10-ns trajectory, the largest percentage of hydrogen bonds (68%) are intermolecular, with the hydrogen-bond acceptor being located in the phosphate group. Only 9% of the hydrogen bonds are intramolecular, which is indicative of a small headgroup.
As is shown in Table 3, the number of lipid/protein hydrogen bonds that form between different H-bond donors and acceptors in the POPC and POPA systems is very similar. The most common location for a lipid/protein hydrogen bond in both bilayers is the M4 helix. Even though the M4 helices have the most extensive contact with the lipids, it has been shown using lipophilic reagents that helices M1 and M3 also have residues that face the lipids (17). This concurs with our results, where the M3 helices are the second most common hydrogen-bond formers.
TABLE 3.
The number and location of hydrogen bonds that form between different hydrogen bond donors and acceptors in the POPA and POPC bilayers
| System | Number of H-bonds | M1 (%) | M1/M2 (%) | M2 (%) | M2/M3 (%) | M3 (%) | M3/M4 (%) | M4 (%) |
|---|---|---|---|---|---|---|---|---|
| POPC | 528 | 5.3 | 1.1 | 0.2 | 19.9 | 20.6 | 9.1 | 43.8 |
| POPA | 568 | 6.7 | 0.2 | 0 | 14.1 | 20.1 | 10.4 | 48.6 |
Possible protein binding sites for these interactions include helices M1, M2, M3, and M4; connecting loops M1/M2, M2/M3; and three residues that serve as the M3/M4 connector.
CONCLUSION
For the nAChR to exist in a functional nondesensitized state, it has been found that both negatively charged lipids and cholesterol molecules should be in the protein vicinity (4). More specifically, the negatively charged lipid PA has been shown to form stable microdomains around the nAChR and PA can stabilize the nAChR in a conformation that can undergo an agonist-induced conformational change, which is not seen when PA is replaced with different negatively charged lipids (6,7). In this study, we examine how POPC and POPA lipid behavior is altered by the presence of the nAChR.
A recent simulation study examined the ternary mixture of POPC/POPA/Chol (3:1:1), where it has been found experimentally that this bilayer composition promotes a functional nAChR (35). The simulations showed that POPA-Chol interactions seemed more favorable than POPC-Chol interactions and it was 1.5 times more favorable for hydrogen bonds to form between POPA and Chol than POPC and Chol (39). Jones and McNamee suggested that cholesterol molecules bind at nonannular sites along the nAChR surface, whereas phospholipids bind at annular sites (3). As we saw in Fig. 6, the β- and δ-subunits of the nAChR have larger RMSF values in the POPA bilayer than in the POPC bilayer. Since large fluctuations are not seen in the POPC bilayer or the other three subunits in the POPA bilayer, this indicates that the slight compositional differences between the β- and δ-subunits and the α- and γ-subunits are significant in terms of the protein/lipid interactions. We found that a small group of POPA lipids form hydrogen bonds with the middle of the δ-M4 helix. This is an unexpected location for a POPA headgroup and the interactions between the lipids and the protein may cause fluctuations in the M4 helix. Since the most likely binding location for cholesterol molecules is the protein/lipid interface, it is possible that nonannular binding sites exist near the M3 and M4 helices in the β- and δ-subunits and that cholesterol molecules would increase helix stabilization.
Addition of the nAChR to a PC/PA/cholesterol mixture resulted in the formation of a PA microdomain around the protein (36). Domain formation, however, was not observed when the PA lipid was replaced with either phosphatidylglycerol or phosphatidylserine (36). To determine which PA lipid properties are instrumental in domain formation, we calculated the lipid order parameters, where the lipids were classified into three groups based on their lateral distance in the xy plane from the protein. For lipids whose distance was <1 nm from the protein, the POPC and POPA lipids in the top leaflet and the POPC and POPA lipids in the bottom leaflet had very similar order parameter values. This indicates that the nAChR dictates annular lipid order. Annular lipid conformity near a transmembrane protein has also been reported in a simulation of the bacteriorhodopsin trimer in a bilayer of diphytanoyl phosphatidyl glycerophosphate, where the lipid molecules near the protein surface behaved more like the protein than lipids in the fluid phase (5,40). There was a significant difference, however, in order parameter values for the POPC and POPA lipids whose lateral distance was >1.0 nm from the protein. POPC lipids that were >1.0 nm from the protein had order parameter values that were very similar to those found in a pure lipid bilayer and thus were significantly less ordered than those lipids that were within 1.0 nm from the protein surface. In the presence of the nAChR, the POPA lipids were less ordered than lipids found in a pure POPA bilayer and all of the lipids had similar order parameter values, regardless of their distance from the protein surface. This similarity in POPA lipid behavior hints at the formation of a POPA microdomain around the protein.
In examining the location of the protein transmembrane region with respect to the hydrophobic core of the bilayer, we found that the helices were centered in the POPC bilayer, but shifted toward the bottom leaflet in the POPA bilayer. The density profiles of the P atoms in the POPA bilayer showed that the POPA lipid headgroups do not all reside in the same lateral plane. The likelihood of finding POPA lipids in multiple planes, however, decreased as the lateral distance between the lipid and the protein increased. daCosta et al. found that incorporation of the nAChR into bilayers that contain PA lipids increased the transition temperature and increased the membrane order (35). As can be seen in Fig. 10, the lipids in a pure POPA bilayer already have high order in their acyl chains. Hence, as was seen experimentally, inclusion of the nAChR into the bilayer should increase lipid packing. However, it appears that some of the lipids attempt to elude this increase in packing by shifting into alternate planes. In a simulation study of a coarse-grained bilayer on a solid support, Xing and Faller found that the choline groups in the leaflet closest to the support separated into two planes in response to interactions between the lipids and the support, which increased lipid packing (41). Thus, it appears that the lipids decrease in order compared to the pure POPA bilayer upon nAChR addition because the lipids attempt to increase the free space in their vicinity by residing in multiple lateral planes.
The most significant difference that we observe between the POPC and POPA bilayers in the presence of the nAChR is the formation of a POPA domain around the protein, which is not visible in the POPC bilayer. For lipids that are <1.0 nm from the protein, both the POPC and the POPA lipids show very similar order parameter values and bilayer thicknesses, indicating that the properties of the annular lipids are protein-dependent. Since POPA lipids have been linked in many experimental studies to a functional nAChR, it is possible that the POPA microdomain helps to stabilize the functional nAChR resting state.
Acknowledgments
This work was supported by National Institutes of Health-National Institute of General Medical Sciences through grant No. T32-GM08799. We gratefully acknowledge computer time at the Texas Advanced Computer Center (grant No. TG-MCB070076N). R.F. also acknowledges a generous endowment by Joe and Essie Smith.
Editor: Gregory A. Voth.
References
- 1.Unwin, N. 2005. Refined structure of the nicotinic acetylcholine receptor at 4 Å resolution. J. Mol. Biol. 346:967–989. [DOI] [PubMed] [Google Scholar]
- 2.Lee, A. G. 2004. How lipids affect the activities of integral membrane proteins. Biochim. Biophys. Acta. 1666:62–87. [DOI] [PubMed] [Google Scholar]
- 3.Jones, O. T., and M. G. McNamee. 1988. Annular and nonannular binding sites for cholesterol associated with the nicotinic acetylcholine receptor. Biochemistry. 27:2364–2374. [DOI] [PubMed] [Google Scholar]
- 4.Fong, T. M., and M. G. McNamee. 1986. Correlation between acetylcholine receptor function and structural properties of membranes. Biochemistry. 25:830–840. [DOI] [PubMed] [Google Scholar]
- 5.Lee, A. G. 2003. Lipid-protein interactions in biological membranes: a structural perspective. Biochim. Biophys. Acta. 1612:1–40. [DOI] [PubMed] [Google Scholar]
- 6.daCosta, C. J. B., I. D. Wagg, M. E. McKay, and J. E. Baenziger. 2004. Phosphatidic acid and phosphatidylserine have distinct structural and functional interactions with the nicotinic acetylcholine receptor. J. Biol. Chem. 279:14967. [DOI] [PubMed] [Google Scholar]
- 7.Wenz, J. J., and F. J. Barrantes. 2005. Nicotinic acetylcholine receptor induces lateral segregation of phosphatidic acid and phosphatidylcholine in reconstituted membranes. Biochemistry. 44:398–410. [DOI] [PubMed] [Google Scholar]
- 8.Antollini, S., and F. J. Barrantes. 2002. Unique effects of different fatty acid species on the physical properties of the Torpedo acetylcholine receptor membrane. J. Biol. Chem. 277:1249–1254. [DOI] [PubMed] [Google Scholar]
- 9.Kooijman, E. E., V. Chupin, N. L. Fuller, M. M. Kozlov, B. deKruijff, K. N. J. Burger, and P. R. Rand. 2005. Spontaneous curvature of phosphatidic acid and lysophosphatidic acid. Biochemistry. 44:2097–2102. [DOI] [PubMed] [Google Scholar]
- 10.Killian, J., B. de Kruijff, and E. van den Brink-van der Laan. 2004. Nonbilayer lipids affect peripheral and integral membrane proteins via changes in the lateral pressure profile. Biochim. Biophys. Acta. 1666:275–288. [DOI] [PubMed] [Google Scholar]
- 11.Hung, A., K. Tai, and M. S. P. Sansom. 2005. Molecular dynamics simulations of the M2 helices within the nicotinic acetylcholine receptor transmembrane domain: structure and collective motions. Biophys. J. 88:3321–3333. [DOI] [PMC free article] [PubMed] [Google Scholar]
- 12.Saiz, L., and M. L. Klein. 2005. The transmembrane domain of the acetylcholine receptor: insights from simulations on synthetic peptide models. Biophys. J. 88:959–970. [DOI] [PMC free article] [PubMed] [Google Scholar]
- 13.Saladino, A. C., Y. Xu, and P. Tang. 2005. Homology modeling and molecular dynamics simulations of transmembrane domain structure of human neuronal nicotinic acetylcholine receptor. Biophys. J. 88:1009–1017. [DOI] [PMC free article] [PubMed] [Google Scholar]
- 14.Xu, Y., F. J. Barrantes, X. Luo, K. Chen, J. Shen, and H. Jiang. 2005. Conformational dynamics of the nicotinic acetylcholine receptor channel: a 35-ns molecular dynamics simulation study. J. Am. Chem. Soc. 127:1291–1299. [DOI] [PubMed] [Google Scholar]
- 15.Xu, Y., F. J. Barrantes, J. Shen, X. Luo, W. Zhu, K. Chen, and H. Jiang. 2006. Blocking of the nicotinic acetylcholine receptor ion channel by chlorpromazine, a noncompetitive inhibitor: a molecular dynamics simulation study. J. Phys. Chem. B. 110:20640–20648. [DOI] [PubMed] [Google Scholar]
- 16.Berman, H. M., J. Westbrook, Z. Feng, G. Gilliland, T. N. Bhat, H. Weissig, I. N. Shindyalov, and P. E. Bourne. 2000. The Protein Data Bank. Nucleic Acids Res. 28:235–242. [DOI] [PMC free article] [PubMed] [Google Scholar]
- 17.Miyazawa, A., Y. Fujiyoshi, and N. Unwin. 2003. Structure and gating mechanism of the acetylcholine receptor pore. Nature. 423:949–955. [DOI] [PubMed] [Google Scholar]
- 18.Kandt, C., W. L. Ash, and D. P. Tieleman. 2007. Setting up and running molecular dynamics simulations of membrane proteins. Methods. 41:475–488. [DOI] [PubMed] [Google Scholar]
- 19.Berger, O., O. Edholm, and F. Jahnig. 1997. Molecular dynamics simulations of a fluid bilayer of dipalmitoylphosphatidylcholine at full hydration, constant pressure, and constant temperature. Biophys. J. 72:2002–2013. [DOI] [PMC free article] [PubMed] [Google Scholar]
- 20.van Gunsteren, W. F., P. Kruger, S. R. Billeter, A. E. Mark, A. A. Eising, W. R. P. Scott, P. H. Huneberg, and I. G. Tironi. 1996. Biomolecular Simulation: The GROMOS 96 Manual and User Guide. Hochschulverlag AG, Zürich, Switzerland.
- 21.Berendsen, H. J. C., J. P. M. Postma, W. F. van Gunsteren, and J. Hermans. 1981. Interaction models for water in relation to protein hydration. In Intermolecular Forces. B. Pullman, editor. Reidel, Dordrecht, The Netherlands.
- 22.Frisch, M. J., G. W. Trucks, H. B. Schlegel, G. E. Scuseria, M. A. Robb, J. R. Cheeseman, J. A. Montgomery, Jr., T. Vreven, K. N. Kudin, J. C. Burant, J. M. Millam, S. S. Iyengar, J. Tomasi, V. Barone, B. Mennucci, M. Cossi, G. Scalmani, N. Rega, G. A. Petersson, H. Nakatsuji, M. Hada, M. Ehara, K. Toyota, R. Fukuda, J. Hasegawa, M. Ishida, T. Nakajima, Y. Honda, O. Kitao, H. Nakai, M. Klene, X. Li, J. E. Knox, H. P. Hratchian, J. B. Cross, V. Bakken, C. Adamo, J. Jaramillo, R. Gomperts, R. E. Stratmann, O. Yazyev, A. J. Austin, R. Cammi, C. Pomelli, J. W. Ochterski, P. Y. Ayala, K. Morokuma, G. A. Voth, P. Salvador, J. J. Dannenberg, V. G. Zakrzewski, S. Dapprich, A. D. Daniels, M. C. Strain, O. Farkas, D. K. Malick, A. D. Rabuck, K. Raghavachari, J. B. Foresman, J. V. Ortiz, Q. Cui, A. G. Baboul, S. Clifford, J. Cioslowski, B. B. Stefanov, G. Liu, A. Liashenko, P. Piskorz, I. Komaromi, R. L. Martin, D. J. Fox, T. Keith, M. A. Al-Laham, C. Y. Peng, A. Nanayakkara, M. Challacombe, P. M. W. Gill, B. Johnson, W. Chen, M. W. Wong, J. L. Andres, C. Gonzalez, M. Head-Gordon, E. S. Replogle, and J. A. Pople. Gaussian 03, Rev. C.02. 2004. Gaussian, Inc., Wallingford, CT.
- 23.Dickey, A. N., and R. Faller. 2008. Examining the contributions of lipid shape and headgroup charge on bilayer behavior. Biophys. J. 95:2636–2646. [DOI] [PMC free article] [PubMed] [Google Scholar]
- 24.Daura, X., A. E. Mark, and W. F. van Gunsteren. 1998. Parameterization of aliphatic CHn united atoms of GROMOS96 force field. J. Comput. Chem. 19:535–547. [Google Scholar]
- 25.Schuler, L. D., and W. F. van Gunsteren. 2000. On the choice of dihedral angle potential energy functions for n-alkanes. Mol. Simul. 25:301–319. [Google Scholar]
- 26.Lindahl, E., B. Hess, and D. van der Spoel. 2001. GROMACS 3.0: a package for molecular simulation and trajectory analysis. J. Mol. Model. 7:306–317. [Google Scholar]
- 27.Berendsen, H. J. C., D. van der Spoel, and R. van Drunen. 1995. GROMACS: a message-passing parallel molecular dynamics implementation. Comput. Phys. Commun. 91:43–56. [Google Scholar]
- 28.van der Spoel, D., E. Lindahl, B. Hess, G. Groenhof, A. E. Mark, and H. J. C. Berendsen. 2005. GROMACS: fast, flexible and free. J. Comput. Chem. 26:1701–1718. [DOI] [PubMed] [Google Scholar]
- 29.Demel, R. A., C. C. Yin, B. Z. Lin, and H. Hauser. 1992. Monolayer characteristics and thermal behavior of phosphatidic acids. Chem. Phys. Lipids. 60:209–223. [DOI] [PubMed] [Google Scholar]
- 30.Seelig, J., and N. Waespe-Sarcevic. 1978. Molecular order in cis and trans unsaturated phospholipid bilayers. Biochemistry. 17:3310–3315. [DOI] [PubMed] [Google Scholar]
- 31.Berendsen, H. J. C., J. P. M. Postma, W. F. van Gunsteren, A. DiNola, and J. R. Haak. 1984. Molecular dynamics with coupling to an external bath. J. Chem. Phys. 81:3684–3690. [Google Scholar]
- 32.Hess, B., H. Bekker, H. J. C. Berendsen, and J. G. E. M. Fraaije. 1997. LINCS: a linear constraint solver for molecular simulations. J. Comput. Chem. 18:1463–1472. [Google Scholar]
- 33.Essman, U., L. Perela, M. L. Berkowitz, H. L. T. Darden, and L. G. Pedersen. 1995. A smooth particle mesh Ewald method. J. Chem. Phys. 103:8577–8592. [Google Scholar]
- 34.Vemparala, S., L. Saiz, R. G. Eckenhoff, and M. L. Klein. 2006. Partitioning of anesthetics into a lipid bilayer and their interaction with membrane-bound peptide bundles. Biophys. J. 91:2815–2825. [DOI] [PMC free article] [PubMed] [Google Scholar]
- 35.daCosta, C. J. B., A. A. Ogrel, E. A. McCardy, M. P. Blanton, and J. E. Baezinger. 2002. Lipid-protein interactions at the nicotinic acetylcholine receptor. J. Biol. Chem. 277:201–208. [DOI] [PubMed] [Google Scholar]
- 36.Poveda, J. A., J. A. Encinar, A. M. Fernandez, C. R. Mateo, J. A. Ferragut, and J. M. Gonzalez-Ros. 2002. Segregation of phosphatidic acid-rich domains in reconstituted acetylcholine receptor membranes. Biochemistry. 41:12253–12262. [DOI] [PubMed] [Google Scholar]
- 37.Gu, Y., T. Kar, and S. Scheiner. 1999. Fundamental properties of the CH-O interaction: is it a true hydrogen bond? J. Am. Chem. Soc. 121:9411–9422. [Google Scholar]
- 38.Pandit, S. A., D. Bostick, and M. L. Berkowitz. 2003. Mixed bilayer containing dipalmitoylphosphatidylcholine and dipalmitoylphosphatidylserine: lipid complexation, ion binding, and electrostatics. Biophys. J. 85:3120–3131. [DOI] [PMC free article] [PubMed] [Google Scholar]
- 39.Cheng, M. H., L. T. Liu, A. C. Saladino, Y. Xu, and P. Tang. 2007. Molecular dynamics simulations of ternary membrane mixture: phosphatidylcholine, phosphatidic acid, and cholesterol. J. Phys. Chem. B. 111:14186–14192. [DOI] [PMC free article] [PubMed] [Google Scholar]
- 40.Edholm, O., O. Berger, and F. Jahnig. 1995. Structure and fluctuations of bacteriorhodopsin in the purple membrane—a molecular-dynamics study. J. Mol. Biol. 250:94–111. [DOI] [PubMed] [Google Scholar]
- 41.Xing, C., and R. Faller. 2008. Interactions of lipid bilayers with supports: a coarse-grained molecular simulation study. J. Phys. Chem. B. 112:7086–7094. [DOI] [PubMed] [Google Scholar]


