

Abstract
Dual energy x ray absorptiometry (DXA) scans to measure bone mineral density (BMD) at the spine and hip have an important role in the evaluation of individuals at risk of osteoporosis, and in helping clinicians advise patients about the appropriate use of antifracture treatment. Compared with alternative bone densitometry techniques, hip and spine DXA examinations have a number of advantages that include a consensus that BMD results can be interpreted using the World Health Organization T‐score definition of osteoporosis, a proven ability to predict fracture risk, proven effectiveness at targeting antifracture therapies, and the ability to monitor response to treatment. This review discusses the evidence for these and other clinical aspects of DXA scanning, including its role in the new WHO algorithm for treating patients on the basis of their individual fracture risk.
Osteoporosis is widely recognised as an important public health problem because of the significant morbidity, mortality and costs associated with its complications—namely, fractures of the hip, spine, forearm and other skeletal sites.1 The incidence of fragility fractures is highest among elderly white women, with one in every two women suffering an osteoporosis related fracture in their lifetime.2 Each year in the UK an estimated 260 000 osteoporotic fractures occur among women aged 50 years and over, including over 70 000 cases of hip fracture.3,4 Attention is often focused on hip fractures, especially because they incur the greatest morbidity and medical costs for health services.5 However, fractures at other sites are also associated with significant morbidity and costs,6 and both hip and vertebral fractures are associated with an increased risk of death,7,8 and increased dependence on care services for the basic activities of daily living. In the year 2000 the total annual cost to the National Health Service of treating osteoporotic fractures was estimated to be £1.5 billion (€2.4 billion, $3 billion).5,9 By the year 2020 it is projected that the UK population aged over 85 years will double from 1.2 million to 2.1 million, so the prevention of fragility fractures will assume increasing importance.10
Although for many years there was awareness of the morbidity and mortality associated with fragility fractures, real progress only came with the ability to diagnose osteoporosis before fractures occur and with the development of effective treatments. Measurements of bone mineral density (BMD) played a crucial role in both these developments. Until the mid 1980s bone density measurements were used mainly for research, and it was only with the introduction of dual‐energy x ray absorptiometry (DXA) scanners in 1987 that they entered routine clinical practice.11 Further milestones included the first publication showing that bisphosphonate treatment prevents bone loss,12 the publication of the World Health Organization report defining osteoporosis in postmenopausal white women as a BMD T‐score at the spine, hip or forearm of −2.5 or less,13,14 and the Fracture Intervention Trial confirming that bisphosphonate treatment can prevent fractures.15 Since then a number of large trials have provided evidence of the effectiveness of bisphosphonates (BPs),16,17,18,19,20 selective oestrogen receptor modulators (SERMs),21 recombinant human parathyroid hormone (PTH)22 and strontium ranelate23,24,25 in the prevention of fragility fractures.
CLINICAL ROLE OF BONE DENSITY MEASUREMENTS
Today, BMD measurements have an important role in the evaluation of patients at risk of osteoporosis and in the appropriate use of antifracture treatment.14,26,27 In general the preferred method of testing is to use DXA scans of the central skeleton to measure BMD of the lumbar spine and hip. Central DXA examinations have three major roles, namely the diagnosis of osteoporosis, the assessment of patients' risk of fracture, and monitoring response to treatment. The reasons for preferring to use central DXA include: the fact that the hip BMD is the most reliable measurement for predicting hip fracture risk28,29,30; the use of the spine for monitoring treatment31,32; and the consensus that spine and hip BMD measurements in postmenopausal white women should be interpreted using the WHO T‐score definitions of osteoporosis and osteopenia (table 1).14,26,27
Table 1 The World Health Organization definitions of osteoporosis and osteopenia used to interpret spine, hip and forearm dual‐energy x ray absorptiometry (DXA) scan results in postmenopausal white women13,14.
| Terminology | T‐score definition |
|---|---|
| Normal | T ⩾ −1.0 |
| Osteopenia | −2.5 < T < −1.0 |
| Osteoporosis | T ⩽ −2.5 |
| Established osteoporosis | T ⩽ −2.5 in the presence of one or more fragility fractures |
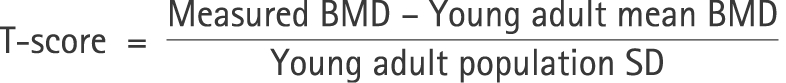
T‐scores are calculated by taking the difference between a patient's measured BMD and the mean BMD in healthy young adults, matched for gender and ethnic group, and expressing the difference relative to the young adult population standard deviation (SD):
 |
Other important advantages of DXA include short scan times, easy set up of patients for scanning, low radiation dose and good measurement precision. These and other advantages of central DXA are summarised in box 1 and are discussed further below.
Box 1: Advantages of central DXA
Consensus that bone mineral density results can be interpreted using WHO T‐scores
Proven ability to predict fracture risk
Basis of new WHO algorithm for predicting fracture risk
Proven for effective targeting of antifracture treatments
Good precision
Effective at monitoring response to treatment
Acceptable accuracy
Stable calibration
Effective instrument quality control procedures
Short scan times
Rapid patient set up
Low radiation dose
Availability of reliable reference ranges
In addition to central DXA systems for measuring the spine and hip, a wide variety of other types of bone densitometry measurements are also available.11,33 These include quantitative computed tomography (QCT) measurements of the spine and hip,34,35 peripheral DXA (pDXA) systems for measuring the forearm, heel or hand,36 and quantitative ultrasound (QUS) devices for measurements of the heel and other peripheral sites.37 In principle, pDXA and QUS devices offer a quick, cheap and convenient method of evaluating skeletal status that makes them attractive for wider use. In practice, however, these alternative types of measurement correlate poorly with central DXA, with correlation coefficients in the range r = 0.5 to 0.65.38 The lack of agreement with central DXA has proved a barrier to reaching a consensus on the use of these other methods.38,39
WHICH MEASUREMENT IS BEST?
Given the choice of several different types of measurement, how do we decide which technique is the most effective? Fundamental to the clinical use of BMD measurements is their ability to predict fracture risk, and the most reliable way to evaluate and compare different techniques is through prospective studies of incident fractures.28 Figure 1 illustrates how data from a fracture study are analysed to quantify the relationship between BMD and fracture risk. When the baseline BMD values are used to divide patients into quartiles, an inverse relationship is found between fracture risk and BMD. To describe this relationship the BMD measurements are first converted into Z‐scores. Z‐scores are similar to T‐scores except that instead of comparing the patient's BMD with the young adult mean, it is compared with the mean BMD expected for the patient's peers (for example, for a healthy normal subject matched for age, gender and ethnic group):

Figure 1 Incidence of hip fracture risk by bone mineral density (BMD) quartile for femoral neck BMD. Data are taken from the 2‐year follow‐up of the Study of Osteoporotic Fractures (SOF).41 Inset diagram: data from fractures studies are fitted using a gradient‐of‐risk model, in which the fracture risk varies exponentially with Z‐score with gradient β. Results are expressed in terms of the relative risk (RR), the increased risk of fracture for each unit decrease in Z‐score. The value of RR is found from β using the exponential function (RR = exp(β)). Alternatively, the gradient of risk is found by taking the natural logarithm of RR (β = ln(RR)).
Data from fracture studies are fitted using a gradient‐of‐risk model in which the fracture risk increases exponentially with decreasing Z‐score with gradient β (fig 1, inset). Results are usually expressed in terms of the relative risk (RR), which is defined as the increased risk of fracture for each unit decrease in Z‐score.
The larger the value of RR (or equivalently, the steeper the gradient‐of‐risk in fig 1), the more effective a technique is at discriminating between patients who will suffer a future fracture and those who will not. To understand the reason for this, consider a large group of subjects chosen randomly from the general population. For such a group the distribution of Z‐score values approximates to a Gaussian curve (fig 2A). The distribution of Z‐score values for the group of patients who will at some future date experience an osteoporotic fracture is found by multiplying the Gaussian curve representing the general population by the gradient‐of‐risk curve shown in the inset to fig 1. When this is done the distribution of Z‐score values for the fracture population is found to be a second Gaussian curve with the same SD as the first, but with its peak offset to the left by an amount ΔZ equal to the gradient‐of‐risk β (or equivalent to the natural logarithm of the relative risk) [ΔZ = β = ln(RR)] (fig 2A).40

Figure 2 (A) Distribution of Z‐score values in a fracture population compared with the age‐matched general population. The curve for the general population is a bell‐shaped curve symmetrically distributed around its peak at Z = 0. The corresponding curve for the population of patients who will suffer an osteoporotic fracture is a similar bell‐shaped curve that is offset from the general population by a Z‐score difference of ΔZ = ln(RR), where RR = relative risk. The inset table lists values of RR and ΔZ. (B) Plot of the receiver operating characteristic (ROC) curves obtained by evaluating the areas under the two bell‐shaped curves shown in fig 2A up to an arbitrarily chosen Z‐score threshold and plotting the two areas against each other for different values of the relative risk (RR). The ROC curve shows the percentage of fracture cases who fall below the bone mineral density (BMD) threshold (shaded area under the fracture population curve in fig 2A) plotted against the percentage of subjects in the general population who fall below the same threshold (shaded area under the general population curve in fig 2A). It therefore shows the true positive fraction (those patients who sustain a fracture and were correctly identified as being at risk) against the false positive fraction (those patients identified as being at risk but who never actually have a fracture). The larger the value of RR the wider the separation of the two curves in Fig 2A and the more effective BMD measurements are at discriminating the patients who will have a fracture. For example, if patients in the lowest quartile of BMD are identified for treatment, then for RR values of 1.5, 2.0, 2.5 and 3.0 this group will include 39%, 51%, 60% and 66%, respectively, of all patients who will suffer a fracture.
To understand the importance of choosing a technique with a high RR value, consider choosing some arbitrary Z‐score value in fig 2A as the threshold for making decisions about patients' treatment (for example, this might be the Z‐score value equivalent to a T‐score of −2.5). The areas under the two curves can be evaluated to find the percentages of patients in the fracture population and the general population with Z‐score results below the chosen threshold. As the threshold is varied and the two percentages plotted against each other we obtain a receiver operating characteristic (ROC) curve (fig 2B) in which the percentage of true positives (those patients who will suffer a fracture in the future and were correctly identified to be at risk) is plotted against the percentage of false positives (those patients identified to be at risk but who never have a fracture). Fig 2B is fundamental for understanding the clinical value of any type of bone density measurement used to identify and treat patients at risk of fracture. It shows that the larger the RR value of the measurement technique the more successful clinicians are at identifying and treating those patients who are at greatest risk of having a fracture.
DATA FROM FRACTURE STUDIES
One of the important clinical advantages of central DXA compared with other types of bone density measurements is that its ability to identify patients at risk of fracture has been assessed and proven in a large number of epidemiological studies.28 Among the most informative of these is the Study of Osteoporotic Fractures (SOF), a study conducted in the United States of 9704 white women aged 65 years and over who had baseline measurements of hip, spine, forearm and heel BMD when the study commenced in the late 1980s.29 The recently published SOF 10‐year follow up data confirm the association between BMD and fracture risk with high statistical reliability for many types of fracture; the data show that the prediction of hip fracture risk from a hip BMD measurement has the largest RR value and is the most effective type of DXA examination (fig 3).29 Another recent study of the relationship between hip fracture and hip BMD based on a meta‐analysis of 12 different fracture studies from Canada, Europe, Japan and Australia found similar RR values to the SOF study in both men and women.30

Figure 3 Values of the relative risk (RR) (defined as the increased risk of fracture for a 1 SD decrease in bone mineral density (BMD)) for fractures at different skeletal sites (wrist, hip, spine and any fracture) for BMD measurements made at four different sites (forearm, heel, spine and femoral neck). The errors bars show the 95% confidence intervals. Data are taken from the 10‐year follow‐up of the Study of Osteoporotic Fractures (SOF) study population.29 In the SOF data the largest value of RR is for the prediction of hip fracture risk from a hip BMD measurement (RR = 2.4). From the ROC curves shown in fig 2B this means that the clinically most effective DXA scan measurement is to use hip BMD to predict hip fracture risk.
One of the strengths of the SOF study is the large number of recorded fracture cases. In order to make meaningful comparisons between different bone densitometry techniques it is essential to have large studies that include several hundred fracture cases to achieve adequate statistical power. This is illustrated in fig 4, which shows RR values from a number of studies with their 95% confidence intervals and the number of hip fractures included in the study. As the SOF study has progressed the results have consistently confirmed the ability of hip BMD measurements to predict hip fracture risk with an RR value of around 2.5, but the statistical errors have decreased as the number of fractures has increased with time, until the most recent 10‐year analysis was based on over 650 hip fractures (fig 4).29,41,42

Figure 4 Values of the relative risk (RR) (defined as the increased risk of fracture for a 1 SD decease in bone mineral density (BMD)) for hip fracture for: (1) hip dual‐energy x ray absorptiometry (DXA) measurements (Study of Osteoporotic Fractures (SOF) 2 year study,41 5 year study,42 and 10 year study29); (2) quantitative computed tomography (QCT) and DXA hip BMD measurements (Osteoporotic Fractures in Men Study (MrOS)43); (3) water based heel quantitative ultrasound (QUS) measurements (SOF 2 year study,44 EPIDOS study,45 SOF 5 year study,42 and the Woodhouse meta‐analysis46); and (4) dry heel QUS measurements (Amsterdam study,47 EPIC study,48 NORA study49 and SOF study50). The errors bars show the 95% confidence intervals. The vertical dashed line at RR = 1.0 shows the figure at which there is no fracture discrimination. The number beside each data point shows the number of hip fractures in the study. The graph illustrates the importance of having a large number of fractures in order to reduce the error bars and make a meaningful comparison between different bone densitometry techniques.
Also shown in fig 4 are the first results of a prospective study of QCT and fracture risk.43 The Osteoporotic Fractures in Men (MrOS) study enrolled 5995 white men aged 65 and over from six US centres. As well as baseline DXA scans, 3357 men had spine and hip QCT scans. The first results based on 36 hip fracture cases recorded after an average follow up period of 4.4 years show comparable RR values for femoral neck BMD measured by QCT or DXA (fig 4). However, because of the small number of fracture cases so far recorded the statistical errors are still too large to make any meaningful comparison between QCT and DXA.
The other data plotted in fig 4 are results for water based42,44,45,46 and dry heel QUS devices47,48,49,50 to predict hip fracture risk. Although widely believed to be as effective as central DXA at predicting hip fracture risk, it is notable that the more widely cited QUS studies were based on relatively small numbers of fracture cases,44,45,48 while later results obtained with larger numbers of fractures have frequently given less favourable findings.42,46,50
APPROPRIATE TARGETING OF ANTIFRACTURE TREATMENTS
Another advantage of central DXA is its proven ability to identify patients who will respond successfully to pharmaceutical treatments for preventing osteoporotic fractures. Table 2 lists the principal clinical trials of the agents proven to prevent vertebral and/or non‐vertebral fractures.15,16,17,18,19,20,21,22,23,24 It is notable that all the trials listed enrolled patients on the basis of study entry criteria that included a DXA scan T‐score at the spine or hip demonstrating either osteoporosis or severe osteopenia. In a number of these trials the data analysis showed that the treatment was effective only in those subjects with a hip or spine T‐score of −2.5 or less.16,18,19,24 These findings have created a problem in selecting patients for treatment using techniques other than central DXA because of the poor correlation between different techniques and the lack of evidence that individuals selected using other techniques will respond to treatment.51
Table 2 Fracture prevention studies that have selected patients using central DXA.
| Class of agent | Name of drug | Study name | T‐score thresholds for patient enrolment* |
|---|---|---|---|
| Bisphosphonate | Alendronate | FIT 115 | Femoral neck T‐score < −1.5† |
| FIT 216 | Femoral neck T‐score < −1.5 | ||
| Risedronate | VERT NA17 | Spine T‐score < −2† | |
| HIP18 | Femoral neck T‐score < −3.2‡ | ||
| Ibandronate | BONE19 | Spine T‐score in range −2 to −5† | |
| Zoledronate | HORIZON20 | Femoral neck T‐score < −2.5† | |
| Selective estrogen receptor modulator | Raloxifene | MORE21 | Spine or femoral neck T‐score < −1.8† |
| Parathyroid hormone | PTH (1‐34) | Neer study22 | Spine or femoral neck T‐score < −1† |
| Strontium | Strontium ranelate | SOTI23 | Spine T‐score < −1.9† |
| TROPOS24 | Femoral neck T‐score < −2.2 |
BONE, Oral Ibandronate Osteoporosis vertebral fracture trial in North America and Europe; FIT, Fracture Intervention Trial; HIP, Risedronate Hip Study; HORIZON, HORIZON Pivotal Fracture Trial; MORE, Multiple Outcomes of Raloxifene Evaluation; SOTI, Spinal Osteoporosis Therapeutic Intervention; TROPOS, Treatment of Peripheral Osteoporosis; VERT NA, Vertebral Efficacy with Risedronate Therapy (North America) study
*T‐score thresholds are those calculated using the NHANES III reference range for the hip and the Hologic reference range for spine BMD.52
†Study entry criteria also included prevalent vertebral fractures.
‡Study entry criteria also included clinical risk factors.
AVAILABILITY OF RELIABLE REFERENCE RANGES
Over the last 10 years the interpretation of DXA scans has been guided by the WHO T‐score definition of osteoporosis (table 1). However, care is necessary in the choice of reference data for the calculation of T‐score values if scan results are to be interpreted reliably. For consistency, many guidelines on patient treatment recommend the use of the Third National Health and Nutrition Examination Survey (NHANES III) reference database for T‐score derivation in the hip.52 This recommendation was made following the publication of a study comparing the spine and hip T‐score results obtained on the two principal brands of DXA scanner (manufactured by GE‐Lunar and Hologic) and calculated using the manufacturers' reference ranges.53 Although good agreement was found for spine T‐scores measured on the two manufacturers' systems, a systematic difference of almost one T‐score unit was found between the femoral neck T‐scores. The discrepancy was reconciled by both manufacturers agreeing to adopt the hip reference range derived from the NHANES study,54 which is based on measurements of over 14 000 randomly selected men and women from across the whole of the United States. Unfortunately there was insufficient time in the NHANES study to measure spine BMD as well as the hip, so spine DXA results are usually interpreted using the manufacturers' reference data.
Comparison of the reference ranges from different manufacturers for the same measurement site can show surprisingly large differences in the plots of mean T‐score against age due to factors that include the use of inappropriate populations, different conventions for deriving the reference curve from the data, and insufficient numbers of subjects for statistical reliability.55 The adoption by all the principal DXA manufacturers of the NHANES hip BMD reference range with its large, randomly selected population has therefore been important in providing confidence in the interpretation of scan results.
INTERPRETATION OF T‐SCORES USING THE WHO CRITERIA
As explained above, one of the advantages of central DXA is the widespread consensus that spine, hip and forearm BMD measurements should be interpreted using the WHO T‐score definition of osteoporosis (table 1). The WHO definition should not be used for interpreting QCT or QUS measurements, or pDXA results at sites other than the 33% radius.56 The reason why this rule is so important can be understood from fig 5. When the reference ranges for different types of bone density measurement are plotted as graphs of mean T‐score against age, the curves obtained are found to be quite different for different techniques. For example, the curve for spine QCT decreases relatively quickly with age and crosses the WHO threshold of T = −2.5 at age 60 (fig 5). This means that if we were to interpret QCT measurements using the WHO criteria we would find that 50% of 60‐year‐old women had osteoporosis. In contrast, for some types of heel pDXA and QUS devices the curve decreases relatively slowly with age such that patients would need to reach age 100 before 50% of them were found to have osteoporosis. For spine, femoral neck and 33% radius DXA measurements the three curves decrease in a similar manner with age, crossing the T = −2.5 threshold at age 75.

Figure 5 Age related decline in mean T‐scores at different bone mineral density sites for healthy white female subjects. The hip dual‐energy x ray absorptiometry (DXA) data are taken from the NHANES study.52,54 The DXA normative data for the PA spine (L1–L4) and forearm (total forearm region) were obtained from the Hologic reference ranges. Heel data are for the GE‐Lunar PIXI pDXA device. Spinal quantitative computed tomography (QCT) is that used by the Image Analysis reference system.
It is clear that if care is not taken in applying the WHO criteria appropriately then cases of osteoporosis can be either seriously under diagnosed or over diagnosed depending on the measurement technique.38 In principle, bone densitometry techniques other than central DXA can be used with appropriate device‐specific thresholds to identify a group of patients with high results who are unlikely to have osteoporosis, and a second group with low results who can be treated without further testing.55 Patients with intermediate results can be referred for a central DXA examination for a definitive decision. However, the clinical application of this triage algorithm requires the availability of adequate information about the device‐specific thresholds.
THE NEW WHO FRACTURE RISK ALGORITHM
Views on the best way of using information from DXA scans to give advice to patients about the use of antifracture treatment continue to evolve.2,57,58,59 As emphasised above, the clinical value of BMD examinations lies in the information they provide about fracture risk. An important limitation of the WHO T‐score approach to making decisions about treatment is that age as well as BMD is an important factor in determining the risk of the patient having a fracture within the next 5 or 10 years.2,58,60 For any hip T‐score figure, fracture risk in men and women between the ages of 45 and 85 years varies greatly according to age.2,60 A new approach to the use of BMD scans to guide treatment decisions has been proposed based on the 10 year probability of the patient sustaining an osteoporotic fracture.2,58 This has a number of advantages, including: the targeting of osteoporosis treatment according to the patient's risk of fracture2; the incorporation of additional risk factors such as a history of prior fracture to refine the algorithm for estimating fracture risk58; and the use of health economic criteria to set thresholds for intervention based on the costs of treatment, savings to health services, and the contribution of fracture prevention to patients' quality of life.57
Box 2 Clinical risk factors included in WHO fracture algorithm58
Age
Low body mass index
Prior fracture after age 50
Parental history of hip fracture
Current smoking habit
Current or past use of systemic corticosteroids
Alcohol intake >2 units daily
Rheumatoid arthritis
The value of using information from additional risk factors that give independent information about fracture risk over and above that provided by age and BMD can be understood by reference to the ROC curve shown in fig 2B. With all types of bone densitometry measurement, the fracture and non‐fracture patients have overlapping BMD distributions (fig 2A), leading to ROC curves (fig 2B), in which at any given T‐score threshold only a certain percentage of future fracture cases are identified for treatment at the cost of also having to treat a large number of patients who are not going to fracture. As explained above, the best that can be done with bone densitometry alone is to choose the BMD measurement site with the highest RR value that will optimise the ROC curve. However, by combining BMD data with age and other appropriately chosen risk factors (box 2), the ROC curve can be further improved so that treatments are better targeted on the patients at highest risk.
The new WHO fracture risk algorithm is based on a series of meta‐analyses of data from 12 independent fracture studies from North America, Europe, Asia and Australia.61,62,63,64,65,66 The DXA scan information required is femoral neck BMD. Because of the need to build the correct parameters into the statistical model, including the interdependence of the various risk factors, there is a specific requirement that the BMD information is provided by a hip DXA scan. The reliance on BMD information from a single skeletal site raises the question of whether fracture risk prediction can be improved by combining BMD measurements from more than one site. A meta‐analysis of spine and femoral neck BMD data showed that use of the lowest T‐score did not improve the ROC curve.67 This finding is perhaps surprising, but mathematical analysis supplies the reason: although hip and spine BMD measurements are quite poorly correlated (r = 0.5 to 0.65), even this degree of correlation is too high for a second BMD site to provide significant additional information about fracture risk.68 A further point that follows from the WHO fracture risk algorithm is that not all patients necessarily require a DXA scan.69 For some the use of age, fracture history and the other risk factors listed in box 2 are sufficient to place them in either the high risk group requiring antifracture treatment, or the low risk group who can be reassured that their likelihood of having a fracture is small. Thus, in future a triage approach could be adopted for BMD scans in which the fracture risk algorithm is used to select those patients for a DXA examination in whom BMD information is likely to make a significant contribution to their management.
Another advantage of the new WHO approach is that it enables fracture risk thresholds for intervention to be established based on economic criteria that can be adjusted for practice in different countries.70,71 A series of health economic analyses have examined the rationale for fracture prevention and the cost effectiveness of different osteoporosis treatments.72,73,74,75,76 These analyses show that, taking account of all types of fracture, the cost effective intervention thresholds correspond to T‐score values between −2 and −3 over a range of ages from 50 to 80 years.57,58
NICE GUIDANCE ON THE TREATMENT OF OSTEOPOROSIS
The National Institute for Health and Clinical Excellence (NICE) is in the process of developing clinical guidelines for the assessment of fracture risk and prevention of osteoporotic fractures in individuals at high risk, which will set out standards of care for people with or at risk of osteoporosis.77 No date has been set for the publication of the osteoporosis guidelines, but as part of their development two sets of technology appraisals dealing respectively with the primary and secondary prevention of osteoporotic fractures are in preparation,78,79 and draft versions of these appraisals were recently (March 2007) issued as appraisal consultation documents.80,81
The new consultation document on secondary prevention updates an earlier technology appraisal published in 2005.82 Based on drug costs and meta‐analyses of antifracture efficacy, the recommended agent for the initiation of treatment is generic alendronate.81 Alendronate is recommended for the secondary prevention of osteoporotic fragility fractures in postmenopausal women who have a T‐score of −2.5 SD or below confirmed by DXA scanning. For women aged 75 years or older clinicians may choose to initiate treatment without the need for a DXA scan. Other established treatments (etidronate, risedronate, raloxifene, strontium ranelate and teriparatide) are not recommended for initiating treatment because they are either more expensive or considered less effective than generic alendronate. Women who are currently receiving treatment using any of the above drugs but who do not meet the new criteria for therapy have the option to continue treatment until they and their clinicians consider it appropriate to stop. No recommendation is made about the use of alternative treatments in women with a contraindication or intolerance towards alendronate, and it is likely that advice on this issue will be left to the publication of the clinical guidelines.
The consultation document on primary prevention restricts treatment to women aged 70 years and older with at least one clinical risk factor suggestive of low BMD and a T‐score of −2.5 or below.80 A woman aged 75 years or older may be treated without the need for a DXA scan if she has two or more clinical risk factors. Clinical risk factors for primary prevention are listed as: parental history of hip fracture; low body mass index (BMI <22 kg/m2); untreated premature menopause; alcohol intake of ⩾4 units per day; or any medical condition associated with low BMD such as anorexia or coeliac disease. As with the recommendation for secondary prevention, the choice of drug is restricted to generic alendronate. However, clinicians may continue to treat women presently receiving other established treatments, or who do not meet the new criteria for initiating therapy.
The NICE technology appraisals are considerably more restrictive than the economic analyses published by the WHO study group,57,58,70,71,72,73,74,75,76 especially for primary prevention. Such differences are perhaps not surprising in view of the many different assumptions involved in such economic modelling. At the present time the NICE guidelines are still out for consultation and the final recommendations may change from the information set out above.
MONITORING RESPONSE TO TREATMENT
Verifying response to treatment using follow up DXA scans is widely believed to have a beneficial role in encouraging patients to continue taking their medication, and also in identifying non‐responders who may benefit from a different treatment regimen. Central DXA has a number of advantages as a technique for monitoring patients' response, of which one of the most important is the good precision of BMD measurements (box 1). The precision is usually expressed in terms of the coefficient of variation (CV) which is typically around 1–1.5% for spine and total hip BMD and 2–2.5% for femoral neck BMD.83 DXA scanners have good long‐term precision because among other reasons their calibration is extremely stable and there are effective instrument quality control procedures provided by the manufacturers to detect any long‐term drifts (box 1). A second requirement for effective patient monitoring is a measurement site that shows a large response to treatment. The best BMD site for follow‐up measurements is the spine because the treatment changes are usually largest and the precision error is as good or better than that at most other sites.84,85 Nevertheless, the limited sensitivity means that the use of DXA scanning for patient monitoring is more controversial than its use for the diagnosis and treatment of osteoporosis. When used for this purpose, follow up scans should not be performed more frequently than every 1 to 2 years.
CONCLUSIONS
As a technique for performing bone densitometry, hip and spine DXA examinations have a number of important clinical advantages including compatibility with the WHO T‐score definition of osteoporosis, their proven effectiveness at predicting fracture risk, proven effectiveness for targeting of antifracture treatment, effectiveness at monitoring patients' response to treatment, and compatibility with the new WHO fracture risk algorithm. Other advantages include the stable calibration of hip and spine DXA scanners, the good precision of the measurements, and the availability of reliable reference ranges. Their future clinical use will be determined by the NICE guidelines and by the new approach of basing patient treatment on individual fracture risk. It is likely in the future that hip BMD examinations will be performed for making decisions about treatment and spine BMD examinations for the purposes of treatment monitoring.
MULTIPLE CHOICE QUESTIONS (TRUE (T)/FALSE (F); ANSWERS AFTER THE REFERENCES)
1. The World Health Organization defines osteoporosis in terms of:
Occurrence of a low trauma fracture
Low bone mineral density
Increases in biochemical markers of bone turnover
Findings of a bone biopsy examination
2. Which of the following statements about the WHO definition of osteoporosis is false?
Can be applied to spine, hip and forearm dual‐energy x ray absorptiometry (DXA) measurements in white postmenopausal women
Leads to 50% of women being osteoporotic by the age of 75
Can be applied to children and adolescents
Can be applied to older men
3. Which of the following is the optimum bone mineral density (BMD) site for assessing a patient's response to treatment?
Lumbar spine
Total hip
Total body
One‐third (33%) radius
4. Which of the following BMD findings is sufficient for a diagnosis of osteoporosis?
Both spine and hip T‐score are < −2.5
Both spine and hip T‐score are ⩽ −2.5
Either spine or hip T‐score are < −2.5
Either spine or hip T‐score ⩽ −2.5
5. Which of the following four BMD measurement sites is the best for assessing a patient's risk of hip fracture?
Lumbar spine
Heel
Femoral neck
One third (33%) radius
Further reading
Cummings SR, Melton LJ. Epidemiology and outcomes of osteoporotic fractures. Lancet 2002;359:1761–7.
Marshall D, Johnell O, Wedel H. Meta‐analysis of how well measures of bone mineral density predict occurrence of osteoporotic fractures. BMJ 1996;312:1254–9.
Kanis JA. Diagnosis of osteoporosis and assessment of fracture risk. Lancet 2002;359:1929–36.
Kanis JA, Borgstrom F, De Laet C, et al. Assessment of fracture risk. Osteoporos Int 2005;16:581–9.
Kanis JA, Borgstrom F, Zethraeus N, et al. Intervention thresholds for osteoporosis in the UK. Bone 2005;36:22–32.
Abbreviations
BMD - bone mineral density
BP - bisphosphonate
CV - coefficient of variation
DXA - dual‐energy x ray absorptiometry
MrOS - Osteoporotic Fractures in Men Study
NHANES III - Third National Health and Nutrition Examination Study
NICE - National Institute for Health and Clinical Excellence
PDXA - peripheral dual‐energy x ray absorptiometry
PTH - parathyroid hormone
QCT - quantitative computed tomography
QUS - quantitative ultrasound
ROC - receiver operator characteristic
RR - relative risk
SERM - selective oestrogen receptor modulator
SOF - Study of Osteoporotic Fractures
WHO - World Heath Organization
ANSWERS
(A) F (B) T (C) F (D) F
(A) T (B) T (C) F (D) T
(A) T (B) F (C) F (D) F
(A) F (B) F (C) F (D) T
(A) F (B) F (C) T (D) F
Footnotes
Competing interests: The authors have no conflicts of interest to declare
References
- 1.Cummings S R, Melton L J. Epidemiology and outcomes of osteoporotic fractures. Lancet 20023591761–1767. [DOI] [PubMed] [Google Scholar]
- 2.Kanis J A, Black D, Cooper C.et al A new approach to the development of assessment guidelines for osteoporosis. Osteoporos Int 200213527–536. [DOI] [PubMed] [Google Scholar]
- 3.Johansen A, Evans R J, Stone M D.et al Fracture incidence in England and Wales: a study based on the population of Cardiff. Injury 199728655–660. [DOI] [PubMed] [Google Scholar]
- 4.Johansen A, Stone M. The cost of treating osteoporotic fractures in the United Kingdom female population [letter]. Osteoporos Int 200011551. [DOI] [PubMed] [Google Scholar]
- 5.Dolan P, Torgerson D J. The cost of treating osteoporotic fractures in the United Kingdom female population. Osteoporos Int 19988611–617. [DOI] [PubMed] [Google Scholar]
- 6.Melton L J, Gabriel S E, Crowson C S.et al Cost‐equivalence of different osteoporotic fractures. Osteoporos Int 200314383–388. [DOI] [PubMed] [Google Scholar]
- 7.Cooper C, Atkinson E J, Jacobsen S J.et al Population based study of survival after osteoporotic fractures. Am J Epidemiol 19931371001–1005. [DOI] [PubMed] [Google Scholar]
- 8.Centre J R, Nguyen T V, Schneider D.et al Mortality after all major types of osteoporotic fractures in men and women: an observational study. Lancet 1999353878–882. [DOI] [PubMed] [Google Scholar]
- 9.Torgerson D J, Dolan P. The cost of treating osteoporotic fractures in the United Kingdom female population [letter]. Osteoporos Int 200011511–512. [DOI] [PubMed] [Google Scholar]
- 10.Clark S. Osteoporosis – the disease of the 21st century? Lancet 20023591714. [DOI] [PubMed] [Google Scholar]
- 11.Genant H K, Engelke K, Fuerst T.et al Noninvasive assessment of bone mineral and structure: state of the art. J Bone Miner Res 199611707–730. [DOI] [PubMed] [Google Scholar]
- 12.Storm T, Thamsborg G, Steiniche T.et al Effect of intermittent cyclical etidronate therapy on bone mass and fracture rate in women with postmenopausal osteoporosis. N Engl J Med 19903221265–1271. [DOI] [PubMed] [Google Scholar]
- 13.World Health Organization Assessment of fracture risk and its application to screening for postmenopausal osteoporosis: technical report series 843. Geneva: WHO, 1994 [PubMed]
- 14.Kanis J A, Gluer C C, for the Committee of Scientific Advisors, International Osteoporosis Foundation An update on the diagnosis and assessment of osteoporosis with densitometry. Osteoporos Int 200011192–202. [DOI] [PubMed] [Google Scholar]
- 15.Black D M, Cummings S R, Karpf D B.et al Randomised trial of the effect of alendronate on risk of fracture in women with existing vertebral fractures. Lancet 19963481535–1541. [DOI] [PubMed] [Google Scholar]
- 16.Cummings S R, Black D M, Thompson D E.et al Effect of alendronate on risk of fracture in women with low bone density but without vertebral fractures: results from the Fracture Intervention Trial. JAMA 19982802077–2082. [DOI] [PubMed] [Google Scholar]
- 17.Harris S T, Watts N B, Genant H K.et al Effects of risedronate treatment on vertebral and non‐vertebral fractures in women with postmenopausal osteoporosis. JAMA 19992821344–1352. [DOI] [PubMed] [Google Scholar]
- 18.McClung M R, Geusens P, Miller P D.et al Effect of risedronate treatment on hip fracture risk in elderly women. N Engl J Med 2001344333–340. [DOI] [PubMed] [Google Scholar]
- 19.Chesnut C H, Skag A, Christiansen C.et al Effects of oral ibandronate administered daily or intermittently on fracture risk in postmenopausal osteoporosis. J Bone Miner Res 2004191241–1249. [DOI] [PubMed] [Google Scholar]
- 20.Black D M, Boonen S, Cauley J.et al Effect of once‐yearly infusion of zolendronic acid 5 mg on spine and hip fracture reduction in postmenopausal women with osteoporosis: the HORIZON pivotal fracrure trial. J Bone Miner Res 200621(Suppl 1)S16 [Google Scholar]
- 21.Ettinger B, Black D M, Mitlak B H.et al Reduction of vertebral fracture risk in postmenopausal women with osteoporosis treated with raloxifene: results from a 3‐year randomised clinical trial. JAMA 1999282637–645. [DOI] [PubMed] [Google Scholar]
- 22.Neer R M, Arnaud C D, Zanchetta J R.et al Effect of recombinant human parathyroid hormone (1–34) fragment on spine and non‐spine fractures and bone mineral density in postmenopausal osteoporosis. N Engl J Med 20013441434–1441. [DOI] [PubMed] [Google Scholar]
- 23.Meunier P J, Roux C, Seeman E.et al The effects of strontium ranelate on the risk of vertebral fracture in women with postmenopausal osteoporosis. N Engl J Med 2004350459–468. [DOI] [PubMed] [Google Scholar]
- 24.Reginster J Y, Seeman E, De Vernejoul M C.et al Strontium ranelate reduces the risk of nonvertebral fractures in postmenopausal women with osteoporosis: TROPOS study. J Clin Endocrinol Metab 2005902816–2822. [DOI] [PubMed] [Google Scholar]
- 25.Seeman E, Vellas B, Benhamou C.et al Strontium ranelate reduces the risk of vertebral and nonvertebral fractures in women eighty years of age and older. J Bone Miner Res 2006211113–1120. [DOI] [PubMed] [Google Scholar]
- 26.Kanis J A, Delmas P, Burckhardt P, on behalf of the European Foundation for Osteoporosis and Bone Disease et al Guidelines for diagnosis and treatment of osteoporosis. Osteoporos Int 19977390–406. [DOI] [PubMed] [Google Scholar]
- 27.Royal College of Physicians Clinical guidelines for the prevention and treatment of osteoporosis. London: RCP, 1999
- 28.Marshall D, Johnell O, Wedel H. Meta‐analysis of how well measures of bone mineral density predict occurrence of osteoporotic fractures. BMJ 19963121254–1259. [DOI] [PMC free article] [PubMed] [Google Scholar]
- 29.Stone K L, Seeley D G, Lui L ‐ Y.et al BMD at multiple sites and risk of fracture of multiple types: long‐term results from the Study of Osteoporotic Fractures. J Bone Miner Res 2003181947–1954. [DOI] [PubMed] [Google Scholar]
- 30.Johnell O, Kanis J A, Oden A.et al Predictive value of BMD for hip and other fractures. J Bone Miner Res 2005201185–1194. [DOI] [PubMed] [Google Scholar]
- 31.Eastell R. Treatment of postmenopausal osteoporosis. N Engl J Med 1998338736–746. [DOI] [PubMed] [Google Scholar]
- 32.Gluer C ‐ C. Monitoring skeletal change by radiological techniques. J Bone Miner Res 1999141952–1962. [DOI] [PubMed] [Google Scholar]
- 33.Fogeman I, Blake G M. Different approaches to bone densitometry. J Nucl Med 2000412015–2025. [PubMed] [Google Scholar]
- 34.Guglielmi G, Lang T F. Quantitative computed tomography. Semin Musculoskelet Radiol 20026219–227. [DOI] [PubMed] [Google Scholar]
- 35.Lang T F, Guglielmi G, Van Kuijk C.et al Measurement of vertebral bone mineral density at the spine and proximal femur by volumetric quantitative computed tomograph and dual‐energy X‐ray absorptiometry in elderly women with and without vertebral fractures. Bone 200230247–250. [DOI] [PubMed] [Google Scholar]
- 36.Blake G M, Fogelman I. Clinical use of instruments that measure peripheral bone mass. Current Opinion in Endocrinology and Diabetes 20029502–511. [Google Scholar]
- 37.Stewart A, Reid D M. Quantitative ultrasound in osteoporosis. Semin Musculoskelet Radiol 20026229–232. [DOI] [PubMed] [Google Scholar]
- 38.Lu Y, Genant H K, Shepherd J.et al Classification of osteoporosis based on bone mineral densities. J Bone Miner Res 200116901–910. [DOI] [PubMed] [Google Scholar]
- 39.Faulkner K G, Von Stetton E, Miller P. Discordance in patient classification using T‐scores. J Clin Densitom 19992343–350. [DOI] [PubMed] [Google Scholar]
- 40.Blake G M, Fogelman I. Peripheral or central densitometry: does it matter which technique we use? J Clin Densitom 2001483–96. [DOI] [PubMed] [Google Scholar]
- 41.Cummings S R, Black D M, Nevitt M C.et al Bone density at various sites for prediction of hip fractures. Lancet 199334172–75. [DOI] [PubMed] [Google Scholar]
- 42.Black D M, Palermo L, Bauer D. How well does bone mass predict long‐term risk of hip fracture? Osteoporosis Int 200011(Suppl 2)S59 [Google Scholar]
- 43.Orwoll E S, Marshall L M, Chan B K.et al Measures of hip structure are important determinants of hip fracture risk independent of BMD. J Bone Miner Res 200620(Suppl 1)S35 [Google Scholar]
- 44.Bauer D C, Gluer C ‐ C, Cauley J A.et al Broadband ultrasonic attenuation predicts fractures strongly and independently of densitometry in older women. Arch Intern Med 1997157629–634. [PubMed] [Google Scholar]
- 45.Hans D, Dargent‐Molina P, Schott A M.et al Ultrasonographic heel measurements to predict hip fracture in elderly women: the EPIDOS prospective study. Lancet 1996348511–514. [DOI] [PubMed] [Google Scholar]
- 46.Woodhouse A, Black D M. BMD at various sites for the prediction of hip fracture: a meta‐analysis. J Bone Miner Res 200015(Suppl 2)S145 [Google Scholar]
- 47.Pluijm S M F, Graafmans W C, Bouter L M.et al Ultrasound measurements for the prediction of osteoporotic fractures in elderly people. Osteoporos Int 19999550–556. [DOI] [PubMed] [Google Scholar]
- 48.Khaw K ‐ T, Reeve J, Luben R.et al Prediction of total and hip fracture risk in men and women by quantitative ultrasound of the calcaneus: EPIC‐Norfolk prospective population study. Lancet 2004363197–202. [DOI] [PubMed] [Google Scholar]
- 49.Miller P D, Siris E S, Barrett‐Connor E.et al Prediction of fracture risk in postmenopausal white women with peripheral bone densitometry: evidence from the National Osteoporosis Risk Assessment. J Bone Miner Res 2002172222–2230. [DOI] [PubMed] [Google Scholar]
- 50.Bauer D C, Palermo L, Black D M.et al A prospective study of dry calcaneal quantitative ultrasound and fracture risk in older women: the Study of Osteoporotic Fractures. J Bone Miner Res 200116(Suppl 1)S166 [Google Scholar]
- 51.Barr R J, Adebajo A, Fraser W D.et al Can peripheral DXA measurements be used to predict fractures in elderly women living in the community? Osteoporos Int 2005161177–1183. [DOI] [PubMed] [Google Scholar]
- 52.Looker A C, Wahner H W, Dunn W L.et al Updated data on proximal femur bone mineral levels of US adults. Osteoporos Int 19988468–489. [DOI] [PubMed] [Google Scholar]
- 53.Faulkner K G, Roberts L A, McClung M R. Discrepancies in normative data between Lunar and Hologic DXA systems. Osteoporosis Int 19966432–436. [DOI] [PubMed] [Google Scholar]
- 54.Hanson J. Standardization of femur BMD. J Bone Miner Res 1997121316–1317. [DOI] [PubMed] [Google Scholar]
- 55.Blake G M, Chinn D J, Steel S A.et al A list of device specific thresholds for the clinical interpretation of peripheral x‐ray absorptiometry examinations. Osteoporos Int 2005162149–2156. [DOI] [PubMed] [Google Scholar]
- 56.International Society for Clinical Densitometry Official positions of the International Society for Clinical Densitometry: updated 2005. http://www.iscd.org/visitors/positions/official.cfm (Accessed 26 March 2007)
- 57.Kanis J A. Diagnosis of osteoporosis and assessment of fracture risk. Lancet 20023591929–1936. [DOI] [PubMed] [Google Scholar]
- 58.Kanis J A, Borgstrom F, De Laet C.et al Assessment of fracture risk. Osteoporos Int 200516581–589. [DOI] [PubMed] [Google Scholar]
- 59.De Laet C, Oden A, Johansson H.et al The impact of the use of multiple risk factors for fracture on case‐finding strategies: a mathematical approach. Osteoporos Int 200516313–318. [DOI] [PubMed] [Google Scholar]
- 60.Kanis J A, Johnell O, Oden A.et al Ten year probabilities of osteoporotic fractures according to BMD and diagnostic thresholds. Osteoporos Int 200112989–995. [DOI] [PubMed] [Google Scholar]
- 61.Kanis J A, Johnell O, De Laet C.et al A meta‐analysis of previous fracture and subsequent fracture risk. Bone 200435375–382. [DOI] [PubMed] [Google Scholar]
- 62.Kanis J A, Johansson H, Oden A.et al A meta‐analysis of prior corticosteroid use and fracture risk. J Bone Miner Res 200419893–899. [DOI] [PubMed] [Google Scholar]
- 63.Kanis J A, Johansson H, Oden A.et al A family history of fracture and fracture risk: a meta‐analysis. Bone 2004351029–1037. [DOI] [PubMed] [Google Scholar]
- 64.Kanis J A, Johnell O, Oden A.et al Smoking and fracture risk: a meta‐analysis. Osteoporos Int 200516155–162. [DOI] [PubMed] [Google Scholar]
- 65.Kanis J A, Johansson H, Johnell O.et al Alcohol intake as a risk factor for fracture. Osteoporos Int 200516737–742. [DOI] [PubMed] [Google Scholar]
- 66.De Laet C, Kanis J A, Oden A.et al Body mass index as a predictor of fracture risk: a meta‐analysis. Osteoporos Int 2005161330–1338. [DOI] [PubMed] [Google Scholar]
- 67.Kanis J A, Johnell O, Oden A.et al The use of multiple sites for the diagnosis of osteoporosis. Osteoporos Int 200617527–534. [DOI] [PubMed] [Google Scholar]
- 68.Blake G M, Patel R, Knapp K M.et al Does the combination of two BMD measurements improve fracture discrimination? J Bone Miner Res 2003181955–1963. [DOI] [PubMed] [Google Scholar]
- 69.Johansson H, Oden A, Johnell O.et al Optimisation of BMD measurements to identify high risk groups for treatment – a test analysis. J Bone Miner Res 200419906–913. [DOI] [PubMed] [Google Scholar]
- 70.Kanis J A, Oden A, Johnell O.et al The burden of osteoporotic fractures: a method of setting intervention thresholds. Osteoporos Int 200112417–427. [DOI] [PubMed] [Google Scholar]
- 71.Borgstrom F, Johnell O, Kanis J A.et al At what hip fracture risk is it cost effective to treat? International intervention thresholds for the treatment of osteoporosis. Osteoporos Int 2006171459–1471. [DOI] [PubMed] [Google Scholar]
- 72.Kanis J A, Borgstrom F, Zethraeus N.et al Intervention thresholds for osteoporosis in the UK. Bone 20053622–32. [DOI] [PubMed] [Google Scholar]
- 73.Zethraeus N, Borgstrom F, Strom O.et al Cost‐effectiveness of the treatment and prevention of osteoporosis – a review of the literature and a reference model. Osteoporos Int 2007189–23. [DOI] [PubMed] [Google Scholar]
- 74.Kanis J A, Borgstrom F, Johnell O.et al Cost‐effectiveness of raloxifene in the UK: an economic evaluation based on the MORE study. Osteoporos Int 20051615–25. [DOI] [PubMed] [Google Scholar]
- 75.Borgstrom F, Carisson A, Sintonen H.et al Cost‐effectiveness of risedronate in the treatment of osteoporosis: an international perspective. Osteoporos Int 200617996–1007. [DOI] [PubMed] [Google Scholar]
- 76.Borgstrom F, Jonsson B, Strom O, Kanis J A. An economic evaluation of strontium ranelate in the treatment of osteoporosis in a Swedish setting based on the results of the SOTI and TROPOS trials. Osteoporos Int 2006171781–1793. [DOI] [PubMed] [Google Scholar]
- 77.National Institute for Health and Clinical Excellence Osteoporosis: assessment of fracture risk and the prevention of osteoporotic fractures in individuals at high risk. http://guidance.nice.org.uk/page.aspx?o = guidelines.inprogress.osteoporosis (Accessed 26 March 2007)
- 78.National Institute for Health and Clinical Excellence The clinical effectiveness and cost effectiveness of technologies for the primary prevention of osteoporotic fragility fractures in postmenopausal women. http://guidance.nice.org.uk/page.aspx?o = appraisals.inprogress.osteoporosisprevent (Accessed 26 March 2007)
- 79.National Institute for Health and Clinical Excellence Alendronate, etidronate, risedronate, raloxifene, strontium ranelate and teriparatide for the secondary prevention of osteoporotic fragility fractures in postmenopausal women. http://guidance.nice.org.uk/page.aspx?o = 207028 (Accessed 26 March 2007)
- 80.National Institute for Health and Clinical Excellence Appraisal consultation document. Alendronate, etidronate, risedronate, raloxifene and strontium ranelate for the primary prevention of osteoporotic fragility fractures in postmenopausal women. http://guidance.nice.org.uk/page.aspx?o = 411354 (Accessed 26 March 2007)
- 81.National Institute for Health and Clinical Excellence Appraisal consultation document. Alendronate, etidronate, risedronate, raloxifene, strontium ranelate and teriparatide for the secondary prevention of osteoporotic fragility fractures in postmenopausal women. http://guidance.nice.org.uk/page.aspx?o = 411941 (Accessed 26 March 2007)
- 82.National Institute for Heath and Clinical Excellence Bisphosphonates (alendronate, etidronate, risedronate), selective oestrogen receptor modulators (raloxifene) and parathyroid hormone (teriparatide) for the secondary prevention of osteoporotic fragility fractures in postmenopausal women. NICE Technology Appraisal Guidance No. 87. London: NICE, 2005
- 83.Patel R, Blake G M, Rymer J.et al Long‐term precision of DXA scanning assessed over seven years in forty postmenopausal women. Osteoporos Int 20001168–75. [DOI] [PubMed] [Google Scholar]
- 84.Faulkner K G. Bone densitometry: choosing the proper site to measure. J Clin Densitom 19981279–285. [DOI] [PubMed] [Google Scholar]
- 85.Blake G M, Herd R J M, Fogelman I. A longitudinal study of supine lateral DXA of the lumbar spine: a comparison with posteroanterior spine, hip and total body DXA. Osteoporos Int 19966462–470. [DOI] [PubMed] [Google Scholar]