Abstract
Background
The reorganisation of cancer services in England will result in the creation of specialist high volume cancer surgery centres. Studies have suggested a relationship between increasing surgical volume and improved outcomes in urological pelvic cancer surgery, although to date, they have pre‐defined the definition of “high” and “low” volume surgeons.
Aim
To derive the minimum caseload a surgeon requires to achieve optimum outcomes and to examine the effect of the operating centre size upon individual surgeon's outcomes.
Methods
All cystectomies performed for bladder cancer in England over 5 years were analysed from Hospital Episode Statistics (HES) data. Statistical analysis was undertaken to describe the relationship between each surgeon's annual case volume and two outcome measures: in‐hospital mortality rate, and hospital stay. The surgeon's outcomes were then analysed with respect to the overall level of activity in their operating centre.
Results
A total of 6308 cystectomies were performed; the mean number of surgeons performing them annually was 327 with an overall mortality rate of 5.53%. A significant inverse correlation (−0.968, p<0.01) was found between case volume and mortality rate. Applying 95% confidence interval estimation, the minimum caseload required to achieve the lowest mortality rate was eight procedures per year. Increasing caseload beyond eight operations per year did not produce a significant reduction in mortality rate.
Conclusion
Analysis of HES data confirms an inverse relationship between surgeon's caseload and mortality for radical cystectomy. A caseload of eight operations per year is associated with the lowest mortality rate.
The theory that increased surgical caseload leads to improved outcomes has been advocated in a number of recent studies.1 Healthcare providers in both the USA and the UK have taken this into account, through the creation of guidelines favouring high volume centres. In the USA the Leapfrog Group, a coalition of purchasers, has set minimal volume criteria for certain procedures,2 and in England and Wales a central theme of the National Institute for Health and Clinical Excellence (NICE) urological cancer guidelines3 is centralisation of surgical cancer care services. These guidelines advised that, in the short term, surgeons performing fewer than five cystectomies a year should refer patients to more specialised teams. Creation of centralised specialist teams performing a combined total of at least 50 radical cystectomies and radical prostatectomies a year is then planned. The guidelines do not suggest a threshold case load for surgeons working within these centres.
The evidence for a volume–outcome relationship in radical cystectomy is limited to studies from the USA. The only study to date, by Birkmeyer et al,2 examining the effect of individual surgeon volume on outcome revealed a significant inverse association between surgeon's case volume and mortality. The paper pre‐defined the case load that constituted a low (<2 cystectomies/year), medium (2–3.5) and high (>3.5) volume surgeon. Most urologists believe in the principle of setting a threshold level for surgeons performing radical cystectomy.4 However, the caseload that constitutes this threshold is contentious.
To date, there has been no research evaluating the existence of a surgeon volume to outcome relationship for urological cancer in the UK. No study has attempted to determine whether a threshold case volume exists above which point a surgeon is likely to have optimal outcomes.
We have attempted to determine whether a relationship exists between individual surgeon's case volume and outcomes by analysing the Department of Health Hospital Episode Statistics (HES) data over a 5 year period (1998–2003) for all cystectomies performed in England for urological cancer. We have then evaluated these data to establish if a case volume threshold exists where a surgeon should achieve optimum outcomes.
Methods
Subjects
Relevant HES data for the most recently available 5 year period (April 1998 to April 2003) were obtained from the Department of Health. The HES database is an administrative record of all patients admitted to National Health Service hospitals in England. A dataset is recorded for each patient episode, this being a period of time spent under the care of one consultant. A complete admission may comprise a number of episodes, constituting the patient spell. Diagnostic coding is recorded according to the International classification of disease, 10th revision (ICD‐10) criteria and procedure coding according to the Office of Population, Census and Surveys – classification of surgical operations and procedures, 4th revision (OPCS4) criteria. Duration of hospital stay is calculated by the addition of all episodes which constituted the patient spell. Inpatient mortality can be derived from the patient's final episode, with a specific code existing for mortality.
Patients undergoing cystectomy were identified by filtering the OPCS4 code (M34.1, M34.2, M34.3, M34.4, M34.8, M34.9) from the HES database. Those being treated for cancer were then extracted from this list by filtering for the ICD‐10 codes for bladder, ureteric and urethral cancers (C67.0, C67.1, C67.2, C67.3, C67.4, C67.5, C67.6, C67.9, D09.0, C66.X, C68.0).
A database of all patients undergoing cystectomy for urological malignancies was created for each year; surgeons could be recognised by an anonymous HES code. Therefore, analysis of operative outcomes based on a surgeon's annual workload could be carried out.
Outcome analysis
The primary outcome measure of the study was inpatient operative mortality, defined as the rate of death before hospital discharge. Thirty day mortality cannot be accurately calculated from the HES database since it would not account for deaths outside of hospital. For each 1 year period, the mean mortality rate of every surgeon performing cystectomy was calculated.
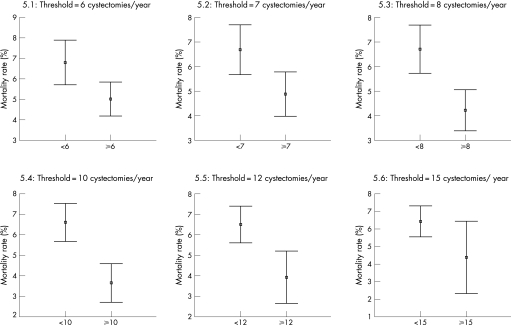
The relationship between the two variables was then explored by plotting mean mortality rate against surgeon's annual case volume. A correlation calculation was undertaken to evaluate this relationship. The distribution of the scatter plot was examined to determine if a threshold level existed where optimum mortality rate may be reached. This was analysed statistically by calculating 95% confidence intervals (CIs) for the mean mortality rate above and below different caseload thresholds, which were then compared. If a caseload threshold existed where a significant difference in mortality occurred then we would not expect to see any overlap between 95% CIs.
Results
Between April 1998 and March 2003, 6308 patients were identified who underwent cystectomy for urological malignancy. Of these, 4787 were male and 1521 female, with an overall mean age of 66.1 years. The overall mortality rate for the 5 year period was 5.6%. Mean duration of hospital stay was 21.9 days.
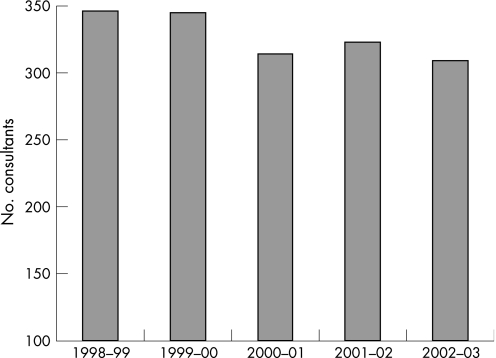
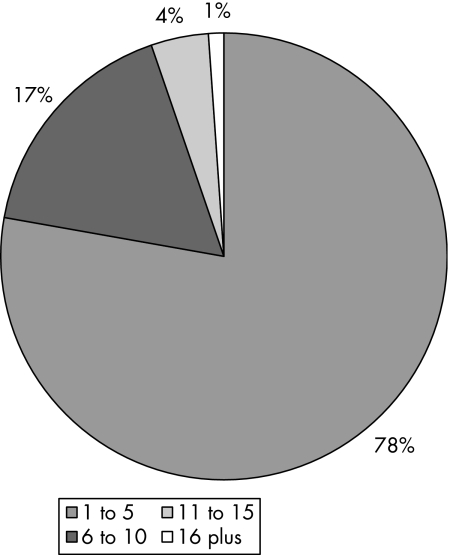
The number of surgeons who performed cystectomy annually decreased from 346 in 1998–99 to 309 in 2002–03 (fig 1). Between these same periods, overall annual mortality rates decreased from 7.3% to 5.2%. Figure 2 reveals that over 75% of consultants performed five or less cystectomies annually.
Figure 1 Number of surgeons performing cystectomy annually.
Figure 2 Proportion of consultants performing within defined ranges of cystectomy annually.
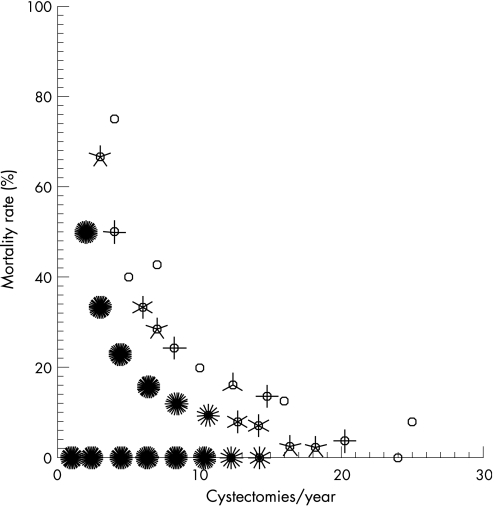
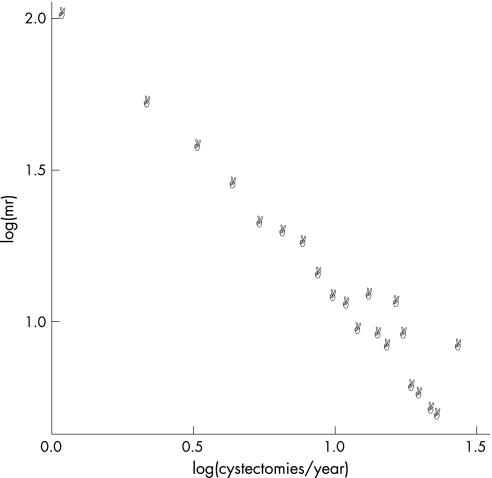
The relationship between case volume and mortality was examined by plotting annual mortality rate against surgeon's case volume (1637 plots). This revealed a sunflower scatter plot with a parabolic appearance (fig 3). By transforming these data logarithmically an inverse linear appearance is revealed (fig 4). A correlation calculation of the logarithmic data reveals a very significant inverse correlation (Pearson coefficient −0.968, p<0.01) between the two variables.
Figure 3 Sunflower scatterplot of mortality rate (%) plotted against mean number of cystectomies performed annually by each trust (n = 1637, the denser the “sunflower” the greater the plots superimposed).
Figure 4 Logarithmic transformation of scatterplot.
The distribution of the plots in fig 3 suggests that the effect of increasing case volume on decreasing mortality reaches a plateau whereby the inverse relationship described above ceases to exist. We defined the threshold case volume to be the minimum number of cystectomies required to be performed by a surgeon at which the lowest mean mortality was recorded. By analysing the distribution of the graph and superimposing a curve of best fit, the threshold at which this plateau is first reached appears to be between about 7–15 cystectomies per year. To accurately establish this threshold we compared 95% CI ranges of mean mortality rate above and below different cut‐offs (fig 5). At thresholds of six and seven cystectomies (figs 5.1 and 5.2) an overlap exists between the CI ranges above and below this number of procedures. Therefore, at this level it is unlikely a significant difference in mean mortality rate exists. Furthermore, the mean mortality rate at these thresholds is also greater than the level at higher thresholds. When we increase the threshold to eight or more operations per year there is no overlap in 95% CI ranges for mean mortality rate above and below this threshold (fig 5.3), suggesting the existence of a significant threshold level. There is no further significant decrease in mean mortality rate beyond the threshold of eight cystectomies per year.
Figure 5 Error bars of 95% CI ranges for mean mortality rates at different case volume thresholds.
The effect of increasing surgeon case volume on decreasing mortality rate appears to reach a threshold, in this study at eight cystectomies per year, whereby further increases in case volume have no significant effect.
Comparing the characteristics of those patients treated by low volume surgeons (<8) and high volume surgeons (⩾8) reveals the patients are well matched with respect to age and gender (table 1). There was no significant difference in duration of hospital stay between the groups (p = 0.43, Mann–Whitney U test). The significant difference in mortality between the groups is confirmed (p<0.01, Mann–Whitney U test).
Table 1 Comparison of patient demographics and outcomes according to case volume of operating surgeon.
| High volume surgeon (⩾8) | Low volume surgeon (<8) | |
|---|---|---|
| Mean age | 66.7 | 66.0 |
| Gender | 76% male | 75.3% male |
| Mortality rate | 4.22% | 6.70% |
| Duration of hospital stay | 21.5 | 23.1 |
Discussion
Our study is the first to examine the relationship between individual surgeon volume and mortality for radical cystectomy in the UK. The only large North American study, to date, examining this relationship arbitrarily pre‐defined who constitutes a high and a low volume surgeon. No previous study has attempted to calculate the annual case volume a surgeon is likely to require to achieve optimum outcomes.
When examining inpatient mortality after cystectomy in the UK we found an overall mean mortality rate of 5.6% for individual surgeons; this decreased to 4.2% within the “high volume” cohort. These mortality rates are unfavourable when compared to reported outcomes of some individual centres. In the USA hospital mortality rates of 0.3% have been reported,6 and in the UK the Sheffield centre reported a rate of <2% over 5 years.7 These reported low mortality rates are not reflected in our overall analysis, even among the subgroup of high volume surgeons in England. NICE set a target hospital mortality rate of 3.5% in its cystectomy guidelines. This target would be unlikely to be achieved currently even if all cystectomies were performed by high volume surgeons. The discovery of a plateau in the volume–outcome relationship, where the two variables no longer appear to influence one another, suggests that a surgeon may only need to reach a threshold number of operations annually to achieve optimum outcomes. Our data suggest that the threshold is eight operations per surgeon annually for radical cystectomy.
A surgeon reaching a threshold figure for such operations will not in itself guarantee optimum outcomes. There are many variables associated with outcome, ranging from the proficiency of the surgeon to the appropriate skills of supporting staff, the overall functioning of the surgical institution and the surgeon's case mix. It would be natural to assume that those surgeons who also perform pelvic cancer surgery in the form of radical retropubic prostatectomy (RRP), in addition to cystectomy, would be achieving higher volumes of procedures that require similar skills and that the two procedures should be assessed in combination. However, the mortality from cystectomy is far greater than RRP; in 2003 we report an overall inpatient mortality of 5.2% for cystectomy compared with a figure of 0.11% for RRP, derived from HES data for the same period.8 Contributing factors to this higher mortality are likely to be the use of bowel in the reconstructive stage of the procedure, higher blood loss and often poorer patient performance status. In 2003, 242 consultants performed RRP compared with 309 performing cystectomy. There is also a rapid move towards RRP being performed laparoscopically or robot‐assisted; a much slower transition is anticipated for cystectomy. It is likely therefore that the generic skills shared between the two operations will become less common. By reaching a threshold volume the surgeon is eliminating one pivotal variable which could adversely affect good outcome.
A shortage of specific evidence for the volume–outcome relationship in urological cancer surgery, especially in the UK, has influenced the current guidelines. The only UK studies examining surgical volume–outcome relationship look at pulmonary lobectomy9 and cardiac surgery,5 with very different outcomes. The lobectomy study failed to establish a relationship between inpatient mortality and surgeon volume; however, the cardiac surgery study described a significant difference in mortality rates between “high” and “low” volume hospitals. Furthermore, both studies pre‐defined their definitions of high and low case volume. The variable findings of these two studies emphasises the importance of procedure specific research before creating guidelines. Setting UK guidelines based on studies from the USA fails to acknowledge the very different methods of healthcare provision and patient selection between the two countries.
The main NICE guideline, with regards surgical volume, is that centres should perform a combined total of 50 radical cystectomies and radical prostatectomies annually. There are only short references to individual surgeon volume, in that those performing fewer than five procedures a year should cease to do so and that specialist urological cancer teams should consist of at least two urologists. In creating guidelines that predominantly address hospital volume the effect of a threshold volume for individual surgeons may not have been addressed. A high volume specialist centre may consist of many low volume surgeons, thereby adversely affecting outcome. Our previous work, using the same data source and statistical methodology, derived a minimum case threshold volume of 11 cystectomies per year for a hospital to achieve optimum outcomes.10
A reliable volume–outcome study requires an accurate database of information. The volume measure requires a complete dataset of appropriate patients and a suitable measure of outcome is required. Outcome can be measured in terms of mortality rate, by a general complication or by a case‐specific complication. The duration of hospital stay has previously been used as a measure of outcome.11 The measurement of mortality alone as an outcome marker will only give a crude analysis of outcome. A concern with the measurement of inpatient mortality is that centres with shorter mean duration of patient hospital stay may record low mortality rates when compared with their 30 day mortality rate, due to higher re‐admission rates.12 This concern is slightly alleviated in our results where we see that there was no significant difference in hospital stay between high and low mortality groups (table 1). A current lack of large, detailed, case‐specific datasets in the UK currently makes analysing outcome by any means apart from mortality rate difficult. The newly created British Association of Urological Surgeons database of complex operations will allow more varied assessment of surgical outcomes. Our study suggested hospital stay is an unreliable marker of outcome if used alone.
The HES database provided a complete dataset of all radical cystectomies performed in England, and the ability to calculate inpatient mortality from this provided a good outcome measure. The reliability of HES data has been scrutinised with concerns about the variation and quality of coding between centres.13 The largest review of HES coding concluded that there is an overall high accuracy across the country.14 This accuracy was found to be better when an analysis is concerned with a single diagnostic or procedure code, as this study was.
In summary, this study confirms the existence of an inverse relationship between surgeon's case volume and mortality for radical cystectomy in the UK. A threshold level exists at a case volume of eight cystectomies per year where a surgeon is likely to achieve optimum outcomes.
Acknowledgements
The Department of Health in England for providing the analysed HES data.
Abbreviations
CI - confidence interval
HES - Hospital Episode Statistics
ICD‐10 - International classification of disease, 10th revision
NICE - National Institute for Health and Clinical Excellence
OPCS4 - Office of Population, Census and Surveys – classification of surgical operations and procedures, 4th revision
RRP - radical retropubic prostatectomy
Footnotes
Competing interests: None declared
References
- 1.Singh R, O'Brien T S. The relationship between volume and outcome in urological surgery. BJU Int 200493931–935. [DOI] [PubMed] [Google Scholar]
- 2.Birkmeyer J D, Stukel T A, Siewers A E.et al Surgeon volume and operative mortality in the United States. N Engl J Med 20033492117–2127. [DOI] [PubMed] [Google Scholar]
- 3.National Institute for Health and Clinical Excellence Improving outcomes in urological cancer. London: NICE, 2002, http://www.nice.org.uk
- 4.Nuttall M, van der Meulen J, McIntosh G.et al Threshold volumes for urological cancer surgery: a survey of UK urologists. BJU Int 2004941010–1013. [DOI] [PubMed] [Google Scholar]
- 5.Bridgewater B, Grayson A D, Jackson M.et al Surgeon specific mortality in adult cardiac surgery: comparison between crude and risk stratified data. BMJ 200332713–17. [DOI] [PMC free article] [PubMed] [Google Scholar]
- 6.Chang S S, Cookson M S, Baumgartner R G.et al Analysis of complications after radical cystectomy: results of a collaborative care pathway. J Urol 20021672012–2016. [PubMed] [Google Scholar]
- 7.Rosario D J, Becker M, Anderson J B. The changing pattern of mortality and morbidity from radical cystectomy. BJU Int 200085427–430. [DOI] [PubMed] [Google Scholar]
- 8.Hanchanale V, McCabe J E, Javle P M. Radical prostatectomy practice in England: HES analysis. BJU Int 200697(Suppl 3)80 [Google Scholar]
- 9.Treasure T, Utley M, Bailey A. Assessment of whether in‐hospital mortality for lobectomy is a useful standard for the quality of lung cancer surgery: retrospective study. BMJ 200332773–75. [DOI] [PMC free article] [PubMed] [Google Scholar]
- 10.McCabe J E, Jibawi A, Javle P M. Defining the minimum hospital case‐load to achieve optimum outcomes in radical cystectomy. BJU Int 200596806–810. [DOI] [PubMed] [Google Scholar]
- 11.Jencks S F, Williams D K, Kay T L. Assessing hospital associated deaths from discharge data. The role of length of stay and comorbidities. JAMA 19882602240–2246. [PubMed] [Google Scholar]
- 12.Goldacre M J, Griffith M, Gill L.et al In‐hospital deaths as a fraction of all deaths within 30 days of hospital admission for surgery: analysis of routine statistics. BMJ 20023241069–1070. [DOI] [PMC free article] [PubMed] [Google Scholar]
- 13.Ballaro A, Oliver S, Emberton M. Do we do what they say we do? Coding errors in urology. BJU Int 200085389–391. [DOI] [PubMed] [Google Scholar]
- 14.Campbell S E, Campbell M K, Grimshaw J M.et al A systematic review of discharge coding accuracy. J Public Health Med 200123205–211. [DOI] [PubMed] [Google Scholar]


