

Abstract
Gain-of-function mutations in NOTCH1 are common in T-cell lymphoblastic leukemias (T-ALL), making this receptor a promising target for drugs such as γ-secretase inhibitors, which block a proteolytic cleavage required for NOTCH1 activation. However, the enthusiasm for these therapies has been tempered by tumor resistance and the paucity of information on the oncogenic programs regulated by oncogenic NOTCH1. Here we show that NOTCH1 regulates PTEN expression and the activity of the PI3K-AKT signaling pathway in normal and leukemic T cells. Notch signaling and the PI3K-AKT pathway synergize in vivo in a Drosophila model of Notch-induced tumorigenesis, and mutational loss of PTEN is associated with resistance to NOTCH1 inhibition in human T-ALL. Overall, these findings identify the transcriptional control of PTEN and the regulation of the PI3K/AKT pathway as key elements of the leukemogenic program activated by NOTCH1 and provide the basis for the design of new therapeutic strategies for T-ALL.
NOTCH receptors directly transduce extracellular signals at the cell surface into changes in gene expression that regulate differentiation, self renewal, proliferation and apoptosis1. Constitutively active forms of the NOTCH1 receptor contribute to over 50% of human T-cell lymphoblastic leukemias and lymphomas (T-ALL)2, and have also been implicated in the pathogenesis of solid tumors, such as breast carcinomas, gliomas and neuroblastoma3-5. NOTCH1 signaling, whether initiated by receptor-ligand interactions or triggered by mutations in the NOTCH1 gene, requires two consecutive proteolytic cleavages in the receptor, the first by an ADAM metalloprotease and the second by a γ-secretase complex6-9. The final cleavage releases intracellular NOTCH1 from the membrane, which then translocates to the nucleus and interacts with the CSL DNA-binding protein to activate the expression of target genes10,11. The high prevalence of activating mutations in NOTCH1 in T-ALL 2 and the availability of small molecule inhibitors of γ-secretase (GSIs) capable of blocking NOTCH1 activation, have prompted clinical trials to test the effectiveness of these agents against T-ALL. However, the efficacy of this strategy has been questioned as GSIs seem to be active in only a small fraction of T-ALL cell lines with constitutive NOTCH1 activity2.
PTEN mutations in GSI resistant T-ALL cells
To elucidate the mechanism of resistance to GSIs in T-ALL, we tested the ability of a well-characterized GSI, Compound E (CompE)12, to inhibit NOTCH1 processing and NOTCH1 signaling in a panel of T-ALL cell lines harboring prototypical activating mutations in NOTCH1 (Supplementary Table 1 online) previously characterized for their response to this GSI2,13. Both GSI-sensitive (ALL-SIL, CUTLL1, DND41, HPB-ALL and KOPTK1) or GSI-resistant (CCRF-CEM, P12-ICHIKAWA, PF382, MOLT3 and RPMI8402) cell lines showed NOTCH1 inhibition when treated with CompE (Supplementary Figs. 1 and 2 online), leading us to consider that resistance to GSI action may be mediated by molecular abnormalities in signaling pathways that promote cell growth downstream of NOTCH1. To test this hypothesis, we analyzed this panel of well characterized GSI-sensitive and GSI-resistant cell lines with oligonucleotide microarrays to identify differentially expressed genes associated with GSI sensitivity or resistance. Nearest-neighbor analysis using the signal-to-noise statistic identified PTEN, which encodes a key tumor suppressor that inhibits the PI3K-AKT signaling pathway14, as the gene most consistently downregulated in GSI-resistant cell lines (Fig. 1a).
Fig. 1. PTEN loss and AKT activation in GSI-resistant T-ALLs.
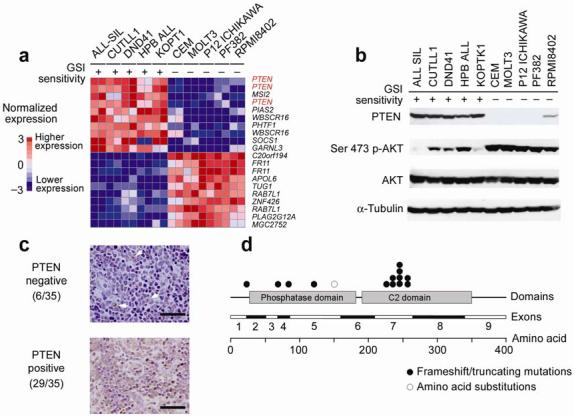
(a) Nearest Neighbor analysis of genes associated with GSI sensitivity and resistance in T-ALL cell lines. Relative gene expression levels are color coded with red (higher levels of expression) and blue (lower levels of gene expression). (b) Western blot analysis of PTEN and p-AKT (Ser473) in T-ALL cell lines. AKT and α-tubulin are shown as loading controls. (c) Representative images of PTEN immunostaining in T-cell lymphoblastic tumors. PTEN positive cell are immunostained in brown. The panel on the top shows negative staining of T-ALL lymphoblasts with scattered non lymphomatous positive cells (arrowheads). The panel on the bottom shows diffuse cytoplasmic immunostaining in a PTEN positive sample. (d) Schematic representation of PTEN mutations identified in T-ALL samples. Scale bars represent 100μm.
Western blot analysis showed readily detectable PTEN protein in all GSI-sensitive T-ALL cells, but total absence or a marked decrease in PTEN levels in all five GSI-resistant cell lines analyzed (Fig. 1b). Further analysis demonstrated that each of the five GSI-resistant cell lines harbored mutations in PTEN, while the five GSI-sensitive cell lines expressed normal PTEN transcripts (Supplementary Table 2 online). PTEN mutations associated with GSI resistance were typically homozygous and generated truncated PTEN protein products due to the presence of premature stop codons. Only RPMI8402 cells contained both a truncating mutation in PTEN and a missense mutation (R159S) in the phosphatase domain in the other allele, consistent with the presence of detectable PTEN protein in this cell line and variable response to GSI 2.
PTEN mutations are frequent in solid tumors and loss of PTEN has been shown to promote the self renewal of leukemic stem cells 15. Furthermore, a role of PTEN deficiency in the pathogenesis of T-cell tumors has been proposed based on the analysis of Pten knock-out mice 16-20. However, PTEN mutations have only been reported sporadically in human leukemias and lymphomas 21-23. Thus, to determine whether our discovery of PTEN loss in GSI-resistant cell lines might also be relevant to primary human cancers, we examined the status of PTEN in T-ALL clinical samples. We found loss of the PTEN protein by immunohistochemistry in 6 of 35 (17%) T-ALL samples, including one relapsed sample in a lymphoma case that was PTEN positive at diagnosis (Fig. 1c and Supplementary Table 3 online). In addition, flow cytometry analysis of PTEN expression in primary T-ALL samples demonstrated loss of PTEN protein in 3 of 18 (17%) cases, in perfect accordance with our immunohistochemistry results (data not shown). Sequence analysis demonstrated mutations in PTEN in 9 of 111 (8%) T-ALL cases at diagnosis (Fig. 1d). In addition, one case expressed the PTEN pseudogene with no expression of normal PTEN transcripts (Supplementary Table 4 online). We have shown before that aberrant expression of transcription factor oncogenes involved in the pathogenesis of T-cell tumors such as TAL1, TLX1, TLX3, LYL1, LMO1 and LMO2 define distinct molecular, biological and clinical groups of in T-ALL 24,25. PTEN mutations were found in cases with aberrant expression of TLX3, TAL1, LYL1 and LMO2 and no particularly association with the expression of any of these T-ALL transcription factor oncogenes was noted. Subsequent analysis of 35 paired samples of DNA from T-ALL lymphoblasts collected at diagnosis and at relapse demonstrated two additional PTEN mutant cases in which loss of this tumor suppressor gene occurred during disease progression (Supplementary Table 5 online). Importantly, although NOTCH1 mutations and PTEN loss can occur independently in the pathogenesis of T-ALL at least four of the PTEN mutated cases identified in this series harbored concomitant mutations in NOTCH1 (Supplementary Tables 4 and 5). Overall these results demonstrate that PTEN mutations and loss of PTEN protein expression are highly frequent in T-ALL cell lines, occur in a subset of human T-cell leukemias and lymphomas at diagnosis, and can be found also as a secondary event during disease progression.
Aberrant AKT signaling induces resistance to GSI
How might PTEN mutations in T-ALL lymphoblasts confer resistance to NOTCH1 inhibition by GSIs? As a critical regulator of the PI3K-AKT signal transduction pathway, PTEN controls multiple cellular responses, including metabolic regulation and cell growth and survival26. Activation of phosphatidylinositol 3-kinase (PI3K) by extracellular stimuli generates phosphatidylinositol triphosphate (PIP3) in the plasma membrane, which recruits the AKT kinase to the membrane, where it is phosphorylated and activated by phosphatidyl inositol-dependent kinase-1 (PDK1)26. Upon its activation, AKT triggers the phosphorylation of numerous protein targets, such as the mTOR kinase, and influences multiple cellular processes including cell growth and proliferation26. The PTEN gene encodes a lipid phosphatase that is responsible for PIP3 dephosphorylation and clearance and required to switch off AKT activation26,27. To pursue this putative link between PTEN and the PI3K-AKT pathway in T-ALL, we examined the levels of AKT phosphorylation in our panel of GSI-sensitive/PTEN-positive and GSI-resistant/PTEN-null cell lines. Western blot analysis showed that p-AKT (Ser473) levels were low and inversely correlated with PTEN expression in GSI-sensitive/PTEN-positive T-ALL cells (Fig. 1b). By contrast, GSI-resistant/PTEN-null T-ALL samples showed high levels of AKT phosphorylation, indicative of constitutive activation of the PI3K-AKT signaling pathway.
To test the prediction that unrestrained activation of the PI3K-AKT signaling pathway plays a causative role in resistance to GSIs, we expressed a constitutively active myristoylated form of AKT (MYR-AKT) in the GSI-sensitive CUTLL1 cell line. Inhibition of NOTCH1 signaling by GSI treatment or NOTCH1 typically impaired the growth of CUTLL1 cells (Fig. 2a), whereas constitutively high levels of p-AKT (Ser473) (Supplementary Fig. 3 online) induced by enforced expression of MYR-AKT were sufficient to rescue these cells from the growth inhibitory effects of NOTCH1 inhibition with GSI (Fig. 2a,b). Similarly, shRNA knock-down of PTEN in DND41 cells (Supplementary Fig. 3 online) blocked the cell growth inhibitory effects of CompE in this GSI-sensitive/PTEN-positive cell line (Fig. 2c,d). Together, these results indicate that aberrant activation of the PI3K-AKT signaling pathway induces resistance to NOTCH1 inhibition in T-ALL cells.
Fig. 2. PTEN loss and AKT activation induce GSI resistance in T-ALL.
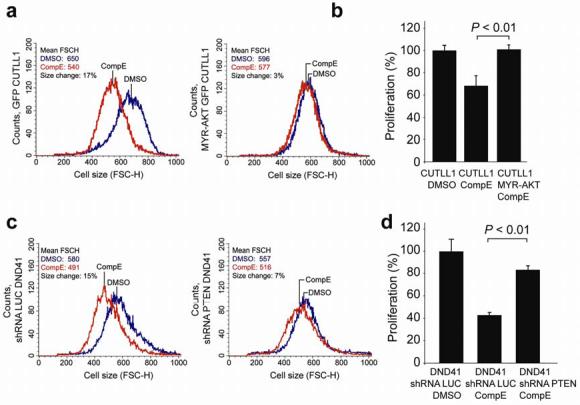
(a and b) Decreased cell size (a; FSC-H) and decreased cell growth (b) induced by GSI treatment (CompE 100 nM for 4 days) are rescued by retroviral expression of a constitutive active AKT (Myr-AKT) in CUTLL1 cells. (c and d) shRNA knock-down of PTEN restores cell size defects (c) and reduced cell growth (d) of DND41 cells treated with GSI (CompE 100 nM for 4 days) compared to that of vehicle (DMSO) treated controls. No protective effect was observed by expression of a control shRNA targeting the luciferase gene (shRNA LUC). Mean FSC-H values for GSI and vehicle only treatment controls are indicated. Bar graphs represent means ± standard deviation of triplicate samples. P values were derived from Student's t-test.
NOTCH1 regulates PTEN and the PI3K-AKT pathway
The close association between the presence of PTEN mutations and GSI resistance in T-ALL prompted us to ask whether PTEN might be functionally linked to NOTCH1 signaling. Analysis of the transcriptional responses of GSI-sensitive/PTEN-positive cells to NOTCH1 inhibition demonstrated significant upregulation of PTEN expression (Fig. 3a), with consequently higher PTEN protein levels, and gradual inhibition of the PI3K-AKT pathway, as judged from decreased Ser473 phosphorylation on AKT (Fig. 3b).
Fig. 3. NOTCH1 regulates PTEN expression, AKT signaling and glucose metabolism.
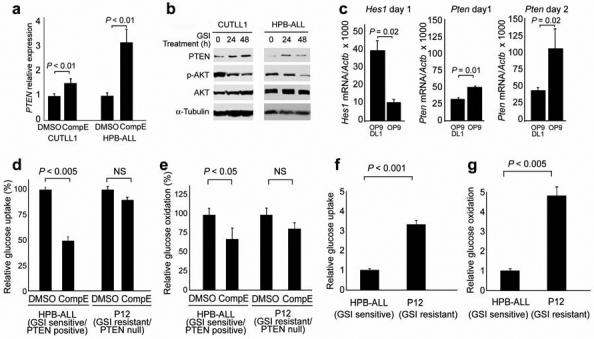
(a) Real-time PCR analysis of PTEN transcript levels upon NOTCH1 inhibition by GSI in CUTLL1 and HPB-ALL relative to (DMSO) controls. GAPDH levels were used as reference control. (b) Western blot analysis of PTEN and p-AKT (Ser473) in GSI sensitive T-ALL cell lines treated with CompE. AKT and α-Tubulin are shown as loading controls. (c) Real-time PCR analysis of Hes1 and Pten expression in mouse DN3 thymocytes cocultured with stromal cells (OP9) or stromal cells expressing the NOTCH1 ligand Delta-like-1 (OP9-DL1). Data are means +/- s.d. of duplicate (day 1) and triplicate (day 2) experiments. (d) Glucose uptake analysis in HPB-ALL and P12-ICHIKAWA T-ALL cell lines in basal conditions (vehicle treatment only). (e) Glucose oxidation analysis in HPB-ALL and P12-ICHIKAWA T-ALL cell lines in basal conditions (vehicle treatment only). (f) Effects of GSI treatment in glucose uptake in HPB-ALL and P12-ICHIKAWA T-ALL cells. (g) Effects of GSI treatment in glucose oxidation in HPBALL and P12-ICHIKAWA T-ALL cells. Data shown in d-g are means ± standard deviation of triplicates. P values in a, c-g were derived from Student's t-test.
Ligand-mediated activation of NOTCH signaling during T-cell development is required to maintain cell growth and glucose metabolism at the time of T-cell receptor β-chain selection and has been associated with increased AKT phosphorylation28. Yet, the mechanism responsible for PI3K-AKT upregulation downstream of NOTCH activation during normal thymocyte development remains unknown. We therefore hypothesized that transcriptional downregulation of PTEN downstream of NOTCH1 could mediate the upregulation of the PI3K-AKT signaling pathway, not only in T-ALL cells but also in developing thymocytes. To test this hypothesis, we analyzed the effects of withdrawing NOTCH1 signals, driven by the NOTCH1 ligand Delta-like 1, from T-cell precursors. Immature CD4- CD8- double-negative 3 (DN3) thymocytes were generated by coculture of hemopoietic progenitors from Rag-/- mice with stromal cells expressing the Notch ligand Delta-like 1 (OP9-DL1). Purified DN3 cells were subsequently cultured in the presence of continuous Notch1 signaling, by coculture with OP9-DL1 cells, or they were deprived of Delta-like1 stimulation of Notch1, by coculture with regular OP9 stromal cells devoid of this ligand. Loss of Notch1 signaling in the DN3 thymocytes cultured in OP9 cells induced marked downregulation of the Notch1 target gene Hes1 at day 1 and progressive upregulation of Pten transcript levels, compared to DN3 cells maintained in culture with OP9-DL1 cells (Fig. 3c). These results demonstrate that the regulation of PTEN expression downstream of NOTCH1 is not limited to human T-ALL cells harboring oncogenic NOTCH1 alleles, as it is also present in normal murine thymocytes upon activation of the wild type Notch1 receptor by the Delta-like 1 ligand.
Detailed phenotypic analysis of cellular responses to NOTCH1 inhibition in T-ALL showed that blocking NOTCH1 signaling with shRNA knock-down or GSI treatment in PTEN-positive T-ALL cells, induced cellular responses typically associated with inhibition of the PI3K-AKT signaling pathway, such as decreased cell size (Fig. 2a,c) , reduced glucose metabolism (Fig. 3d,e) and increased autophagy (Supplementary Fig. 4 online). Analysis of glucose use in GSI-sensitive/PTEN-positive HPB-ALL cells demonstrated significant reductions in glucose uptake and glucose oxidation upon NOTCH1 inhibition, and increased levels of glucose uptake and glucose oxidation which were not affected by GSI treatment in GSI-resistant/PTEN-null P12-ICHIKAWA cells (Fig. 3d-g). These results suggest that a NOTCH1-PTEN-AKT regulatory axis mediates the physiologic upregulation of the PI3K-AKT signaling pathway during normal thymocyte development, while aberrant NOTCH1 signaling in T-ALL converts this developmental transcriptional network to a mechanism that promotes leukemic cell growth.
HES1 and MYC regulate PTEN expression downstream of NOTCH1
The inhibitory effect of NOTCH1 signaling on PTEN expression conflicts with the well-established role of NOTCH1 as transcriptional activator. Thus, we considered that inhibition of PTEN by NOTCH1 could be mediated by HES1 and MYC, two transcription factors directly controlled by NOTCH129-32. ChIP-on-chip analysis of promoter occupancy by HES1, MYC and NOTCH1 in the HPB-ALL leukemic cell line identified binding of both MYC and HES1 to regulatory sequences in the PTEN proximal promoter (Supplementary Fig. 5 online); a result that was fully validated by quantitative ChIP assays (Fig. 4a-b). While HES1 bound in the vicinity of the PTEN transcription initiation site, MYC occupancy of the PTEN promoter comprised at least two regulatory regions located around positions -1,400 and -500 base pairs upstream of the PTEN gene, as well as the region occupied by HES1, 200 bp downstream from the PTEN transcription initiation site.
Fig. 4. HES1 and MYC regulate PTEN expression downstream of NOTCH1.
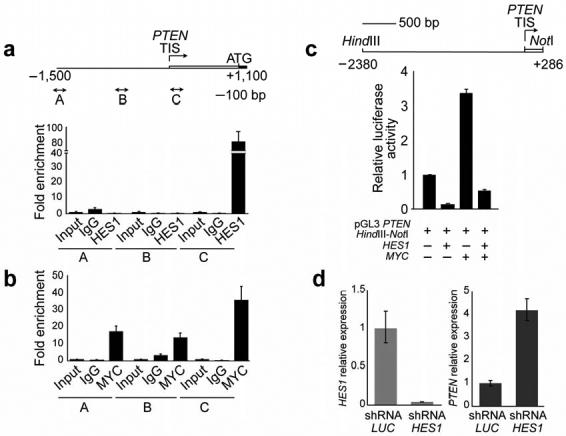
(a) Quantitative ChIP analysis of HES1 binding to PTEN promoter sequences. (b) Quantitative ChIP analysis of c-MYC binding to PTEN promoter sequences. Data are means ± standard deviation of triplicates. TIS: transcription initiation site. (c) Effects of HES1 and MYC expression in PTEN promoter activity. Luciferase reporter assays were performed in 293T cells with a 2,666 bp PTEN promoter construct (pGL3 PTEN HindIII-NotI). Data are means +/- s.d. of triplicates. (d) Lentiviral shRNA knock-down of HES1 in CUTLL1 cells induces transcriptional upregulation of PTEN. Expression of a control shRNA targeting the luciferase gene (shRNA LUC) was used as control.
The functional significance of HES1 and MYC binding to the PTEN promoter was demonstrated in luciferase reporter assays, which showed that HES1 expression induced a marked reduction in the activity of a 3 kb PTEN promoter construct (14% of control), while MYC expression resulted in a substantial increase in luciferase expression (334% over basal levels) (Fig. 4c). Promoter batching analysis demonstrated redundancy of regulatory sequences occupied by MYC in the activity of PTEN reporter constructs and confirmed the dominant role of HES1 as negative regulator of the PTEN promoter (data not shown). Furthermore, shRNA knock down of HES1 induced transcriptional upregulation of PTEN transcript levels in T-ALL cells (Fig. 4d). These findings are in agreement with the analysis of Hes1 knock-out mice which showed an essential role of this transcriptional repressor downstream of Notch1 in promoting cell growth and proliferation during thymocyte development33.
Synergistic effect of Notch and PI3K-AKT in Drosophila
We have established a highly specific forward genetic screen in Drosophila to search for genes that functionally cooperate with Notch pathway and that convert tissue overgrowths into tumors (see 34,35). The significance of mutational loss of PTEN in sustaining cell growth upon inhibition of NOTCH1 signaling on T-ALL was further reinforced by the independent identification of a close relationship among Notch and Akt1 during tumorigenesis in this model (Fig. 5 and Supplementary Figs. 6-8 online).
Fig. 5. Interaction of Notch and Pten/PI3K/Akt signaling in growth control and tumorigenesis in Drosophila.
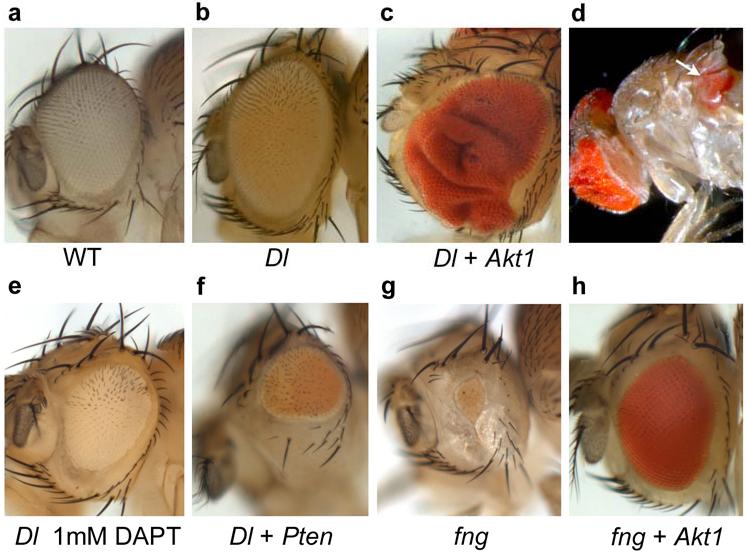
(a-h) The size and morphology of female adult eyes from identically reared animals [at 25°C] were scored in six different genotypes: (a) wild type; (b) ey-Gal4>Dl; (c-d) ey-Gal4>Dl/+; GS1D233C (Akt1)/+; (e) ey-Gal4>Dl/+ treated with 1mM DAPT. (f) ey-Gal4>Dl/+; UAS-Pten/+ (g) ey-Gal4>UAS-fng (h) ey-Gal4>UAS-fng/+; GS1D233C (Akt1)/+. (b) Generalized expression of Delta by the eye-specific driver eyeless (ey)-Gal4 results in mild eye overgrowth (130% eye size compared with wild type). (c and d) Co-overexpression of Delta and Akt1 in the developing eye results in massive eye overgrowth (190-230% eye size) in 100% of the flies analyzed (n>200) (c) and metastases in distant tissues within the thorax (7.14% of mutant flies, n=232) (d, white arrow). (e) Inhibition of Notch receptor proteolysis by nonlethal doses (1mM) of the GSI DAPT inhibits Delta-induced overgrowth and results in flies with reduced eyes (eye size of 72% compared with wild type size) and wings smaller than wild type (see Supplementary Fig. 9 online). (f) Gain of Pten results in strong suppression of Delta-mediated eye overgrowth (eye size of 46% compared with siblings ey-Gal4>Dl) (n>160). (g) Overexpression of fringe (UAS-fng), a Notch pathway modulator, results in Notch inhibition in the eye and hence a small eye defect (5-13% eye size). (h) Gain of expression of Akt1 gene using the GS1D233C P-element fully rescued growth defect (95-106% eye size) caused by reducing Notch pathway activation (see also Supplementary Figs. 6 and 7).
We used a Drosophila strain that overexpressed the Notch ligand Delta, which caused a ‘large eye’ phenotype due to overgrowth36 (Fig. 5b), coupled to the Gene Search method to systematically generate ‘gain-of-expression’ mutations34,35. In this screen we identified a GS line 1D233C that enforced expression of the Akt1 gene (Supplementary Fig. 6a online), and that when coupled to Delta overexpression produced massive overgrowths and tumors (Fig. 5c,d and Supplementary Fig. 6d online), leading to disseminated eye-derived secondary growths inside the thorax and abdomen in about 7,14% of the flies (n=232, Fig. 5d). Eye overgrowths and secondary eye growths were also observed, albeit with less occurrence (2,22%, n=323), in animals with Delta overexpression combined with a transgene of the Drosophila Phosphatidylinositol 3-OH kinase 92E (Dp110) (Supplementary Figs. 6b-c and 7 online). Eye growth was tightly associated with phospho Akt1 (pAKT) levels. Thus, phospho Akt1 (pAkt) was found to be increased in the eye imaginal discs overexpressing Delta (‘large eye’) and more markedly augmented in the eye imaginal discs that overexpressed Delta and Akt1 (eye overgrowth and tumor phenotype) (Supplementary Fig. 8a-d online). Pharmacological inhibition of Notch receptor proteolysis by a GSI (DAPT) prevented eye growth induced by Delta overexpression and resulted in a smalleye defect (Fig. 5e and Supplementary Fig. 9 online), recapitulating the defective growth phenotype of PTEN-positive T-ALL cells treated with GSI. Importantly, a similar small-eye phenotype was induced upon overexpression of Pten, indicating that inhibition of Akt1 phosphorylation can block the growth promoting effects of Notch hyperactivation (Fig. 5f). Moreover, loss of Akt1 (analyzed in genetic mosaics using an Akt1q null allele, Supplementary Fig. 6e-j online) also blocked Delta-induced eye overgrowth. Note that, in contrast to previous reports, we found that inactivation of Akt1 does affect cell number (see Supplementary Fig. 6e-g and j online), suggesting that, as its mammalian counterpart, Drosophila Akt1 positively regulates cell-cycle progression.
Consistently, the enforced expression of Akt1 by use of the GS1D233C (Supplementary Fig. 6a online), fully rescued the growth and cell proliferation arrest caused by a reduction of Notch signaling due to generalized expression of the fringe (fng) gene36-38 (Fig. 5g-h), recapitulating the restoration of cell growth induced by constitutive active AKT expression in GSI-sensitive/PTEN-positive T-ALL cells treated with CompE, and the resistance to GSI treatment phenotype of PTEN-null T-ALL cell lines (Figs. 1 and 2). Together, these results demonstrate that activation of Akt1 restores growth and cell proliferation upon Notch inhibition and that aberrant Akt1 activity synergizes with Notch hyperactivation to promote tumor development in vivo.
Secondary oncogene addiction in PTEN-null T-ALL cells
Based on our results showing that loss of PTEN in T-ALL cells may result in resistance to NOTCH1 inhibition, we hypothesized that GSI-resistance could occur at the expense of making PTEN-null T-ALL cells addicted to constitutive AKT signaling (Fig. 6a). Importantly, PTEN deficient tumors have been shown to be hypersensitive to inhibition of the PI3K signaling pathway 39,40 and reintroduction of PTEN in the GSI-resistant/PTEN-null Jurkat T-cell leukemia cell line has been shown to induce cell cycle arrest, decreased cell size and increased apoptosis 41.
Fig. 6. Transcriptional networks downstream of NOTCH1 in T-ALL and effects of pharmacologic inhibition of AKT in T-ALL cells.
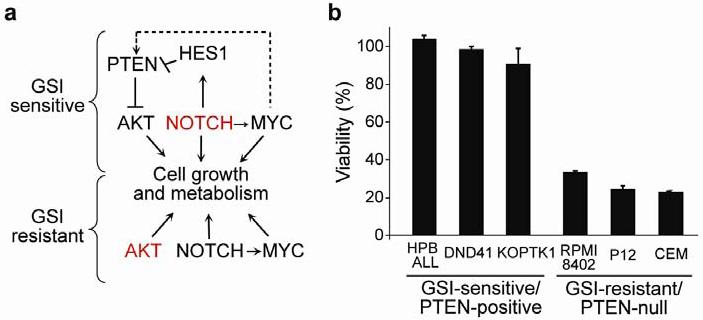
a. Schematic representation of the transcriptional regulatory networks controlling cell growth downstream of NOTCH1 in PTEN-positive/GSI-sensitive and PTEN-null/GSI-resistant T-ALL cells. The dashed arrow indicates a weak positive effect of MYC on PTEN expression compared with the strong negative transcriptional effects of HES1 in the promoter of this gene. b. Relative cell growth of GSI-sensitive/PTEN-positive and GSI-resistant/PTEN-null T-ALL cell lines treated with the SH6 AKT inhibitor at 10 μM concentration for 72 hours. Data are means ± standard deviation of triplicates.
Treatment of GSI-sensitive/PTEN-positive and GSI-resistant/PTEN-null T-ALL cells with SH-6, a phosphatidylinositol analog inhibitor of AKT showed that pharmacologic inhibition of AKT has strong antileukemic effects in GSI-resistant/PTEN-null T-ALLs but not in GSI-sensitive/PTEN-positive cells (Fig. 6b). Similarly, retroviral expression of PTEN in GSI-resistant T-ALL cells induced a marked reduction in cell size and G1 cell cycle arrest (Supplementary Fig. 10 online). Thus, aberrant activation of the PI3K-AKT pathway makes PTEN-null T-ALL cells dependent on high levels of AKT signaling for maintenance of the malignant phenotype in a clear example of secondary oncogene addiction.
Discussion
Targeted therapies for human tumors rely in the “addiction” of cancer cells to oncogenic signals driving tumor cell growth proliferation and survival 42,43.
The NOTCH1 signaling pathway is a critical controller of cell fate decisions and a key regulator of cell growth and metabolism during T-cell development and transformation. Importantly, Notch signals regulate the trophic state (cell size, glucose uptake and glycolysis) of T-cell precursors through activation of the PI3K-Akt signaling pathway 28. Here show that NOTCH1 controls a transcriptional network regulating PTEN expression and the activity of the PI3K-AKT signaling pathway in normal thymocytes and in leukemic T cells. Similarly, Notch signaling and the PI3K-AKT pathway synergize in vivo in a Drosophila model of Notch-induced tumorigenesis. Importantly, activation of Akt reverses a cell growth defect phenotype induced by the loss of Notch signaling in this model. Similarly, mutational loss of PTEN and consequent hyperactivation of AKT is associated with resistance to NOTCH1 inhibition in human T-ALL.
Overall, these findings suggest that the regulatory circuit linking NOTCH1 signaling with PTEN expression and PI3K-AKT activity may contribute to NOTCH1-induced transformation and could mediate, at least in part, the cellular response to NOTCH1 inhibitors in T-ALL. According to this model, mutational loss of PTEN in T-ALL would turn this moderate and tightly controlled upregulation of PI3K-AKT downstream of NOTCH1, into an aberrant and constitutively active oncogenic signal that would support cell growth and metabolism independently of NOTCH1 in PTEN-null T-ALL cells treated with GSIs (Fig. 6a). Finally, our data shows that bypass of dependence on aberrant NOTCH1 signaling for leukemic cell-growth by mutational loss of PTEN induces an oncogene addiction switch that renders T-ALL cells addicted to constitutively active AKT signaling.
Our results warrant further studies to test the efficacy of combined PI3K/AKT and NOTCH1-directed therapies in human cancer.
Methods
DNA microarray analysis
We extracted RNA from duplicate cultures of GSI-sensitive (ALL-SIL, CUTLL1, DND41, HPB-ALL, KOPTK1) and GSI-resistant (CCRF-CEM, MOLT3, P12 ICHIKAWA, PF382 and RPMI8402) T-ALL cell lines treated for 24 h with vehicle (DMSO) or 500 nM CompE and prepared samples for analysis with Affymetrix Human U133 Plus 2.0 arrays according to the manufacturer's instructions as previously described 44. Interarray intensity differences were normalized with Dchip 45. To establish the correlation of expression data with GSI-sensitive (class 0) and GSI-resistant (class 1) groups we performed Nearest-neighbor analysis using the signal-to-noise statistic (μclass 0 - μclass 1)/ (σ class 0 + σ class 1).
PTEN mutational analysis
We analyzed PTEN transcripts from RNA extracted from cryopreserved lymphoblast samples by direct bidirectional DNA sequencing. Analysis of PTEN exons 1-9 in additional diagnostic DNA samples and in paired diagnostic and relapse DNA samples from T-ALL patients enrolled in AIEOP-BFM Study Group protocols was performed by SURVEYOR digestion of DNA heteroduplexes, and the Transgenomic WAVE Nucleic Acid High Sensitivity Fragment Analysis system (WAVE HS; Transgenomic, Inc., Cambridge, MA), and verified by DNA sequencing.
OP9 cultures and expression analysis of DN3 cells
OP9-DL1 and OP9-control cells were generated from the OP9 bone marrow stromal cell line and maintained as described 46. Fetal liver (FL) was harvested from timed-pregnant Rag2-/- females on day 14 or 15 of gestation and single-cell suspensions were generated by disruption through a 40 μm nylon mesh using a syringe plunger. CD24lo/- FL cells, enriched for hematopoietic progenitor cells, were obtained by CD24 antibody and complement mediated lysis, and subsequently cultured with OP9-DL1 cell monolayers for T lineage differentiation, as described 47. All cultures were supplemented with 1 ng/mL mouse IL-7 and 5 ng/mL human recombinant Flt-3 ligand (hrFlt3L; Peprotech). CD44- CD25+ GFP- DN3 cells were purified by cell sorting from day 7 cultures, as described 47, and further cultured for 1-2 days with either OP9-DL1 or OP9-control cells in the presence of cytokines, as above. CD45+ GFP- DN3 cells were sort purified from cocultures to exclude OP9 cells prior to quantitative real-time PCR analysis.
Metabolic assays
We analyzed glucose uptake and oxidation as previously described48,49 in T-ALL cells treated with GSI (CompE 100nM for 96 h) or vehicle only (DMSO) controls.
ChIP-on-chip and quantitative ChIP analysis
NOTCH1 (Val1744 antibody, Cell Signaling Technologies), HES1 (H-140, Santa Cruz Biotechnology) and MYC (N-262 antibody, Santa Cruz Biotechnology) immunoprecipitates and control genomic DNA of HPB-ALL cells were differentially labeled with Cy3 and Cy5 and hybridized to the Agilent Proximal Promoter Arrays following standard procedures. To analyze visualize the binding ratios for probes located in the PTEN proximal promoter we used the Chip Analytics 1.1 software (Agilent Technologies) and the UCSC Genome Browser. For the analysis of ChIP enrichment of PTEN promoter sequences (-1492 to -1343; -612 to -445, and +118 to +278 from the transcription initiation site) in control genomic DNA (used as reference), and in chromatin immunoprecipitates performed with antibodies against HES1 (H-140, Santa Cruz Biotechnology), MYC (N262, Santa Cruz Biotechnology) and IgG (negative control) we performed real-time PCR using ACTB genomic sequence levels as loading control.
Overexpression of Akt1 gene in Drosophila
The Gene Search (GS) line 1D233C was isolated in a gain-of-expression genetic screen aimed at identifying genes that interact with the Notch pathway and that influence growth and tumorigenesis (design of the genetic screen is described in34). Genomic DNA flanking the P-element insertion in the GS1D233C was recovered by inversed PCR (http://www.fruitfly.org/about/methods) and sequenced. A BLAST search with each sequence produced perfect matches to Akt1 gene at the interval 89B6 (chromosome 3R position 11925492-11925493) (Supplementary Fig. 6a online). The GS P-element lines allow Gal4-dependent inducible expression of sequences flanking the insertion site of the GS element in both directions. Polymerase chain reaction with reverse transcriptase (RT-PCR) confirmed that transcription of the Akt1 gene is induced by the GS1D233 in response to Gal4 activation (data not shown).
Supplementary Material
Acknowledgements
We thank A. T. Look and M. Minden for valuable clinical samples; D. Ferres-Marco for the GS1D233C line; E. Ballesta for histological sections of dDp110; T. Yoshimori, R. Dalla Favera, W. Ai, D. Accili and W. Hahn for reagents, V. Miljkovic for assistance with DNA sequencing and microarray hybridization and B. Weinstein, R. Baer, T. Diaccovo, and C. Lopez-Otin for critical review of the manuscript. This work was supported by the Fondazione Città Della Speranza (G.B.), the ‘Ministerio de Educacion y Ciencia’ from Spain and the ‘Asociación Española Contra el Cancer’ A.E.C.C. (M.D.), NIH grant CA120196, the WOLF Foundation, the Charlotte Geyer Foundation, the Golfers Against Cancer Foundation and the Leukemia and Lymphoma Society (grant 1287-08) (A.A.F.). Adolfo Ferrando is a Leukemia & Lymphoma Society Scholar.
Microarray data are available in GEO (accession number GSE5682).
References
- 1.Grabher C, von Boehmer H, Look AT. Notch 1 activation in the molecular pathogenesis of T-cell acute lymphoblastic leukaemia. Nat Rev Cancer. 2006;6:347–59. doi: 10.1038/nrc1880. [DOI] [PubMed] [Google Scholar]
- 2.Weng AP, et al. Activating mutations of NOTCH1 in human T cell acute lymphoblastic leukemia. Science. 2004;306:269–71. doi: 10.1126/science.1102160. [DOI] [PubMed] [Google Scholar]
- 3.Stylianou S, Clarke RB, Brennan K. Aberrant activation of notch signaling in human breast cancer. Cancer Res. 2006;66:1517–25. doi: 10.1158/0008-5472.CAN-05-3054. [DOI] [PubMed] [Google Scholar]
- 4.Purow BW, et al. Expression of Notch-1 and its ligands, Delta-like-1 and Jagged-1, is critical for glioma cell survival and proliferation. Cancer Res. 2005;65:2353–63. doi: 10.1158/0008-5472.CAN-04-1890. [DOI] [PubMed] [Google Scholar]
- 5.Pahlman S, Stockhausen MT, Fredlund E, Axelson H. Notch signaling in neuroblastoma. Semin Cancer Biol. 2004;14:365–73. doi: 10.1016/j.semcancer.2004.04.016. [DOI] [PubMed] [Google Scholar]
- 6.Wen C, Metzstein MM, Greenwald I. SUP-17, a Caenorhabditis elegans ADAM protein related to Drosophila KUZBANIAN, and its role in LIN-12/NOTCH signalling. Development. 1997;124:4759–67. doi: 10.1242/dev.124.23.4759. [DOI] [PubMed] [Google Scholar]
- 7.Struhl G, Greenwald I. Presenilin-mediated transmembrane cleavage is required for Notch signal transduction in Drosophila. Proc Natl Acad Sci U S A. 2001;98:229–34. doi: 10.1073/pnas.011530298. [DOI] [PMC free article] [PubMed] [Google Scholar]
- 8.De Strooper B, et al. A presenilin-1-dependent gamma-secretase-like protease mediates release of Notch intracellular domain. Nature. 1999;398:518–22. doi: 10.1038/19083. [DOI] [PubMed] [Google Scholar]
- 9.Mumm JS, et al. A ligand-induced extracellular cleavage regulates gamma-secretase-like proteolytic activation of Notch1. Mol Cell. 2000;5:197–206. doi: 10.1016/s1097-2765(00)80416-5. [DOI] [PubMed] [Google Scholar]
- 10.Hansson EM, Lendahl U, Chapman G. Notch signaling in development and disease. Semin Cancer Biol. 2004;14:320–8. doi: 10.1016/j.semcancer.2004.04.011. [DOI] [PubMed] [Google Scholar]
- 11.Mumm JS, Kopan R. Notch signaling: from the outside in. Dev Biol. 2000;228:151–65. doi: 10.1006/dbio.2000.9960. [DOI] [PubMed] [Google Scholar]
- 12.Seiffert D, et al. Presenilin-1 and -2 are molecular targets for gamma-secretase inhibitors. J Biol Chem. 2000;275:34086–91. doi: 10.1074/jbc.M005430200. [DOI] [PubMed] [Google Scholar]
- 13.Palomero T, et al. CUTLL1, a novel human T-cell lymphoma cell line with t(7;9) rearrangement, aberrant NOTCH1 activation and high sensitivity to gamma-secretase inhibitors. Leukemia. 2006;20:1279–87. doi: 10.1038/sj.leu.2404258. [DOI] [PubMed] [Google Scholar]
- 14.Parsons R. Human cancer, PTEN and the PI-3 kinase pathway. Semin Cell Dev Biol. 2004;15:171–6. doi: 10.1016/j.semcdb.2003.12.021. [DOI] [PubMed] [Google Scholar]
- 15.Yilmaz OH, et al. Pten dependence distinguishes haematopoietic stem cells from leukaemia-initiating cells. Nature. 2006;441:475–82. doi: 10.1038/nature04703. [DOI] [PubMed] [Google Scholar]
- 16.Suzuki A, et al. High cancer susceptibility and embryonic lethality associated with mutation of the PTEN tumor suppressor gene in mice. Curr Biol. 1998;8:1169–78. doi: 10.1016/s0960-9822(07)00488-5. [DOI] [PubMed] [Google Scholar]
- 17.Podsypanina K, et al. Mutation of Pten/Mmac1 in mice causes neoplasia in multiple organ systems. Proc Natl Acad Sci U S A. 1999;96:1563–8. doi: 10.1073/pnas.96.4.1563. [DOI] [PMC free article] [PubMed] [Google Scholar]
- 18.Di Cristofano A, Pesce B, Cordon-Cardo C, Pandolfi PP. Pten is essential for embryonic development and tumour suppression. Nat Genet. 1998;19:348–55. doi: 10.1038/1235. [DOI] [PubMed] [Google Scholar]
- 19.Suzuki A, et al. T cell-specific loss of Pten leads to defects in central and peripheral tolerance. Immunity. 2001;14:523–34. doi: 10.1016/s1074-7613(01)00134-0. [DOI] [PubMed] [Google Scholar]
- 20.Hagenbeek TJ, et al. The loss of PTEN allows TCR alphabeta lineage thymocytes to bypass IL-7 and Pre-TCR-mediated signaling. J Exp Med. 2004;200:883–94. doi: 10.1084/jem.20040495. [DOI] [PMC free article] [PubMed] [Google Scholar]
- 21.Chang H, et al. Analysis of PTEN deletions and mutations in multiple myeloma. Leuk Res. 2006;30:262–5. doi: 10.1016/j.leukres.2005.07.008. [DOI] [PubMed] [Google Scholar]
- 22.Aggerholm A, Gronbaek K, Guldberg P, Hokland P. Mutational analysis of the tumour suppressor gene MMAC1/PTEN in malignant myeloid disorders. Eur J Haematol. 2000;65:109–13. doi: 10.1034/j.1600-0609.2000.90181.x. [DOI] [PubMed] [Google Scholar]
- 23.Sakai A, Thieblemont C, Wellmann A, Jaffe ES, Raffeld M. PTEN gene alterations in lymphoid neoplasms. Blood. 1998;92:3410–5. [PubMed] [Google Scholar]
- 24.Ferrando AA, et al. Prognostic importance of TLX1 (HOX11) oncogene expression in adults with T-cell acute lymphoblastic leukaemia. Lancet. 2004;363:535–6. doi: 10.1016/S0140-6736(04)15542-6. [DOI] [PubMed] [Google Scholar]
- 25.Ferrando AA, et al. Gene expression signatures define novel oncogenic pathways in T cell acute lymphoblastic leukemia. Cancer Cell. 2002;1:75–87. doi: 10.1016/s1535-6108(02)00018-1. [DOI] [PubMed] [Google Scholar]
- 26.Sulis ML, Parsons R. PTEN: from pathology to biology. Trends Cell Biol. 2003;13:478–83. doi: 10.1016/s0962-8924(03)00175-2. [DOI] [PubMed] [Google Scholar]
- 27.Maehama T, Dixon JE. The tumor suppressor, PTEN/MMAC1, dephosphorylates the lipid second messenger, phosphatidylinositol 3,4,5-trisphosphate. J Biol Chem. 1998;273:13375–8. doi: 10.1074/jbc.273.22.13375. [DOI] [PubMed] [Google Scholar]
- 28.Ciofani M, Zuniga-Pflucker JC. Notch promotes survival of pre-T cells at the beta-selection checkpoint by regulating cellular metabolism. Nat Immunol. 2005;6:881–8. doi: 10.1038/ni1234. [DOI] [PubMed] [Google Scholar]
- 29.Palomero T, et al. NOTCH1 directly regulates c-MYC and activates a feed-forward-loop transcriptional network promoting leukemic cell growth. Proc Natl Acad Sci U S A. 2006;103:18261–6. doi: 10.1073/pnas.0606108103. [DOI] [PMC free article] [PubMed] [Google Scholar]
- 30.Jarriault S, et al. Signalling downstream of activated mammalian Notch. Nature. 1995;377:355–8. doi: 10.1038/377355a0. [DOI] [PubMed] [Google Scholar]
- 31.Satoh Y, et al. Roles for c-Myc in self-renewal of hematopoietic stem cells. J Biol Chem. 2004;279:24986–93. doi: 10.1074/jbc.M400407200. [DOI] [PubMed] [Google Scholar]
- 32.Weng AP, et al. c-Myc is an important direct target of Notch1 in T-cell acute lymphoblastic leukemia/lymphoma. Genes Dev. 2006;20:2096–109. doi: 10.1101/gad.1450406. [DOI] [PMC free article] [PubMed] [Google Scholar]
- 33.Kaneta M, et al. A role for pref-1 and HES-1 in thymocyte development. J Immunol. 2000;164:256–64. doi: 10.4049/jimmunol.164.1.256. [DOI] [PubMed] [Google Scholar]
- 34.Ferres-Marco D, et al. Epigenetic silencers and Notch collaborate to promote malignant tumours by Rb silencing. Nature. 2006;439:430–6. doi: 10.1038/nature04376. [DOI] [PubMed] [Google Scholar]
- 35.Dominguez M. Interplay between Notch signaling and epigenetic silencers in cancer. Cancer Res. 2006;66:8931–4. doi: 10.1158/0008-5472.CAN-06-1858. [DOI] [PubMed] [Google Scholar]
- 36.Dominguez M, de Celis JF. A dorsal/ventral boundary established by Notch controls growth and polarity in the Drosophila eye. Nature. 1998;396:276–8. doi: 10.1038/24402. [DOI] [PubMed] [Google Scholar]
- 37.Papayannopoulos V, Tomlinson A, Panin VM, Rauskolb C, Irvine KD. Dorsal-ventral signaling in the Drosophila eye. Science. 1998;281:2031–4. doi: 10.1126/science.281.5385.2031. [DOI] [PubMed] [Google Scholar]
- 38.Cho KO, Choi KW. Fringe is essential for mirror symmetry and morphogenesis in the Drosophila eye. Nature. 1998;396:272–6. doi: 10.1038/24394. [DOI] [PubMed] [Google Scholar]
- 39.DeGraffenried LA, et al. Reduced PTEN expression in breast cancer cells confers susceptibility to inhibitors of the PI3 kinase/Akt pathway. Ann Oncol. 2004;15:1510–6. doi: 10.1093/annonc/mdh388. [DOI] [PubMed] [Google Scholar]
- 40.She QB, Solit D, Basso A, Moasser MM. Resistance to gefitinib in PTEN-null HER-overexpressing tumor cells can be overcome through restoration of PTEN function or pharmacologic modulation of constitutive phosphatidylinositol 3'-kinase/Akt pathway signaling. Clin Cancer Res. 2003;9:4340–6. [PubMed] [Google Scholar]
- 41.Xu Z, Stokoe D, Kane LP, Weiss A. The inducible expression of the tumor suppressor gene PTEN promotes apoptosis and decreases cell size by inhibiting the PI3K/Akt pathway in Jurkat T cells. Cell Growth Differ. 2002;13:285–96. [PubMed] [Google Scholar]
- 42.Weinstein IB. Cancer. Addiction to oncogenes--the Achilles heal of cancer. Science. 2002;297:63–4. doi: 10.1126/science.1073096. [DOI] [PubMed] [Google Scholar]
- 43.Weinstein IB, Joe AK. Mechanisms of disease: Oncogene addiction--a rationale for molecular targeting in cancer therapy. Nat Clin Pract Oncol. 2006;3:448–57. doi: 10.1038/ncponc0558. [DOI] [PubMed] [Google Scholar]
- 44.Basso K, et al. Reverse engineering of regulatory networks in human B cells. Nat Genet. 2005;37:382–90. doi: 10.1038/ng1532. [DOI] [PubMed] [Google Scholar]
- 45.Li C, Wong WH. Model-based analysis of oligonucleotide arrays: expression index computation and outlier detection. Proc Natl Acad Sci U S A. 2001;98:31–6. doi: 10.1073/pnas.011404098. [DOI] [PMC free article] [PubMed] [Google Scholar]
- 46.Schmitt TM, Zuniga-Pflucker JC. Induction of T cell development from hematopoietic progenitor cells by delta-like-1 in vitro. Immunity. 2002;17:749–56. doi: 10.1016/s1074-7613(02)00474-0. [DOI] [PubMed] [Google Scholar]
- 47.Ciofani M, et al. Obligatory role for cooperative signaling by pre-TCR and Notch during thymocyte differentiation. J Immunol. 2004;172:5230–9. doi: 10.4049/jimmunol.172.9.5230. [DOI] [PubMed] [Google Scholar]
- 48.Swainson L, et al. Glucose transporter 1 expression identifies a population of cycling CD4+ CD8+ human thymocytes with high CXCR4-induced chemotaxis. Proc Natl Acad Sci U S A. 2005;102:12867–72. doi: 10.1073/pnas.0503603102. [DOI] [PMC free article] [PubMed] [Google Scholar]
- 49.Doughty CA, et al. Antigen receptor-mediated changes in glucose metabolism in B lymphocytes: role of phosphatidylinositol 3-kinase signaling in the glycolytic control of growth. Blood. 2006;107:4458–65. doi: 10.1182/blood-2005-12-4788. [DOI] [PMC free article] [PubMed] [Google Scholar]
Associated Data
This section collects any data citations, data availability statements, or supplementary materials included in this article.