

Abstract
In this study, we fabricated electrospun silica nanofiber membranes and investigated their use in biomolecular sensing. The diameter, porosity and surface-to-volume ratio of nanofiber membranes were investigated under different fabrication conditions. Using this type of nanofiber membrane, enzyme-linked immunosorbent assay (ELISA) was performed, and the results were compared with those obtained with conventional ELISA using polystyrene well plates. The minimum detectable concentration was determined as 0.19 ng ml−1 (1.6 pM), which is 32 times lower than that of conventional ELISA. In addition, the detection time for all processes for the nanofiber membrane was reduced to 1 h, compared with 1 day for conventional ELISA. The increased sensitivity, faster reaction time, and affordability of the nanofiber membrane make it well suited for bio-chip use.
1. Introduction
Many fabrication methods for 1D nanostructures have emerged in recent years, driven by various potential applications such as composites, protective clothing, catalysis, electronics, medicine, filtration, and agriculture [1–5]. These structures were created by self-assembly techniques such as vapor–liquid–solid growth and solution-liquid–solid growth, template-based synthesis, and chemical vapor deposition, which all are relatively expensive. In addition to these techniques, electrospinning has been developed to fabricate relatively long and continuous polymer-based nanofibers at a lower cost [6–9]. Electrospinning involves using a strong electrostatic field to overwhelm the surface tension of the polymer solution at the needle tip, which causes the polymer solution to be extruded in the form of a liquid jet. While the polymer jet travels to the counter electrode, the fast evaporation of the solvent transforms the jet into a solid fiber with a small diameter. The diameters of electrospun fibers range from micrometers to nanometers, depending on parameters such as the selection of polymers, electric-field strength, and pumping rates [10]. Metal or semiconductor oxide fibers can also be electrospun by adding oxide precursors to the polymer solutions and removing the polymer parts by calcination [11–15].
Enzyme-linked immunosorbent assay (ELISA) is a technique commonly used in biomedical applications for detecting and quantifying proteins such as antibodies. It makes use of the property that an antibody will specifically conjugate to a target antigen; antigens of interest can thereby be detected with accuracy and sensitivity [16–18]. These assays are typically performed in ELISA 96-well plates. However, according to a clinical report [19], this process has low sensitivity and selectivity due to the poor efficiency of the hybridization. In addition, the conventional assay requires overnight hybridization, which is not practical for high-throughput screening.
In this investigation, to overcome these weaknesses of ELISA, we evaluated the properties of various nanofibers and utilized nanofiber membranes instead of polystyrene plates as the detection medium. The result was quick and highly sensitive ELISA. The large surface-to-volume ratio of the electrospun nanofiber membrane increased its efficiency in capturing target molecules. In addition, the membrane’s lower pore ratio reduced the required incubation time.
2. Experimental details
2.1. Materials
Materials used in the fabrication of electrospun fibers included polyvinylpyrrolidone (PVP, MW 1 300 000, Aldrich), spin-on-glass (SOG) intermediate coating solution (IC1-200, Futurrex), and butanol (Solvent Diluent SD4, Futurrex). In addition, the following materials were prepared for use in the ELISA studies: blocking agents (bovine serum albumin [BSA] and fetal bovine serum), primary antibodies (monoclonal mouse anti-FLAG M2 antibody [Sigma] and monoclonal mouse anti-c-Myc antibody [Sigma]), and secondary antibodies (goat anti-mouse horseradish peroxidase (HRP, Jackson ImmunoResearch Laboratories) and donkey anti-goat HRP (Jackson ImmunoResearch Laboratories)).
2.2. The fabrication of electrospun fibers
We investigated parameters of the electrospinning process by characterizing the influence of electric-field strength and polymer concentration on the morphologic properties and dimensions of the nanofibers. PVP polymer concentrations ranging from 0.16 to 0.48 g were mixed with 8 ml of SOG solution, which was diluted 20–80% with butanol. The influence of varying the dilution of SOG was studied in the presence of a constant PVP concentration of 0.04 g ml−1, whereas the effect of varying PVP concentration was investigated in the presence of 100% SOG. All solutions were magnetically stirred for 12 h. Each solution was then loaded into a plastic syringe with a 24-gauge stainless steel needle. The syringe pump (Pump 11 Plus, Harvard Apparatus) horizontally fed the liquid to the needle at 8 μl min−1. The needle was connected to the negative electrode of a high-voltage power supply (Series 230, Bertan), and a foil-covered collector served as the counter electrode; the distance between them was kept at 5 cm. Voltages from 3 to 7 kV, which corresponds to 0.6–1.4 kV cm−1 of electric-field strength, were applied. The electrospun fibers were collected on small pieces of aluminum foil, in the form of membranes. All samples were calcined in a furnace (Isotemp Muffle Furnace 550, Fisher Scientific) at 773 K for 12 h. The resulting silica nanofibers were examined by field-emission scanning electron microscopy (Leo 1530VP, Zeiss) at 5 kV.
2.3. Nonspecific binding with a primary antibody
To test our concept that an electrospun silica membrane can be used as the medium for protein detection and improve the detection limit of conventional ELISA, primary antibody was used to capture secondary antibody, and we investigated their binding abilities, as well as the amount of nonspecific binding between the primary antibody and the nanofiber membranes. The secondary antibody simulates the antigen of interest bound with enzyme markers. We used the silica membranes that had been electrospun from 0.04 g ml−1 PVP in an SOG solution with an 80:20 (SOG:butanol) volume ratio for 5 min at 7 kV; the fibers were collected on 2 cm-by-2 cm stainless steel meshes. There are two reasons why this condition was chosen. First, the nanofibers were made very stable and large amount of uniform nanofiber can be obtained under this condition. Second, the dimension of nanofibers is consistent. Two such membranes were placed on a glass slide and coated with different primary proteins overnight. One was coated with 10 μl of BSA (1 μg μl−1), designated protein A, as the reference, and the other was coated with the same volume of monoclonal mouse anti-FLAG M2 antibody (1 μg μl−1), designated protein B. Blocking with blocking agents (30 min) and washing with Tween 20/phosphate-buffered saline (PBS) (5 min) steps followed. Goat anti-mouse HRP, protein C, acted as the secondary antibody, and both membranes were coated with it for 30 min at room temperature. Membranes were then washed again with Tween 20/PBS 4 times, 10 min each time, at room temperature. Substrates (electrochemiluminescence detection reagents) were then applied to both membranes. The results were recorded on x-ray films for 10 s and 2 min (figure 1).
Figure 1.

Procedure for the protein-attachment test for electrospun silica nanofiber membranes and the corresponding x-ray photos after a 10 s short exposure and a 2 min long exposure. Proteins A, B, and C denote BSA, monoclonal mouse anti-FLAG M2 antibody, and goat anti-mouse HRP.
2.4. Specific-binding experiment with a secondary antibody
To investigate the efficiency of protein detection, a nanofiber membrane was integrated with a custom-made device (shown in figure 2). From the bottom to the top, a metal sink with a central aqueduct, a plastic plate with a 3 mm-diameter hole, a filter paper, the 1.3 cm-by-1.3 cm calcined nanofiber membrane, and a slightly larger stainless steel mesh were sandwiched. The plastic plate, filter paper, and mesh added mechanical strength to stabilize the fragile nanofiber membrane so that solutions could pass through the membrane without damaging it. A vacuum source was attached to the bottom sink to drain the solutions. The following substances were applied to the nanofiber membranes: 3 ml of a primary antibody (monoclonal mouse anti-c-Myc antibody, 5 μg ml−1), 3 ml of a blocking agent (BSA, 4%), and 2 ml each of two secondary antibodies (goat anti-mouse HRP, 3.1 ng ml−1, and donkey anti-goat HRP, 12.5 ng ml−1). The injection of each solution took about 10–15 min and was followed by washing with Tween 20/PBS. The membrane was then removed from the device and immersed in substrates (Glo Substrate Reagent Pack, R&D Systems) for 5 s. The reacted substrates were then transferred to the wells of an ELISA plate and measured, along with those directly from conventional ELISA.
Figure 2.
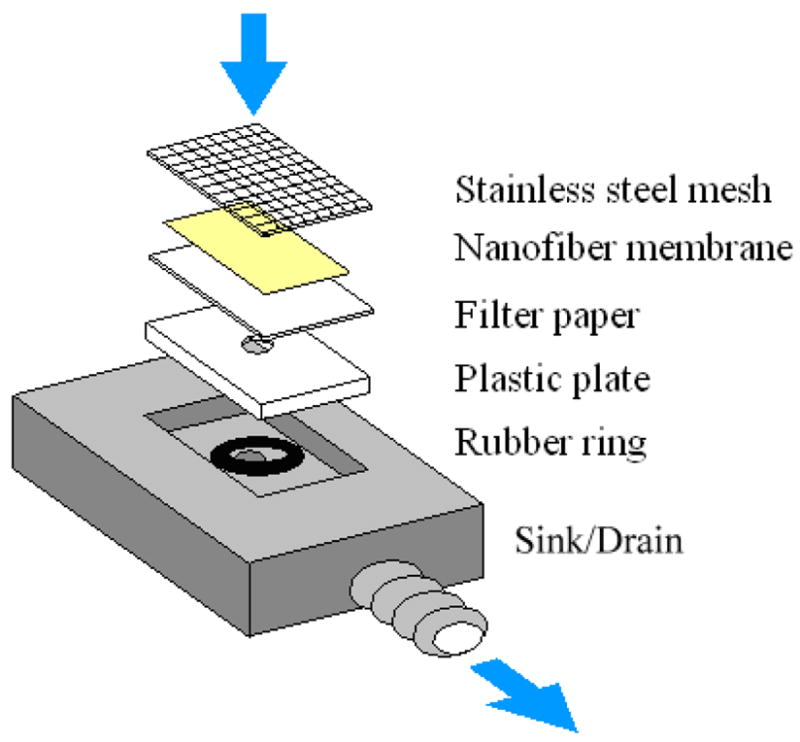
Layered structure of the nanofiber membrane device. Arrows indicate the direction of flow of the solution.
2.5. Sensitivity test
Following the same procedures used in the specific-binding experiment, we investigated the detection limit of nanofiber membranes by injecting several low concentration secondary anti-mouse antibody solutions ranging from 0.19 to 1.5 ng ml−1 into our custom-built sensing device. The fluorescent signals of the reacted substrate were measured by using a luminometer (TD 20/20, Turner Designs), and the fluorescent signals from the nanofiber membrane were compared with those from conventional ELISA.
3. Results and discussion
3.1. Scanning electron microscope characterization of electrospun silica nanofibers
SEM images of silica nanofibers fabricated with different process parameters are shown in figure 3. From these images, it is obvious that both the concentration of PVP and the volume ratio of SOG can affect the diameter of electrospun silica nanofibers. Averages and standard deviations of the fiber diameters are shown in figures 4(A) and (B). The average fiber diameters generally decreased as the solute concentration (the PVP concentration or SOG volume ratio in the solution) decreased or as the applied voltage increased. Fibers with diameters of less than 150 nm were fabricated when the volume ratio of SOG in the polymer solution was less than 80%. However, the minimum fiber diameter (57 nm) was fabricated by using either 40% SOG with 0.04 g ml−1 PVP at 7 kV or 100% SOG with 0.02 g ml−1 PVP at 7 kV. The variations among diameters obtained at each voltage tended to be larger when the average diameters were larger. Merged fibers were occasionally observed in the case of thicker fibers.
Figure 3.

Scanning electron micrographs showing the diameters of electrospun silica nanofibers fabricated with various concentrations of PVP and volume ratios of SOG. (A) PVP, 0.02 g ml−1; SOG, 100%, the inset shows a electrospun nanofiber with 57 nm in diameter. (B) PVP, 0.06 g ml−1; SOG, 100%. (C) PVP, 0.04 g ml−1; SOG, 40%. (D) PVP, 0.04 g ml−1; SOG, 80%. The following parameters were kept constant for all experiments: feeding rate of 8 μl min−1, deposition distance of 5 cm, applied voltage of 7 kV, needle size of 24 gauge, and calcination temperature of 773 K for more than 12 h.
Figure 4.

(A) The diameter of calcined silica nanofibers as a function of applied voltages for different PVP concentrations. (B) Nanofiber diameter as a function of applied voltages for different SOG concentrations. (C) Pore ratio as a function of deposition time. (D) Surface-to-volume ratio as a function of the diameter of nanofibers and the ELISA plate. The square indicates the surface-to-volume ratio of the nanofiber membrane used for protein detection. The surface-to-volume ratio of the ELISA plate is defined as the inner surface area of a single well divided by its volume.
The porosity of the electrospun membranes was also investigated using these SEM images. The pore ratio, defined as the pore area divided by the total area in the SEM image, was calculated by using image software; results are shown in figure 4(C). Reduced pore ratio was observed as the deposition time increased. This reduced pore ratio results because more fibers are collected on the electrode as deposition time increases. The molecule binding ability of the membrane can be determined by the cross section and mean free path of antibodies and antigens. The binding ability is expected to be higher, with higher collision cross section and shorter mean free path. These two factors are thought to be a function of the pore ratio of the membrane. Thus, the investigation of these relationships will be the next step. The surface-to-volume ratios, defined as the surface area divided by the volume, of the nanofiber membranes were also calculated from the SEM photos; these ratios ranged from 6750 000 to 77 000 000 under our experimental conditions. The membrane used in our protein detection had an average nanofiber diameter of 100 nm, which was associated with a surface-to-volume ratio of 40 000 000 (figure 4(D)) and porosity (pore ratio) of 0.0685.
3.2. Nonspecific binding of the primary antibody
The schematic diagram for the nonspecific protein conjugation experiment is shown in figure 1. After the conjugation experiment, x-ray films were exposed to the slides in a darkroom for 10 s (short exposure) and 2 min (long exposure) to record the signals. Dark regions in the photo images are where the fluorescence signals appeared. The average intensity inside the square region was calculated from the mean gray-scale value. The estimated emissions for protein A (nonspecific binding) were 0.2% for the short exposure and 0.7% for the long exposure. The estimated emissions for protein B (specific binding) were 11.2% for the short exposure and 48.9% for the long exposure. The emissions from the plain glass slides were also estimated, which were 0% for the short exposure and 0.9% for the long exposure for protein A, and 0% for the short exposure and 7% for the long exposure for protein B (not shown). The strong signal of the catalyzed substrate seen for the nanofiber membrane leads to three conclusions: (1) because of its high surface-to-volume ratio, the electrospun nanofiber membrane has better protein-attachment ability than does the plain glass slide; (2) the secondary antibody specifically binds to the corresponding primary antibody pre-coated on the electrospun nanofiber membrane; and (3) the procedures associated with specific binding of antibody and antigen in the ELISA technique can also be performed using the electrospun nanofiber membrane.
3.3. Specific binding of the secondary antibody
Results of the ELISA experiment are shown in figure 5. For the nonspecific-binding experiment (mouse and anti-goat antibody), there was not much difference in protein signal between the nanofiber-membrane technique and conventional ELISA. For the specific-binding experiment (mouse and anti-mouse antibody), the signal detected using the nanofiber membrane was ten times stronger than that detected using the conventional ELISA surface. This result indicates that there was almost no nonspecific interaction between the fibers and proteins.
Figure 5.
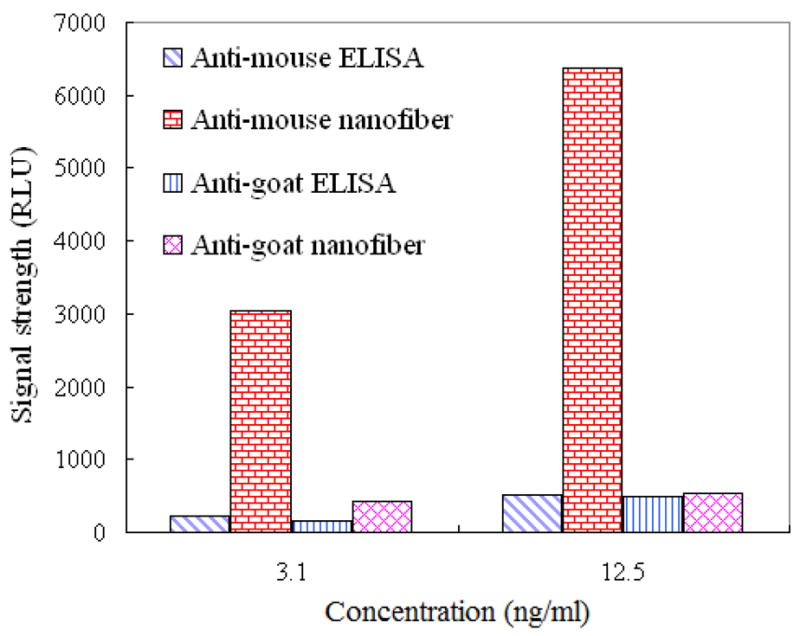
Signal strength (relative light unit, RLU) of specific and nonspecific-binding experiments performed using conventional ELISA and electrospun silica nanofiber membranes. From left to right for each experimental condition: specific binding on the ELISA plate, specific binding on the membranes, nonspecific binding on the ELISA plate, and nonspecific binding on the membranes. These results indicate that electrospun silica nanofiber membranes have much better sensitivity than does conventional ELISA.
3.4. Sensitivity test
Experimental time for every concentration of secondary anti-mouse antibody is about 1 h. The raw data collected in this experiment are relative light intensity and affected by the sensitivity setting of the luminometer. Therefore, they were plotted in terms of normalized fluorescence intensity as a function of concentration. Standard deviations were achieved by six measurements for each concentration of secondary anti-mouse antibody solutions (figure 6). The plot took the form of an exponential curve with an R-square value of 0.9926 for concentrations ranging from 0 to 1.5 ng ml−1 and the form of a linear curve with an R-square value of 0.9695 for low concentrations (0 to 0.8 ng ml−1). The curves represent that the signal strength measured by the luminometer can reflect the concentration of the secondary anti-mouse antibody applied in a nanofiber membrane, and is more accurate in low concentrations. For example, if the signal strength at 0 and 0.75 ng ml−1 is available, we can estimate the concentration of the antigen of interest between the two known concentration with very high accuracy by measuring its signal strength and performing linear interpolation. The minimum detectable concentration in our setup was 0.19 ng ml−1 (1.6 pM), 32 times lower than the minimum of 6.25 ng ml−1 for conventional ELISA. These results imply the advantage of silica electrospun membranes for detection of extremely low concentrations of molecules. The surface-to-volume ratio of each well (6.5 mm diameter and 11 mm deep) of an ELISA plate is about 700. Therefore, the improvement can be explained by the surface-to-volume ratio of single electrospun membrane, which, at 70 000 000, is much greater than that of a well of the 96-well ELISA plate, which is 700.
Figure 6.

Normalized signal strength as a function of secondary antibody concentrations on electrospun silica nanofiber membranes. The inset graph illustrates the linear relationship at low concentrations. The average fiber diameter of the membranes is 100 nm with standard deviation 30 nm.
From the perspective of experimental time as well, this new biosensing method using a nanofiber membrane is more favorable than conventional ELISA. In typical procedures, conventional ELISA requires a long incubation time because of the large diffusion length needed for the molecule to hybridize at the surface of the well plate. However, our nanofiber approach requires a short detection time because of the porous nature of the membrane and the flow-through feature of the approach; only about 2–3 ms is required for target molecules to collide with the antibody-coated nanofiber surface. The hybridization time required for the nonspecific binding of blocking buffer and the membrane, and the specific binding of primary and secondary antibody is about 10–15 min each.
Finally, the electrospun nanofiber membrane is a more economical choice for protein detection than is conventional ELISA. The 1.3 cm-by-1.3 cm electrospun membrane used in the experiment can be fabricated from a 40 μl polymer droplet. The low cost and the fact that each membrane is intended for single use imply that this detection method can be integrated with future lab-chip devices.
4. Conclusion
We have characterized the fabrication of electrospun silica nanofibers and their application to biomolecular sensing. We found that the dimensions of the nanofibers were controlled by process parameters such as electric-field strength and polymer concentration. The pore ratio of the membrane decreased with the deposition time, which can be a useful evaluation for our future work to investigate the relationship between the pore ratio and the binding ability. Using the electrospun membrane to detect antigens of interest resulted in a detection limit 32 times lower than that obtained using conventional ELISA with a polystyrene well plate. The results plotted as a linear curve for the low concentration range (0.19–0.75 ng ml−1) of the target protein. The linearity is helpful because we can reveal the quantities of the antigen of interest in a solution by measuring the electrochemiluminescence signals. The hybridization time was reduced from 1 day for ELISA to only 1 h with the new assay without a decrease in detection limit. The concept of using an electrospun nanofiber membrane as a biodetection medium has thus been realized, and our results confirm that the high surface-to-volume ratio of the membrane can greatly improve the capability of biosensing.
Acknowledgments
This research was supported by the National Science Foundation under contract number NSF-CMMI-0709283 and the Cancer Center Support Grant (CA 16672). Acquisition of the field-emission scanning electron microscope was supported by the National Science Foundation under grants DBI-0116835. Also thanks to the Army Breast Cancer Research Program grant W81XWH-06-1-0709 in supporting C-K Chou.
References
- 1.Dzenis Y. Science. 2004;304:1917–9. doi: 10.1126/science.1099074. [DOI] [PubMed] [Google Scholar]
- 2.Wang X, Drew C, Lee SH, Senecal KJ, Kumar J, Samuelson LA. Nano Lett. 2002;2:1273–5. [Google Scholar]
- 3.Yoshimotoa H, Shina YM, Teraia H, Vacantia JP. Biomaterials. 2003;24:2077–82. doi: 10.1016/s0142-9612(02)00635-x. [DOI] [PubMed] [Google Scholar]
- 4.Zeng J, Aigner A, Czubayko F, Kissel T, Wendorff JH, Greiner A. Biomacromolecules. 2005;6:1484–8. doi: 10.1021/bm0492576. [DOI] [PubMed] [Google Scholar]
- 5.Gibson P, Schreuder-Gibson H, Rivin D. Colloids Surf. 2001;A 187:469–81. [Google Scholar]
- 6.Wagner RS, Ellis WC. Appl Phys Lett. 1964;4:89–90. [Google Scholar]
- 7.Trentler TJ, Hickman KM, Goel SC, Viano AM, Gibbons PC, Buhro WE. Science. 1995;270:1791–4. [Google Scholar]
- 8.Huczko A. Appl Phys. 2000;A 70:365–76. [Google Scholar]
- 9.Reneker DH, Chun I. Nanotechnology. 1996;7:216–23. [Google Scholar]
- 10.Shin YM, Hohman MM, Brenner MP, Rutledge GC. Polymer. 2001;42:9955–67. [Google Scholar]
- 11.Li D, Xia Y. Nano Lett. 2003;3:555–60. [Google Scholar]
- 12.Kameoka J, Verbridge SS, Liu H, Czaplewski DA, Craighead HG. Nano Lett. 2004;4:2105–8. [Google Scholar]
- 13.Jing N, Wang M, Kameoka J. J Photopolym Sci Technol. 2005;4:503–6. [Google Scholar]
- 14.Wang M, Jing N, Su Chin B, Chou CK, Hung MC, Chang KA, Kameoka J. Appl Phys Lett. 2006;88:033106. [Google Scholar]
- 15.Deotare PB, Kameoka J. Nanotechnology. 2006;17:1380–3. [Google Scholar]
- 16.Engvall E, Perlmann P. Immunochemistry. 1971;8:871–84. doi: 10.1016/0019-2791(71)90454-x. [DOI] [PubMed] [Google Scholar]
- 17.Iqbal SS, Mayo MW, Bruno JG, Bronk BV, Batt CA, Chambers JP. Biosens Bioelectron. 2000;15:549–78. doi: 10.1016/s0956-5663(00)00108-1. [DOI] [PubMed] [Google Scholar]
- 18.Wulfkuhle JD, Liotta LA, Petricoin EF. Nat Rev Cancer. 2003;3:267–75. doi: 10.1038/nrc1043. [DOI] [PubMed] [Google Scholar]
- 19.Duffy MJ. Clin Chem. 2006;52:345–51. doi: 10.1373/clinchem.2005.059832. [DOI] [PubMed] [Google Scholar]