

Abstract
Vitreous samples collected in retinopathic surgeries have diverse properties, making proteomics analysis difficult. We report a cluster analysis to evade this difficulty. Vitreous and subretinal fluid samples were collected from 60 patients during surgical operation of non-proliferative diabetic retinopathy, proliferative diabetic retinopathy, proliferative vitreoretinopathy, and rhegmatogenous retinal detachment. For controls we collected vitreous fluid from patients of idiopathic macular hole, epiretinal, and from a healthy postmortem donor. Proteins from these samples were subjected to quantitative proteomics using two-dimensional gel electrophoresis. We selected 105 proteins robustly expressed among ca 400 protein spots and subjected them to permutation test. By using permutation test analysis we observed unique variations in the expression of some of these proteins in vitreoretinal diseases when compared to the control and to each other: 1) the levels of inflammation-associate proteins such as AAT, APOA4, ALB, and TF were significantly higher in all four types of vitreoretinal diseases, and 2) each vitreoretinal disease elevates a unique set of proteins which can be interpreted based on the pathology of retinopathy. Our protocol will be effective for the study of protein expression in other types of clinical samples of diverse property.
Keywords: vitreoretinal diseases, marker proteins, quantitative proteomics, two-dimensional gel, cluster analysis
1 Introduction
Vitreoretinal diseases such as diabetic retinopathy (DR) and proliferative vitreoretinopathy (PVR) are the major cause of vision loss.[1-4] Vision impairing DR can further be categorized into non-proliferative diabetic retinopathy (NPDR) and proliferative diabetic retinopathy (PDR). NPDR causes central vision loss when it induces diabetic macular edema (DME). PDR is the more advanced stage of DR, which is characterized by retinal neovascularization. Features of PDR include vitreous hemorrhage, formation of fibrous peri-retinal tissue accompanying neovascular blood vessels, traction retinal detachment and total vision loss as the final sequel.[5] PVR is the major complication after rhegmatogenous retinal detachment (RRD) surgery.[6-8] In RRD the liquid component of the vitreous passes through a retinal break, and separates the sensory retina and retinal pigment epithelial (RPE) cells. The fluid pooled in the subretinal space is called subretinal fluid (SRF) and is absorbed by choroidal vasculature via the RPE cells when the retinal break is sealed by surgery. PVR is characterized by proliferation of RPE cells, glial cells and inflammatory cells on the retinal surface and within the vitreous gels. PVR can be triggered by failed RRD surgery or in patients with RRD with delayed treatment.[7, 9] PVR is believed to develop as an abnormality in the wound healing process in the retina, and is distinguishable from PDR since it lacks neovascuralization.[3, 10] The majority of current studies focus on the role of specific cell growth factors such as vascular endothelial growth factor, platelet-derived growth factor, transforming growth factor and pigment epithelium derived factor in the development of vitreoretinal diseases, and little is known about the integrated phenomena leading to disease at the molecular level.
Proteomic analysis is a powerful approach to determine the coordinated changes in protein levels in tissues and cells.[11-14] Since vitreous is in contact with the retina, the physiological and pathological conditions of the retina affect the protein components in the vitreous, and evidence shows that changes of specific vitreous proteins are associated with various vitreoretinal diseases.[15-20] Recent proteomic studies of human vitreous samples have revealed more than 500 protein spots from vitreoretinal disease patients with DR and macular hole (MH) or DME and non-DME.[21-25] Proteomics analysis of RRD and PVR in comparison to NPDR and PDR would be interesting because the former retinal diseases do not develop complication caused by angiogenesis, while the latter diseases do. Such comparative analysis has never been reported before. Moreover, the previous proteomics studies of human vitreous in search of marker proteins were carried out only by a qualitative method or by a semi-quantitative method at best. Compared to the investigation in basic science using an animal model such as rats and mice, clinical investigations are more problematic because of the heterogeneous nature of patient samples. In order to draw meaningful information from data sets with high variance originated from the diversity of clinical samples it is imperative to obtain reliable numeric data and subject them to statistical evaluation such as cluster analysis. In this report we conducted quantitative proteomics analysis of multiple human vitreous samples from patients with NPDR, PDR, RRD and PVR, and compared the expression levels of vitreous proteins between each vitreoretinal disease using cluster analysis. After analyzing the data we show that those vitreoretinal diseases that have different pathological origins, in fact, manifest discreet sets of proteins in their vitreous.
2 Materials and methods
2.1 Patients and sample preparation
Undiluted vitreous fluid samples (0.5-1.0 ml) were obtained at the onset of a classic three port pars plana vitrectomy by aspiration into a 1 ml syringe before opening the infusion line. Subretinal fluid (SRF) samples were obtained from patients with primary RRD patients before surgery. Undiluted subretinal fluid samples (0.05-0.1 ml) were aspirated from the most highly elevated retinal area, after diathermy of the retinal tear. A cut-down through sclera was made and the choroid was heat coagulated to prevent bleeding. Then a 27 gauge needle was inserted into the subretinal space and fluid collected by suction. The sample collection was conducted at Fukuoka University School of Medicine. Informed consents had been obtained from each subject with an explanation of the purpose and potential adverse effects of the procedures. The protocol, in accordance with the Helsinki Declaration to collect clinical specimens, had been approved by the IRB at Fukuoka University, Fukuoka, Japan. Performing proteomics studies on these vitreous samples had been approved by the IRB at the University of Oklahoma Health Sciences Center, Oklahoma City, Oklahoma.
The characteristics of the patients participated in this study is summarized in Table 1. Fifty-one vitreous fluid samples and ten SRF samples were obtained from sixty patients with vitreoretinal diseases and one healthy donor after postmortem. The ophthalmologic subjects include twelve patients diagnosed as NPDR with the characteristics of DME, sixteen patients diagnosed as PDR with the presence of fibrous tissue and/or vitreous hemorrhage, and ten patients diagnosed as PVR. Ten SRF samples were obtained from patients with RRD. Thirteen vitreous fluids were used as control, which include twelve vitreoretinal disease patients, i.e., nine patients with MH, three patients with epiretinal membrane (ERM), and a healthy postmortem donor. The detailed description of each control sample is given below in the format of Control Number/Disease/Age/Sex: C1/MH/72/Female; C2/MH/58/Female; C3/MH/72/Female; C4/MH/72/Female; C5/MH/71/Male; C6/MH/64/Female; C7/ERM/80/Male; C8/MH/55/Female; C9/Donor/57/Male, C10/MH/65/Female; C11/ERM/36/Female; C12/MH/58/Male; C13/ERM/66/Male. Samples of vitreous fluid and SRF were collected into sterile tubes.
Table 1.
Characteristice of the Patients
| Characteristics | Control (N=13) | NPDR (N=12) | PDR (N=16) | RRD (N=10) | PVR (N=10) |
|---|---|---|---|---|---|
| Age – yr | 63.5±11.1 | 65.0±6.5 | 56.8±13.5 | 44.3±14.3 | 37.8±27.6 |
| Female – no. (%) | 8 (62) | 4 (33) | 9 (56) | 5 (50) | 6 (60) |
| MH – no. (%) | 9 (69) | – | – | – | – |
| ERM – no. (%) | 3 (23) | – | – | – | – |
| Donor – no. (%) | 1 (8) | – | – | – | – |
| Duration of Diabetes – yr | – | 11.3±8.0 | 13.2±11.3 | – | – |
| Glycosylated hemoglobin % | – | 7.2±1.4 | 7.3±1.3 | – | – |
| Viteous Hemorrhage – no. (%) | – | 0 | 15 (94) | – | – |
| Tractional RD – no. (%) | – | 0 | 5 (31) | – | – |
| Duration of RD – wk | – | – | – | 4.5±3.4 | – |
| Grade C* – no. (%) | – | – | – | – | 7 (70) |
Plus-minus values indicate; Average ± Standard Dashes denote; Not Applicable.
The classification of PVR : Grade C in PVR is characterized by rigid retinal folds in full thickness with heavy vitreous condensation and strands.
no., number; yr, year; MH, macular hole; ERM, epiretinal membrane; RD, retinal detachment.
All of these samples were rapidly frozen and stored at -80°C. They were then shipped to University of Oklahoma at dry ice temperature and kept at -80°C until use.
2.2 Measurement of protein concentrations
Protein concentrations of vitreous samples were determined with Coomassie Plus-Assay Kit (Pierce Biotechnology, IL, USA). In the protein assay bovine serum albumin was used as a standard. The optical density at 595 nm was measured by SPECTRA max 340 (Molecular Devices, CA, USA).
2.3 Two-dimensional gel electrophoresis (2DE)
2DE were performed as previously described elsewhere.[26] Because of the limited availability of patient samples, we ran 2DE gel once for each sample. Equal amounts of total proteins from vitreous (100 μg) were applied to each 2DE gel. Briefly, each sample was precipitated with cold acetone (80% final concentration) followed by centrifugation at 10,000 ×g for 15 minutes at 4°C. The precipitants were vacuum dried, resuspended in 100 μl of lysis buffer [9 M urea, 2% NP40, 5% β-mercaptoethanol, 5% Bio-Lyte pH 3/10 (Bio-Rad, Herculus, CA, USA)], and centrifuged at 16,000 ×g for 10 minutes. The supernatants were applied to 4% isoelectric focusing (IEF) tube gels (8.5 M urea, 2% Triton X-100, 0.01% APS, 0.005% rivoflavin/0.057% TEMED, 1% BioLyte 3/10, and 1% BioLyte 4/6). For the first dimension, IEF was performed using the following voltage program: 100 V for 1h, 200 V for 1h, 300 V for 1h, 400 V for 19h, 500 V for 1h. The total voltage-hour was 8,700 Vhr. In the second dimension, 11% SDS gels were run at 15 mA per gel until front dye passed the stacking gel and then 25 mA per gel for 2 hours. The gels were stained by Coomassie Brilliant Blue (CBB) R-250, destained and dried between two cellophane sheets (Bio-Rad, Hercules, CA).
2.4 Tryptic in-gel digestion
Protein spots were excised from the dried CBB-stained gels and destained in 100 mM ammonium bicarbonate/acetonitrile (ACN) (1:1). Gel pieces were dried in vacuum and then rehydrated in sequence-grade modified trypsin (Promega, Madison, WI) in a solution followed by addition of 25 mM ammonium bicarbonate. The digestion was carried out overnight at 36 °C. Tryptic peptides were extracted from the gel piece with 5% trifluoroacetic acid (TFA) in 50% ACN. The extracted peptides were concentrated by Savant SpeedVac (Thermo Electron Corp., Waltham, MA) and dissolved in 5 μl of 0.2% TFA.
2.5 Protein identification by mass spectrometry
For peptide mass fingerprinting (PMF) a peptide solution (0.5 μl) was mixed with 0.5 μl of the saturated matrix solution consisting of 10 mg alpha-cyano-4-hydroxy cinnamic acid (CHCA) in 1 ml of 0.1% TFA/50% ACN. The tryptic peptides were analyzed by Voyager Elite matrix-assisted laser desorption/ionization time-of-flight mass spectrometer (MALDI-TOF MS) (Applied Biosystems, Foster City, CA) in the reflector mode. The excitation wavelength was 337 nm by an N2 laser. The MALDI-TOF MS was calibrated at two points: mono-isotopic matrix peak of CHCA (M+H)+ at m/z 379.093 and synthetic peptide MAT27 (VDDGKSSDAQSQATASEAESK) with (M+H)+ at m/z 2110.94. Peak lists were searched against the NCBInr protein sequence data base (Date: October 15, 2005) using MASCOT searching algorithm (MS tolerance 0.5 Da) in order to identify the proteins. In some cases MS/MS analyses were conducted for detailed analysis of peptide structure. The matrix for MS/MS analysis consisted of 2% 2.5-dihydroxy benzoic acid in 0.1% TFA/50% ACN. 0.5 μl of the purified peptide by Millipore Zip Tips C18 (according to the manufacturer’s protocol) and 0.5 μl of the matrix mixture were spotted on the sample plate. MS/MS analysis was performed on the Axima QIT MALDI quadrupole iontrap time-of-flight mass spectrometer (Shimadzu/Kratos Analytical, Manchester, UK). The MS/MS fragments were searched against the NCBInr protein sequence data base (Date: November 8, 2005) through MASCOT (http://www.matrixscience.com/) with mass tolerance of 0.8 Da.
The identification of a protein from a 2-DE spot based on the probability-based MOWSE scores greater than 64 indicates the statistical significance at the level of p<0.05. The scores of majority of identified proteins were far above 64 as shown in Table 2 except one case, Spot #32 prostagrandin D2 synthase (PTGDS); score 53. PTGDS as well as other proteins listed in Table 2 have been reported in human vitreous. In this work we identified seven new proteins which all have MOWSE scores far exceeding 64 (p<0.05). These new proteins found in vitreous and their MOWSE scores are; compliment factor B (spot #1, score 90); gelsolin isoform b (spot #2, score 93); fibrinogen β-chain preproprotein (spot #12, score 110); alpha 1-antitrypsin (spot #17, score 116); complement component 4A (spot #29, score 96); serum amyloid P component (spot #31, score 75), and fibrin β (spot #40, score 173). These MOWSE scores in PMF on protein spots isolated on 2-DE fulfill the requirement suggested by the Draft Guidelines for Proteomic Data Publication[27, 28].
Table 2.
Identification of Vitreous Human Proteins. Spot numbers correspond to those shown in Figures 4 and 5.
| Spot # | Protein Identify | Gene Symbol | New or Previously Reported (+) | Theoretical MW / pl | Accession No. | Score a) | Sequence Coverage (%) | Peptide Matched (%)b) |
|---|---|---|---|---|---|---|---|---|
| 1 | complement factor B | BF | New | 87155 / 6.6 | 2347133 | 90 | 12 | 73 |
| 2 | gelsolin isoform b | GSN | New | 80946 / 5.6 | 38044288 | 93 | 26 | 50 |
| 3 | complement component 3 | C3 | + | 188948 / 6.0 | 40786791 | 136 | 19 | 68 |
| 4 | fibrinogen γ | FGG | + | 46963 / 5.5 | 223170 | 114 | 20 | 90 |
| 5 | alpha1-B-glycoprotein | A1BG | + | 52619 / 5.7 | 69990 | 117 | 25 | 63 |
| 6 | serum albumin | ALB | + | 71835 / 6.1 | 23307793 | 139 | 22 | 68 |
| 7 | alpha1-antitrypsin | AAT* | + | 44294 / 5.4 | 1942629 | 126 | 39 | 57 |
| 8 | alpha1-antitrypsin | AAT* | + | 44294 / 5.4 | 1942629 | 107 | 29 | 43 |
| 9 | alpha2-HS glycoprotein | AHSG | + | 40393 / 5.4 | 2521983 | 60 | 13 | 50 |
| 10 | alpha2-HS glycoprotein | AHSG | + | 40393 / 5.4 | 2521983 | 91 | 18 | 62 |
| 11 | fibrinogen γ | FGG | + | 46963 / 5.5 | 223170 | 121 | 41 | 50 |
| 12 | fibrinogen β chain preproprotein C) | FGB | New | 56745 / 8.5 | 70906435 | 110 | 38 | 50 |
| 13 | serum albumin | ALB | + | 48964 / 6.0 | 27692693 | 98 | 19 | 69 |
| 14 | zinc alpha-2-glycoprotein 1 | AZGP1 | + | 34507 / 5.7 | 52790422 | 154 | 43 | 61 |
| 15 | Apolipoprotein A-IV | APOA4 | + | 45371 / 5.3 | 37499461 | 188 | 50 | 63 |
| 16 | proapolipoprotein, proapolipoprotein A-I | APOA1 | + | 28944 / 5.5 | 178775 | 234 | 56 | 78 |
| 17 | alpha1-antitrypsin | AAT* | New | 44294 / 5.4 | 1942629 | 116 | 28 | 61 |
| 18 | transferrin | TF | + | 79841 / 6.8 | 31415705 | 317 | 46 | 85 |
| 19 | complement component 3 | C3 | + | 188948 / 6.0 | 40786791 | 105 | 9 | 75 |
| 20 | antithrombin III | SERPINC1 | + | 53137 / 6.3 | 179161 | 90 | 32 | 52 |
| 21 | vitamin D-binding protein, group specific component | GC | + | 54905 / 5.3 | 455970 | 78 | 16 | 78 |
| 22 | vitamin D-binding protein, group specific component | GC | + | 54905 / 5.3 | 455970 | 134 | 29 | 63 |
| 23 | vitamin D-binding protein, group specific component | GC | + | 54905 / 5.3 | 455970 | 108 | 24 | 50 |
| 24 | complement component 3 | C3 | + | 188948 / 6.0 | 40786791 | 83 | 10 | 53 |
| 25 | clusterin, SP40/40, apoliporotein | CLU | + | 37067 / 5.7 | 338305 | 87 | 30 | 47 |
| 26 | clusterin, SP40/40, apoliporotein | CLU | + | 37067 / 5.7 | 338305 | 89 | 25 | 100 |
| 27 | clusterin, SP40/40, apoliporotein | CLU | + | 37067 / 5.7 | 338305 | 67 | 23 | 63 |
| 28 | transthyretin | TTR | + | 12836 / 5.3 | 339685 | 133 | 91 | 57 |
| 29 | complement component 4A | C4A | New | 30380 / 6.3 | 57209751 | 96 | 28 | 70 |
| 30 | prostaglandin D2 synthase | PTGDS | + | 23106 / 9.9 | 55962673 | 130 | 41 | 71 |
| 31 | amyloid P component, serum | APCS | New | 25513 / 6.6 | 55665341 | 75 | 24 | 56 |
| 32 | prostaglandin D2 synthase | PTGDS | + | 23106 / 9.9 | 55962673 | 53 | 24 | 50 |
| 33 | proapolipoprotein, proapolipoprotein A-I | APOA1 | + | 28944 / 5.5 | 178775 | 128 | 53 | 54 |
| 34 | serum albumin | ALB | + | 19900 / 5.3 | 37222202 | 146 | 53 | 41 |
| 35 | plasma glutathione peroxidase | GPX3 | + | 16788 / 8.9 | 404108 | 115 | 57 | 69 |
| 36 | plasma retinal binding protein 4 | RBP4 | + | 23355 / 5.8 | 55663330 | 101 | 47 | 67 |
| 37 | not determined d) | Unknown | ||||||
| 38 | transthyretin | TTR | + | 12836 / 5.3 | 339685 | 113 | 62 | 54 |
| 39 | transthyretin | TTR | + | 12836 / 5.3 | 339685 | 146 | 71 | 56 |
| 40 | fibrin β | fibrin β* | New | 51512 / 8.0 | 223002 | 173 | 51 | 69 |
| 41 | cathepsin D | CTSD | + | 45163 / 6.1 | 16740920 | 98 | 20 | 82 |
| 42 | pigment epithelium-derived factor | PEDF* | + | 46526 / 6.0 | 15217079 | 91 | 19 | 88 |
| 43 | pigment epithelium-derived factor | PEDF* | + | 46526 / 6.0 | 15217079 | 105 | 23 | 89 |
| 44 | cathepsin D | CTSD | + | 45163 / 6.1 | 16740920 | 78 | 20 | 53 |
| 45 | pigment epithelium-derived factor | PEDF* | + | 46526 / 6.0 | 15217079 | 104 | 34 | 45 |
| 46 | pigment epithelium-derived factor | PEDF* | + | 46526 / 6.0 | 15217079 | 103 | 20 | 67 |
| 47 | cathepsin D | CTSD | + | 45163 / 6.1 | 16740920 | 97 | 26 | 58 |
| 48 | pigment epithelium-derived factor | PEDF* | + | 46526 / 6.0 | 15217079 | 139 | 46 | 41 |
Probability-based MOWSE score. Scores higher than 64 indicate the level of statistical significance at P<0.05.
The percentage of matched peptides compared to the observed.
The spot was identified as fibrinogen β after performing MS/MS followed by MASCOT search.
The corresponding spot on plasma gel was identified as hp2-alpha. The peptide mass fingerprinting spectra highly resembled each other.
Not Gene Symbol.
2.6 2DE gel image analysis by Progenesis Workstation
Two-dimensional gels stained with CBB were scanned by a transmission scanner (PowerLook III; UMAX Technologies, Dallas, TX) at 14 bit depth and a resolution of 300 dpi. The scanner was calibrated up to the transmission optical density of 3.1 using a Kodak Photographic Step Tablet No. 2 (Catalog Number 152 3398), ensuring linearity. The scanned gels were analyzed by Progenesis Workstation software (Nonlinear Dynamics Ltd., Newcastle upon Type, UK) to quantify the protein spots. The Progenesis software automatically defines the boundaries of 2-DE gel spots for each gel and also assigns the set of corresponding protein spots on the eight gels. The assignment of the 2-DE gel spot boundaries were visually inspected and corrected, when necessary. The correspondence of each 2-DE gel spot between eight gels was also inspected visually and correction was made, when necessary. The percentage of each protein spot after the normalization was expressed as percentile (%). Approximately four hundred protein spots were resolved on the 2DE gels. The spot matching among all 2DE gels was confirmed visually. The volume of each protein spot was normalized against the total integrated density of each gel in the defined areas which are comparable among all gels.
2.7 Analysis of proteins unique to each retinopathy
The comparison of clinical samples from different individuals with different, but somehow related diseases, poses an intrinsic difficulty in the method of normalization because of their dispersive nature. In our proteomics study of vitreoretinal diseases we analyzed the proteins from vitreous fluid and SRF so that the levels of total protein content of all samples were the same, i.e., 100 μg total proteins, by applying different volumes of samples. When the data will be analyzed, however, the comparison of absolute levels of proteins in situ will be more informative. Therefore, we converted the original quantitative data in relative terms into absolute terms based on the original concentration of each sample.
Another difficulty originating from the dispersive nature of samples is the reliability of quantitative assessment on proteins that are observed at low abundance. From this reason, although we observed ca 400 spots on a typical 2DE gel, we decided to select proteins that are robustly expressed in most of the 2DE gels. In addition, as the abundance of 2DE protein spot decreases, the reliability of protein identification also decreases. Considering these two factors in uncertainty, we selected 105 protein spots which constitute the top tier in abundance among ca 400 spots for the analysis. Selection of the 105 spots are based on the two criteria; 1) the population of a spot as expressed by the ratio between the spot density and the total density of the gel is larger or in the range of 0.0002%, and 2) the successful identification in peptide mass fingerprinting analysis as assessed by the probability-based MOWSE score at p<0.05 (except one 2DE spot that eluded identification). It should be noted that the elimination of these ca 300 spots from the analysis will not affect the relative abundance of each 105 spot selected for the analysis because each spot density was normalized to the total density of the gel containing all proteins analyzed.
Some of these 105 spots are displayed on 2DE gels as a train of spots along the dimension of isoelectric focusing. Assuming that the train of spots close to each other caused by charge polymorphism represents the same functionality, we decided to combine those spots of the same kind together. The combined protein spots are the trains of spots 1, 2, 3, 4, 5, 7, 8, 9, 10, 11, 12, 13, 14, 15, 16, as shown in Fig. 4 and Fig. 5. In these cases, since the polymorphism of proteins belonging to the same train is mainly due to protein charge, no substantial changes in the apparent molecular weight (mostly less than ca 1000 Da) were observed. However, in some cases, proteins of the same identity showed substantial variation of the apparent molecular weights (larger than ca 1000 Da). In such cases, we assigned the proteins into different groups. These examples are; Spot trains 7 and 8 (alpha1-antitrypsin) and Spot trains 9 and 10 (alpha2-HS glycoprotein) shown in Fig. 5. In the third case, vitreous proteins show rather large polymorphism in both dimensions of isoelectric point and molecular weight: e.g., Spots #21, #22, and #23 (vitamin D-binding protein), Spots #25, #26, and #27 (clusterin), Spots #38 and #39 (transthyretin), Spots #41, #44, and #47 (cathepsin D), and Spots #42, #43, #45, #46, and #48 (pigment epithelium-derived factor). For these proteins we discriminated each protein spot with the same identity as shown in Table 2.
Figure 4.

Representative 2DE gel maps of vitreoretinal diseases. Vitreous proteins (100 μg) were separated by 2DE. A, Control. B, NPDR. C, PDR. D, RRD. E, PVR. The protein spots shown by white lines are the same gene products and, therefore, combined for the quantification. The protein spots shown by broken lines were not considered for quantification because the contribution of density from the smears originating from neighboring protein spots was significant. Areas shown as a, b, c, and d were investigated by visual inspection for differential expression and shown in Figure 5.
Figure 5.
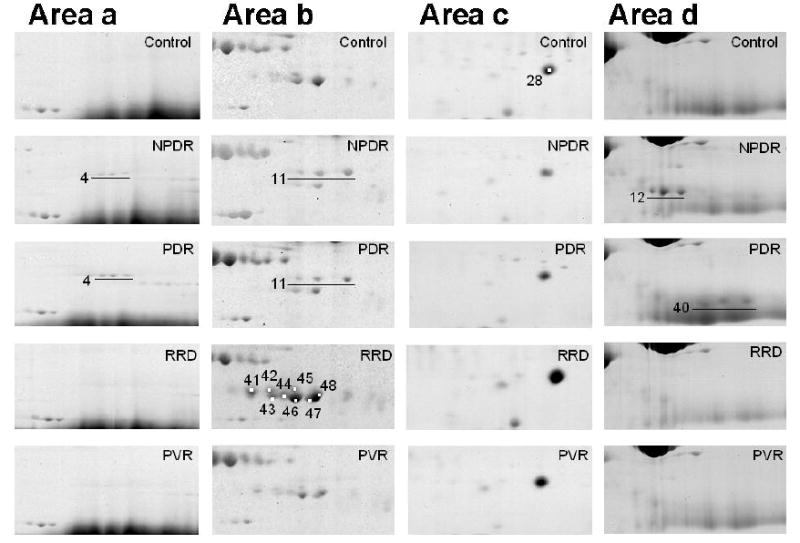
Specific regions of 2DE gels of vitreous samples illustrated for visual assessment. For example, the following statements may be drawn in these particular cases: FGG (#4, 11) was seen on NPDR and PDR gels only (a, b). Various levels of expression of PEDF (#42, 43, 45, 46, 48) and CTSD (#41, 44, 47) were observed (b). Higher levels of TTR (#28) were observed in SRF and PVR compared to other disease samples (c). The spots corresponding to FGB (#12) and fibrin beta (#40) were detected on NPDR and PDR gels (d). Interestingly, the FGB spots were detected in almost all NPDR samples, whereas the fibrin beta was present only in the one thirds of the samples. The fibrin beta spots were observed in most of the PDR samples even though the FGB spots were not present.
We also eliminated minor spots that are affected by an adjacent major spot. For example, we eliminated these protein spots (Figure 4A) from consideration because the spots represented by lines 1-3 were affected by the smear originated from Spot #18.
After such refinement of the original data we selected 68 groups of protein spots and subjected them to cluster analysis using the absolute protein amount calculated from the 2DE gel analysis. We used permutation test implemented in the cluster analysis package GeneCluster 2[29] (http://www.genome.wi.mit.edu/cancer/software/genecluster2/gc2.html) to compare each pair of vitreoretinal diseases. Briefly, the mean and standard deviation of the expression level were computed in each class, and then the ratio of the difference of the means was divided by the sum of the standard deviations according to the formula shown below:
where μ and σ denote mean and standard deviation, respectively.
The signal-to-noise ratios (S2N) were evaluated by permutation test which assesses the significance of protein markers in terms of class-protein correlations. Markers were selected by comparison of the following sets; NPDR versus vs. control (Figure 5A), PDR vs. control (Figure 5B), RRD vs. control (Figure 5C), and PVR vs. control (Figure 5D).
3. Results
3.1 Protocol of experimental procedure and data analysis
Figure 1 schematically summarizes the whole procedure of our study. First, vitreous proteins were separated by 2DE, followed by image analysis. Briefly, the integrated volume of each protein spot on 2DE gels was converted to the absolute volume equivalent of that in situ. Marker search was conducted by permutation test of the signal-to-noise ratios of means and standard deviations of the expression level of each protein. Meanwhile, proteins on 2DE gel were identified by in gel trypsin digest, mass spectrometry, and peptide mass fingerprinting through MASCOT database search.
Figure 1.
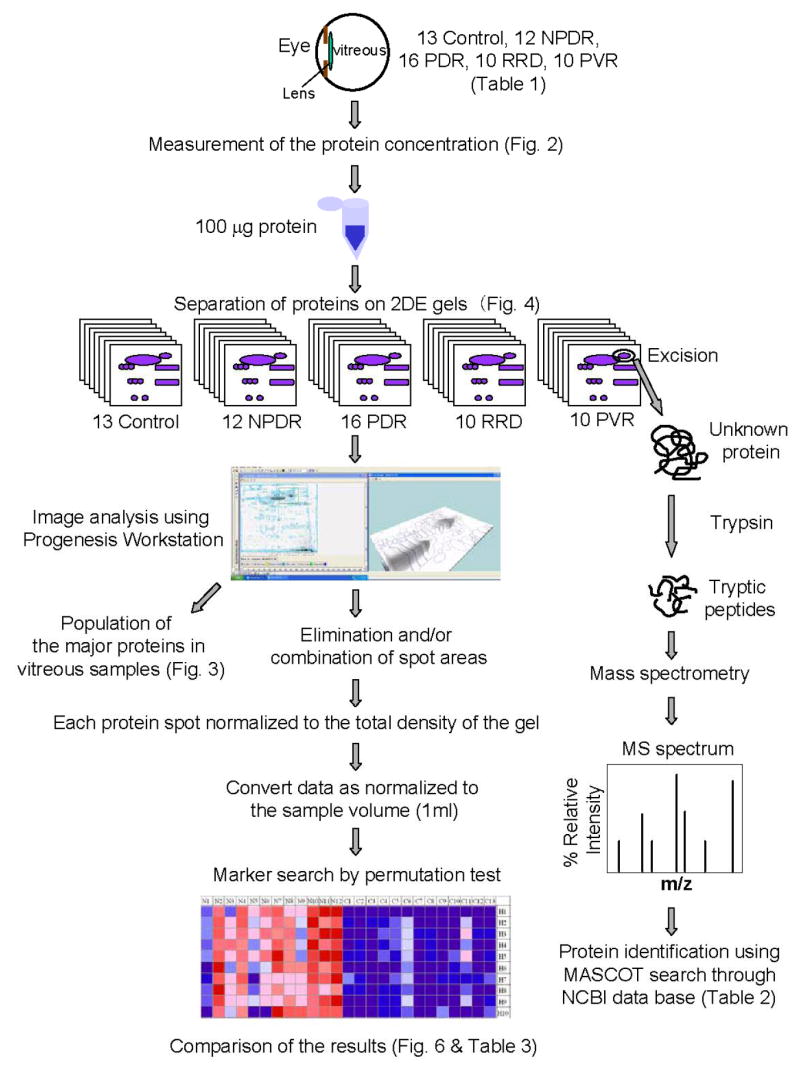
Flow chart of the proteome profiling of vitreoretinal disease, illustrating each experimental step and the corresponding figure. See Experimental section for details.
3.2 Protein concentrations of vitreous samples
Average protein concentrations in the vitreous samples of control patients and patients with NPDR, PDR, RRD, and PVR were 0.77 ± 0.47, 3.45 ± 1.37, 4.21 ±2.2, 10.46 ± 10.53 and 15.75 ± 10.63 (mean ± standard deviation) mg/ml, respectively (Figure 2). As shown in these results, there is a tendency that vitreous samples collected from vitreoretinal patients exhibit higher levels of protein concentrations compared to control. Particularly, RRD and PVR gave substantially higher levels of protein contents compared to NPDR and PDR. Such variation in the protein contents of vitreous samples makes proteomics investigations difficult. In order to overcome this difficulty we decided to run 2DE gels of the samples containing the constant protein content, i.e., 100 μg as described in Materials and Methods and in Figure 1.
Figure 2.

The protein concentration profiles of all the vitreous samples analyzed in this work. The average protein concentration in each category was; Control, 0.77±0.47; NPDR, 3.45±1.37; PDR, 4.21±2.2; RRD, 10.46±10.53, PVR, 15.75±10.63 mg/ml (mean±SD), respectively.
3.3 Protein populations in vitreous samples
After 2DE gel image analysis we evaluated the distributions of major proteins in vitreous from patients with various vitreoretinal diseases as shown in Figure 3. The relative distribution of major proteins in vitreous from patients with RRD was similar to that of control samples. In particular, the relative abundance of transferrin (TF) in control samples (12.8%) was similar to that in the RRD samples (13.1%). In addition, the relative protein distribution in RRD and the control has a different pattern when compared to NPDR, PDR, and PVR. The relative abundance of TF in the control and RRD samples was slightly higher than that in samples from patients with NPDR (8.3%), PDR (8.1%), and PVR (8.1%). Similarly, the relative abundance of transthyretin (TTR) in control (2.8%) and RRD (4.1%) samples was slightly higher than that in samples from patients with NPDR (1.1%), PDR (1.2%), and PVR (1.5%). These results indicate that albumin, transferrin, and IgG dominate the protein populations of both vitreous fluid (NPDR, PDR, and PVR) and SRF (RRD). It is apparent that any differences in the populations of minor proteins summarized in the other category, if any, would not be revealed by this type of analysis. One way of evading this difficulty is to remove major proteins by affinity chromatography. However, we decided not to take this approach because we were afraid of losing minor proteins that might be removed during the affinity chromatography. Therefore, we conducted the direct evaluation of vitreous samples and analyzed the data statistically as shown below.
Figure 3.
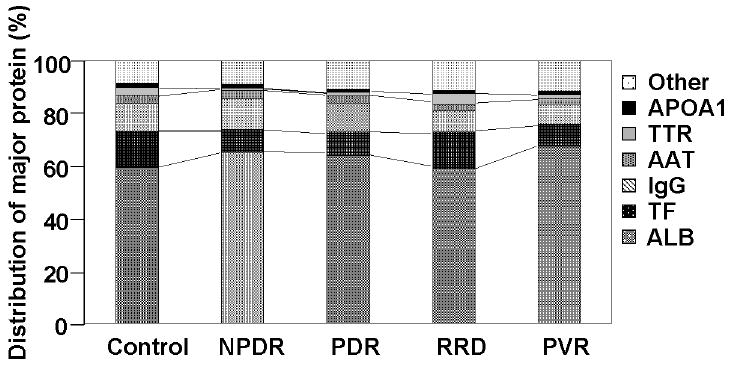
Relative population of major protein components. On the horizontal axis Control, NPDR, PDR, and PVR repesent vitreous samples. RRD represents SRF sample. APOA1, proapolipoprotein A1; TTR, transthyretin; AAT, alpha 1-antitrypsin; IgG, immunoglobulin G; TF, transferrin; ALB, serum albumin.
3.4 2DE gel profiling of vitreoretinal diseases
Representative protein profiles of vitreous from each patient population are shown in Figure 4. On 2DE gel analysis, larger numbers of proteins spots were detected on the control and RRD gels compared to NPDR, PDR and PVR gels. The mean numbers of detected spots on 2DE gel by CBB staining were 424 ± 58, 366 ± 60, 352 ± 55, 390 ± 109, and 357 ± 66 for the control, NPDR, PDR, RRD, and PVR, respectively.
3.5 Differentially expressed protein spots by visual inspection
We show some examples of candidate disease marker proteins for vitreoretinal diseases in Fig. 5. For example, the spot corresponding to fibrinogen gamma (FGG: Spot #4 and Spot #11) shown in Figure 5, Areas a and b, were specifically observed in the NPDR and PDR gels. Pigment epithelium derived factor (PEDF: Spot #42, Spot #43, Spot #45, Spot #46, and Spot #48) was universally observed in all gels (Figure 5, Area b), and particularly its expression level was high in the RRD samples (Figure 5, Area b, RRD). Cathepsin D (CTSD: Spot #41, Spot #44, and Spot #47) was expressed exclusively on RRD and PVR samples compared to NPDR and PDR, with a slight expression in Control (Figure 5, Area b). Substantially higher levels of expression of TTR (Spot #28) were observed in the RRD and PVR vitreous samples compared to those of NPDR and PDR (Figure 5, Area c). Spot #12 was observed on all NPDR gels, but not on other gels including Control. Spot #40 was observed on all PDR gels, but only on one third of the NPDR gels. In order to substantiate these results as well as to discover other characteristics of protein population in diseased vitreous proteins we adapted a numeric marker search algorithm to the set of our densitometric data.
3.6 Search for unique proteins by permutation test
To further study the difference in protein expression patterns among the disease categories, the absolute amounts of 68 groups of vitreous proteins in each vitreoretinal disease were analyzed and compared to control using the permutation test function in GeneCluster 2. The proteins expressed at significantly higher (red) or lower (blue) level exhibiting the statistical significance of p<0.01 are illustrated in Figure 6. Figures 6A, 6B, 6C, and 6D show the pairs of “NPDR vs Control”, “PDR vs Control”, “RRD vs Control”, and “PVR vs Control”, respectively. In each panel, the rows represent the panel of ten proteins with high signal-to-noise (S2N) scores in the test population, i.e., N1 through N12 in Panel A, D1 through D16 in Panel B, R1 through R10 in Panel C, and V1 through V10 in Panel D, in the left half of each panel as compared to the population in the right panel (C1 through C13 in all panels). In all panels rows H1~H10 represent the descending S2N scores, H1 being the highest and H10 being the lowest. These rankings are based on the average protein expression levels among all patients in a given category. It should be noted that the validity of using three different kinds of vitreous samples, i.e., the vitreous fluid of idiopathic macular hole (n=9), epiretinal membrane (n=3), and the postmortem donor (n=1), has been confirmed by the resemblance of the permutation test results of these 13 control samples as shown in the right panels of Figs. 6A, B, C, and D.
Figure 6.

Ranking of putative marker proteins for vitreoretinal diseases analyzed by permutation test. A, NPDR versus vs. control. B, PDR vs. control. C, RRD vs. control. D, PVR vs. control. Ranking and the spot number of marker proteins were indicated in the columns to the right-hand side, and individual patients are indicated across the top. In Figs. A, B, C, and D, the columns C1 through C13 represent control individual (n=13). C1 through C6, C8, and C12 represent samples from macular hole (MH) patients. C7, C11, and C13 represent samples from epiretinal membrane (ERM) patients. C9 represents a sample from a healthy donor. In a similar manner, the columns N1 through N12 represent individual NPDR patient (n=12). The abbreviations for other columns are; D, PDR; R, RRD; V, PVR. In the color graphs, H1 through H10 represents the top ten-ranked proteins expressed in the disease group shown in the left panel; for example, in Fig. A, the proteins ranked H1 through H10 were expressed significantly in the vitreous samples of NPDR patients N1 through N12 compared to controls C1 through C13. The fold changes in the average of all patients compared to the average of the control panel are shown in the “fold” column to the right of each figure. All these putative markers all passed the permutation test with signal-to-noise score better than 1% of the random permutation (P<0.01). The columns to the right represent; “spot”, Protein Spot Number illustrated in Fig. 4; “marker”, Protein Name shown in Table 1; “fold”, the fold changes in the average of the left panel when compared to the average of the right panel; “score”, Signal-to-noise (S2N) score calculated by permutation test algorithm; “perm1%”, A theoretical S2N score at which the p value equals 0.01, indicating that any higher S2N score than this number is warranted to be p<0.01; “median”, the median value of all data elements of each protein for comparison.
Meanwhile, the putative candidates for disease specific protein markers were identified by PMF (Table 2, and shown in the marker column of Figures 6A~D). The column numbers represent individual patients. Some of these marker proteins can also be observed by visual inspection to be unique on 2DE gels; for instance, see the areas a, b, c, and d shown in Figure 4B. The details of each area are shown in Figure 5.
3.7 Assignment of a precursor-product pair caused by post-translational modification; Determination of fibrin β and its precursor by PMF and MS/MS
Protein heterogeneity on 2DE gels are likely to be caused by post-translational modification. Different protein spots with post-translational modification will usually be assigned as the same protein in the initial peptide mass fingerprinting. In the initial screening Spot #12 and Spot #40 in Figure 4 were indistinguishably assigned to be fibrinogen β (FGB) chain preproprotein and/or fibrin β. The PMF spectra were shown in Figures 7A and B, respectively. In order to identify unambiguously the precursor-product relationship between these two spots we conducted MS/MS. We observed a unique PMF peak m/z 1552.77 of the tryptic fragments of Spot #12 (illustrated by an asterisk in Figure 7A). The MS/MS analysis revealed that the m/z 1552.77 peak is likely to be fibrinopeptide B (Bβ1-14: Pyr-GVNDNEEGFFSAR) (Figure 7C). There have been two different amino termini of fibrinopeptide B (Bβ1-14), Glu or Gln, reported on the NCBI database. Since there is a possibility that Glu can be converted into Gln either in vivo or in vitro, it is rather difficult to distinguish between them. Moreover, the amino terminus of fibrinopeptide B (Bβ1-14) detected on our gels was modified into pyrogluatmate (Pyr), making it difficult to determine whether the original N-terminus was Glu or Gln. These results are consistent with previous reports.[30, 31] Based on these data we assigned Spot #12 and Spot #40 to be fibrinogen β and fibrin β, respectively. In contrast to such clear case as that of the fibrinogen β-fibrin β pair illustrated in Fig. 7, most cases of post-translational modification remain unassigned, and, therefore, distinguished simply by different spot numbers.
Figure 7.

Figures A and B; MALDI-TOF-MS peptide maps of FGB and fibrin beta obtained after in-gel trypsin digestion of the #12 spot and the #40 spot, respectively (Fig. 4). These spectra resemble each other except the peptide peak with m/z 1552.77 (shown by an asterisk). (C) The MS/MS spectrum for the peptide with m/z 1552.77 (shown by an asterisk in Fig. A). The MS/MS spectrum indicates that the m/z 1552.77 peak is the fibrinopeptide B (Bb1-14: Pyr-GVNDNEEGFFSAR, where Pyr is pyroglutamate. The observed fragment ions, y4, y6, y7, y8, y9, and y10, are shown in the figure. No b-ions were observed under these conditions.
3.8 Unique proteins for vitreoretinal disease
The results of permutation test shown in Figure 6 are summarized in Table 3. Table 3 lists the marker candidates that are ranked higher than the tenth in each disease in comparison with the control. It should be noted that the election of candidate protein markers by permutation test is unlikely to be caused by the elevated protein concentrations of disease samples as illustrated in Fig. 2 because the amount of each vitreous protein is represented as relative to the total amount of protein by normalization of each spot density to the total density of the gel. Thus, the results indicate that each disease exhibits a unique set of proteins compared to each other. The results of permutation test can be summarized as follows.
Table 3.
Expression of candidate maker proteins in vitretional diseases. The value x, as represented by “+”, denotes the fold-indicate of each protein compared to control. The candidate marker proteins that are ranked higher then 10th in Fig. 6 are indicated by “+”. The asterisk (*) indicates the ranking of some notable proteins in their signal to noise (S2N) values.
| NPDR | PDR | RRD | PVR | |
|---|---|---|---|---|
| AAT | + | + | + | ++ |
| APOA4 | + | + | + | ++ |
| ALB | + | + | *33rd (+++) | ++ |
| TF | + | *11th (+) | *35th (++) | ++ |
| A1BG | + | + | ||
| C3 | +++++(52-fold); + | + | ||
| FGG | ++ | +++++(173-fold); + | ||
| GC | + | + | ||
| APOA1 | ++ | |||
| AZGP1 | + | + | ||
| PEDF | ++; +; +++; ++ | + | ||
| CLU | ++++ | *22nd; *24th; *28th (al ++) | ||
| CTSD | +++; +++; +++ | |||
| TTR | *23rd; *28th (both++) | + | ||
| RBP4 | ++ | |||
| SERPINC1 | ++ |
Fold-increase compared to control:
+; 3≤x<10
++; 10≤x<20
+++; 20≤x<30
++++; 30≤x<40
+++++; larger then 40-fold (shown in parenthesis)
FGB was detecated in all NPDR samples (12/12) in contrast to fibrin beta (5/12).
FGB was detecated in 11/16 PDR samples (12/12) in contrast to fibrin beta (6/16).
The levels of inflammation-associated proteins such as AAT, APOA4, ALB, and TF were significantly higher in all four types of vitreoretinal diseases. Although ALB and TF were not among the top ten protein groups of abundantly expressed proteins in RRD (regarding ALB) or in PDR and RRD (regarding TF), their expression levels were significantly higher than those seen in control samples; ALB is the 33rd in RRD compared to Control, and TF is the 11th in PDR and the 35th in RRD compared to Control. It should be noted that AAT, APOA4, ALB, and TF are all inflammation-associated proteins.
Each vitreoretinal disease elevates a unique set of proteins. For example, The levels of A1BG, C3, FGG, and GC were significantly higher in both NPDR and PDR. Especially, the levels of C3 in NPDR (52 fold) and that o f FGG in PDR (173 fold) were substantially higher compared to other candidates. In the RRD and PVR samples, in comparison to the NPDR and PDR samples, there are significantly higher levels of PEDF, CLU, TTR, and CTSD detected.
4 Discussion
This is the first report of systematic and quantitative proteome study of human vitreous fluid samples searching for unique proteins that are likely to manifest the pathophysiological events of vitreoretinal diseases such as NPDR, PDR, RRD and PVR. The difficulty of analyzing clinical samples originates in the dispersive nature of samples caused by a limited availability of samples collected from patients with various parameters as well as the sample limitation in their quantity. The set of our vitreous samples enabled us to run 2DE gel only once or twice for many patient cases except for some exceptional ones. We have reported that the quantitative proteomics protocol we used in this work is highly reproducible.[13, 14] Therefore, we anticipate that the evaluated value of each sample is reliable enough to be subjected to permutation test in which different patient samples of each vitreoretinal disease are compared. The permutation test allows us to evaluate the appearance of particular proteins in a particular disease case compared to other disease cases even when the samples are dispersive. In fact, as will be discussed in the following paragraphs, our permutation test analysis verified some of the reported elevation of vitreous protein expression in vitreoretinal diseases, confirming the validity of our strategy used in this work.
We observed that four classes of inflammation-associated proteins, i.e., AAT, APOA4, ALB, and TF, are elevated in all vitreoretinal diseases examined, which appear to be the projection of the vitreoretinal disease conditions. Recent proteomic studies of human vitreous compared the proteins in the vitreous of patients with DR vs MH, DME vs non-DME, and pseudophakic donor eyes vs phakic donor eyes[22-25], and different protein expression levels were reported for APOA4, PEDF, TF and TTR between the diseases studied. Our study further revealed ALB and AAT as common protein markers reflecting inflammation in vitreoretinal diseases. A previous study reported that the distribution of major proteins was different among various vitreoretinal diseases by using enzyme-linked immunosorbent assay [32]. The fact that we observed a unique set of proteins that are elevated in each vitreoretinal disease is in agreement with those results. In the previous studies, several inflammation markers were expressed in association with diabetes.[33-36] For instance, in diabetic rats, expression of acute-phase response protein genes in Müller cells was demonstrated.[37] Expression of other inflammation related cytokines and growth factors have also been implicated in DR and PVR.[38-41] The proteins elevated among NPDR, PDR, RRD and PVR in comparison to control such as AAT, APOA4, ALB, and TF are associated with inflammation, although they are also abundant in control vitreous. However, we observed significant difference in relative population of these inflammatory markers in patients when compared to controls. Our data gives further support to the importance of inflammation in vitreoretinal diseases and helps to further justify the use of long-acting steroids such as triamcinolone for treatment of the diseases such as DME.[42, 43]
Fibrinogen is abundant in plasma and is a major determinant of blood viscosity.[44, 45] Hyperfibrinogenemia is a risk factor for cardiovascular patients with diabetic mellitus (DM),[46-48] and an increase of plasma fibrinogen levels is also associated with exacerbation of DR.[49, 50] Previous studies have shown that fibrinogen plays an important role in the development of choroidal neovascularization by stimulating vascular endothelial growth factor, the primary contributor to DR.[51] Here, we find that FGG was substantially increased in the NPDR and PDR samples when compared to RRD, PVR and control, as we would expect. In addition, elevated levels of both the FGB and the fibrin beta spots were detected on 2DE gels of the vitreous fluids from patients with NPDR and PDR. Interestingly, the FGB was detected in almost all NPDR samples while the fibrin beta was only present in one third of the samples. In the PDR, which is the more advanced stage of DR, we observed the fibrin beta spots in most of the PDR samples even when the FGB spots were not present. The MW 1552.77 tryptic peptide of FGB, which was detected on the 2DE spot representing FGB spot, was identified as fibrinopeptide B (Bβ1-14: PyrGVNDNEEGFFSAR; Figure 7C). The C-terminal of Bβ14 is the cleavage site by thrombin. Release of fibrinopeptide B (Bβ1-14) after thrombin-mediated cleavage exposes an independent polymerization site beginning with β15-18 (GHRP). This is followed by spontaneous polymerization and formation of a fibrin clot.[52] These results combined together appear to manifest the course of event in the transition of milder DR into severe DR during which FGB will be cleaved off the fibrinopeptide B (Bβ1-14). It should be noted that this phenomenon has never been documented in human vitreous previously. The appearance of fibrin β could be a parameter indicative of the progress of DR, which needs to be verified by future investigation.
In the RRD and PVR samples, in comparison to the NPDR and PDR samples, there are significantly higher levels of PEDF, CLU, CTSD, and TTR detected. All of these proteins were reported to exist in RPE cells or glial cells that play an important role in pathogenesis of RRD and PVR [53-64], eloquently exhibiting the breakdown of retinal integrity and the flowing in of subretinal fluids into the vitreous samples.
PEDF is known to be an anti-angiogenesis factor and induces neuroprotection.[53-55] A previous study has reported that PEDF level in human vitreous is high in RRD and low in PVR.[56] In accordance with the previous report we observed a significantly higher expression of PEDF in RRD compared to PVR. However, the expression of PEDF in PVR vitreous is only moderately significant compared to both forms of diabetic retinopathy, i.e., NPDR and PDR. This finding suggests that PEDF plays an early role in the development of PVR, or it may simply reflect the difference of protein components according to the different compartment, subretinal space or vitreous.
CLU, also called apolipoprotein J or SP40,40 is a glycoprotein and is secreted in the extracellular spaces and body fluid.[65] The 449-amino acid primary polypeptide chain of human CLU is proteolytically cleaved into the α and β chains. CLU has been implicated in a variety of physiological processes, including lipid transport, membrane remodeling and inhibition of the complement cascade.[66] In addition, up-regulation of CLU has been reported in response to pathological conditions, such as Alzheimer’s disease,[67] spinal cord injury,[68] and retinal degeneration.[69] It has also been reported that the CLU gene was up-regulated in cultured RPE cells in early passage compared to later passages[57] and that the expression of CLU protein in Müller cells was up-regulated by the pressure-induced ischemic injury in the rat retina[58]. The primary event of PVR is the formation of a retinal break. It has been thought that RPE cells then migrate and proliferate through the break into the preretinal space, glial cells follow, and an extracellular matrix is laid down. Our observation, the elevated CLU in RRD and PVR, may indicate that CLU contributes to the process of those retinal diseases.
CTSD, a member of the aspartic acid proteinase family, is a ubiquitous lysosomal enzyme that plays an important role in protein degradation and the proteolysis of rhodopsin.[70] A wide range of lysosomal enzyme is present in RPE cells, and these are responsible for the continuous digestion of phagocytosis of photoreceptor outer segment that is one of the functions of RPE cells. Several previous reports suggest that CTSD plays an important role in the pathological processes in the retina. For instance, CTSD was observed in Müller cells, ganglion cells and RPE cells of physiological retina,[59, 60] and the expression of CTSD correlated with age-related changes of the retina.[61] Finally, CTSD levels are high in SRF from patients with RRD.[62] Here, we demonstrate that CTSD was expressed significantly higher in SRF from patients with RRD than in NPDR, PDR, or PVR. These results suggest that secreted CTSD from RPE cells contribute to pathogenesis of RRD.
TTR is one of 20 known human proteins within amyloid fibrils, which is accumulated in tissues or extracellular matrix surrounding vital organs during amyloidosis.[71, 72] TTR is a protein of 127 amino acids in which four monomers are associated non-covalently to form a tetramer of 56 kDa. Each monomer has a high degree of β-structure that contains eight β-sheets in two parallel sheets of four strands each. This β-structure has been considered to be important for the structure of the amyloid fibril and the mechanism of fibrillogenesis.[73] TTR is synthesized in liver,[74] RPE cells[63, 64] and choroid plexus of the brain.[75, 76] PVR is characterized by formation of fibrous membranes on the retina, and the membrane is composed of cellular components of RPE cells, glial cells and inflammatory cells. Our data revealed a significantly higher level of TTR in PVR samples. Although TTR in RRD missed the top ten entries, it was still ranked high (Table 3). All these results corroborate well with the scheme that TTR is synthesized and secreted by RPE cells, contributing to the formation of a fibrous membrane on the retina in RRD and PVR.
Recently, Gao et al. observed an elevated levels of CA1 in DR patients[77]. Based on the observation and other evidence the authors proposed that leaked CA1 mediates hemorrhagic retinal vascular permeability through prekallikrein activation. In our study CA1 ranked at the 32th with regard to the significance of signal-to-noise ratio in the permutation test, although there was a substantial increase, i.e., 263 fold, compared to the control (data not shown). These results eloquently illustrate a proof of principle of our methodology with a caveat: a higher signal-to-noise ratio in the permutation test may not always guarantee the absolute authenticity of a protein as a disease marker. Practically speaking, however, since the proteins listed as marker candidates will be evaluated in other modes of investigation, the true disease markers will emerge later from the list of marker candidates.
5 Conclusions
Our quantitative proteomics analysis of vitreous fluid samples from patients diagnosed as NPDR, PDR, RRD and PVR revealed sets of proteins unique to each vitreoretinal disease. Since the available vitreous samples have diverse properties, a cluster analysis such as permutation test will be an indispensable tool to analyze the data. In fact, the data analysis projected rather clear cut results which can be summarized: 1) that the vitreous fluid and SRF samples collected during various types of vitreoretinal surgeries and scleral buckling operations contain a common set of inflammation-associated proteins the levels of which were elevated compared to control samples, and 2) each vitreoretinal disease exhibits a unique set of proteins compared to control, discriminating each vitreoretinopathy. These putative marker proteins have features indicative of their pathogenesis. These results indicate that a cluster analysis of proteomics data obtained from vitreoretinal disease samples of high diversity can be a useful tool for the study of proteins uniquely expressed in each disease. The proteomics protocol presented in this report will be an effective tool to study other types of clinical samples with highly diverse nature.
Acknowledgments
This work was supported by NIH EY13877, EY12190, and RR17703. TS was a visiting scholar from the Department of Ophthalmology, Fukuoka University School of Medicine, Fukuoka, Japan. We thank Motomu Kuroki, Hiromi Yamada, Hiroyuki Kondo and Hiroaki Ozaki for their assistance in sample preparation. We thank Dr. Daisuke Watanabe for discussion and Anil Singh for assistance. We also thank Janeen Arbuckle for reading the manuscript.
Abbreviations used
- DR
diabetic retinopathy
- NPDR
non-proliferative diabetic retinopathy
- PDR
proliferative diabetic retinopathy
- RRD
rhegmatogenous retinal detachment
- PVR
proliferative vitreoretinopathy
- SRF
subretinal fluid
- DME
diabetic macular edema
- RPE
retinal pigment epithelia
- MH
macular hole
- ERM
epiretinal membrane
- 2DE gel
two dimensional gel
- AAT
alpha1-antitrypsin
- APOA4
apolipoproteinA4
- ALB
albumin
- TF
transferrin
- A1BG
alpha1-B-glycoprotein
- C3
complement component3
- FGG
fibrinogen β
- GC
vitamin D-binding protein
- PEDF
pigment epithelium derived factor
- CLU
clusterin
- CTSD
cathepsin D
- TTR
transthyretin
Other gene symbols used in this paper are shown in Table 2.
References
- 1.Aiello LP, Gardner TW, King GL, Blankenship G, et al. Diabetic retinopathy. Diabetes Care. 1998;21:143–156. doi: 10.2337/diacare.21.1.143. [DOI] [PubMed] [Google Scholar]
- 2.Caird FI. The epidemiology of diabetic microangiopathy. Acta Diabetol Lat. 1971;8(Suppl 1):240–248. [PubMed] [Google Scholar]
- 3.Grierson I, Mazure A, Hogg P, Hiscott P, et al. Non-vascular vitreoretinopathy: the cells and the cellular basis of contraction. Eye. 1996;10(Pt 6):671–684. doi: 10.1038/eye.1996.160. [DOI] [PubMed] [Google Scholar]
- 4.Schwartz SD, Kreiger AE. Proliferative vitreoretinopathy: a natural history of the fellow eye. Ophthalmology. 1998;105:785–788. doi: 10.1016/S0161-6420(98)95015-1. [DOI] [PubMed] [Google Scholar]
- 5.Arden GB, Hamilton AM, Wilson-Holt J, Ryan S, et al. Pattern electroretinograms become abnormal when background diabetic retinopathy deteriorates to a preproliferative stage: possible use as a screening test. Br J Ophthalmol. 1986;70:330–335. doi: 10.1136/bjo.70.5.330. [DOI] [PMC free article] [PubMed] [Google Scholar]
- 6.The classification of retinal detachment with proliferative vitreoretinopathy. Ophthalmology. 1983;90:121–125. doi: 10.1016/s0161-6420(83)34588-7. [DOI] [PubMed] [Google Scholar]
- 7.Machemer R. Pathogenesis and classification of massive periretinal proliferation. Br J Ophthalmol. 1978;62:737–747. doi: 10.1136/bjo.62.11.737. [DOI] [PMC free article] [PubMed] [Google Scholar]
- 8.Machemer R, Laqua H. A logical approach to the treatment of massive periretinal proliferation. Ophthalmology. 1978;85:584–593. doi: 10.1016/s0161-6420(78)35637-2. [DOI] [PubMed] [Google Scholar]
- 9.Ryan SJ. The pathophysiology of proliferative vitreoretinopathy in its management. Am J Ophthalmol. 1985;100:188–193. doi: 10.1016/s0002-9394(14)75004-4. [DOI] [PubMed] [Google Scholar]
- 10.Weller M, Wiedemann P, Heimann K. Proliferative vitreoretinopathy--is it anything more than wound healing at the wrong place? Int Ophthalmol. 1990;14:105–117. doi: 10.1007/BF00154210. [DOI] [PubMed] [Google Scholar]
- 11.Harry JL, Wilkins MR, Herbert BR, Packer NH, et al. Proteomics: capacity versus utility. Electrophoresis. 2000;21:1071–1081. doi: 10.1002/(SICI)1522-2683(20000401)21:6<1071::AID-ELPS1071>3.0.CO;2-M. [DOI] [PubMed] [Google Scholar]
- 12.Matsumoto H, Kurono S, Matsumoto M, Komori N. In: Encyclopedia of Molecular and Cell Biology and Molecular Medicine. 2. Meyers RA, editor. Wiley-VCH Verlag; 2005. pp. 557–585. [Google Scholar]
- 13.Haniu H, Komori N, Takemori N, Singh A, et al. Proteomic trajectory mapping of biological transformation: Application to developmental mouse retina. Proteomics. 2006;6:3251–3261. doi: 10.1002/pmic.200500813. [DOI] [PubMed] [Google Scholar]
- 14.Komori N, Takemori N, Kim HK, Singh A, et al. Proteomics study of neuropathic and nonneuropathic dorsal root ganglia: altered protein regulation following segmental spinal nerve ligation injury. Physiol Genomics. 2007;29:215–230. doi: 10.1152/physiolgenomics.00255.2006. [DOI] [PubMed] [Google Scholar]
- 15.Garcia-Ramirez M, Canals F, Hernandez C, Colome N, et al. Proteomic analysis of human vitreous fluid by fluorescence-based difference gel electrophoresis (DIGE): a new strategy for identifying potential candidates in the pathogenesis of proliferative diabetic retinopathy. Diabetologia. 2007;50:1294–1303. doi: 10.1007/s00125-007-0627-y. [DOI] [PubMed] [Google Scholar]
- 16.Deeg CA, Altmann F, Hauck SM, Schoeffmann S, et al. Down-regulation of pigment epithelium-derived factor in uveitic lesion associates with focal vascular endothelial growth factor expression and breakdown of the blood-retinal barrier. Proteomics. 2007;7:1540–1548. doi: 10.1002/pmic.200600795. [DOI] [PubMed] [Google Scholar]
- 17.de Boer JH, van Haren MA, de Vries-Knoppert WA, Baarsma GS, et al. Analysis of IL-6 levels in human vitreous fluid obtained from uveitis patients, patients with proliferative intraocular disorders and eye bank eyes. Curr Eye Res. 1992;11(Suppl):181–186. doi: 10.3109/02713689208999530. [DOI] [PubMed] [Google Scholar]
- 18.Funatsu H, Yamashita H, Ikeda T, Mimura T, et al. Vitreous levels of interleukin-6 and vascular endothelial growth factor are related to diabetic macular edema. Ophthalmology. 2003;110:1690–1696. doi: 10.1016/S0161-6420(03)00568-2. [DOI] [PubMed] [Google Scholar]
- 19.Hattenbach LO, Allers A, Gumbel HO, Scharrer I, Koch FH. Vitreous concentrations of TPA and plasminogen activator inhibitor are associated with VEGF in proliferative diabetic vitreoretinopathy. Retina. 1999;19:383–389. doi: 10.1097/00006982-199909000-00003. [DOI] [PubMed] [Google Scholar]
- 20.Lam RF, Yuen HK, Lam DS. Vitreous VEGF secretion. Ophthalmology. 2005;112:1483. doi: 10.1016/j.ophtha.2005.01.025. author reply 1483. [DOI] [PubMed] [Google Scholar]
- 21.Nakanishi T, Koyama R, Ikeda T, Shimizu A. Catalogue of soluble proteins in the human vitreous humor: comparison between diabetic retinopathy and macular hole. J Chromatogr B Analyt Technol Biomed Life Sci. 2002;776:89–100. doi: 10.1016/s1570-0232(02)00078-8. [DOI] [PubMed] [Google Scholar]
- 22.Neal RE, Bettelheim FA, Lin C, Winn KC, et al. Alterations in human vitreous humour following cataract extraction. Exp Eye Res. 2005;80:337–347. doi: 10.1016/j.exer.2004.09.015. [DOI] [PubMed] [Google Scholar]
- 23.Ouchi M, West K, Crabb JW, Kinoshita S, Kamei M. Proteomic analysis of vitreous from diabetic macular edema. Exp Eye Res. 2005;81:176–182. doi: 10.1016/j.exer.2005.01.020. [DOI] [PubMed] [Google Scholar]
- 24.Wu CW, Sauter JL, Johnson PK, Chen CD, Olsen TW. Identification and localization of major soluble vitreous proteins in human ocular tissue. Am J Ophthalmol. 2004;137:655–661. doi: 10.1016/j.ajo.2003.11.009. [DOI] [PubMed] [Google Scholar]
- 25.Yamane K, Minamoto A, Yamashita H, Takamura H, et al. Proteome analysis of human vitreous proteins. Mol Cell Proteomics. 2003;2:1177–1187. doi: 10.1074/mcp.M300038-MCP200. [DOI] [PubMed] [Google Scholar]
- 26.Matsumoto H, Komori N. Ocular proteomics: cataloging photoreceptor proteins by two-dimensional gel electrophoresis and mass spectrometry. Methods Enzymol. 2000;316:492–511. doi: 10.1016/s0076-6879(00)16745-x. [DOI] [PubMed] [Google Scholar]
- 27.Carr S, Aebersold R, Baldwin M, Burlingame A, et al. The need for guidelines in publication of peptide and protein identification data: Working Group on Publication Guidelines for Peptide and Protein Identification Data. Mol Cell Proteomics. 2004;3:531–533. doi: 10.1074/mcp.T400006-MCP200. [DOI] [PubMed] [Google Scholar]
- 28.Bradshaw RA. Revised draft guidelines for proteomic data publication. Mol Cell Proteomics. 2005;4:1223–1225. [PubMed] [Google Scholar]
- 29.Tamayo P, Slonim D, Mesirov J, Zhu Q, et al. Interpreting patterns of gene expression with self-organizing maps: methods and application to hematopoietic differentiation. Proc Natl Acad Sci U S A. 1999;96:2907–2912. doi: 10.1073/pnas.96.6.2907. [DOI] [PMC free article] [PubMed] [Google Scholar]
- 30.Blomback B, Blomback M. The molecular structure of fibrinogen. Ann N Y Acad Sci. 1972;202:77–97. doi: 10.1111/j.1749-6632.1972.tb16323.x. [DOI] [PubMed] [Google Scholar]
- 31.Hessel B, Makino M, Iwanaga S, Blomback B. Primary structure of human fibrinogen and fibrin. Structural studies on NH2-terminal part of B beta chain. Eur J Biochem. 1979;98:521–534. doi: 10.1111/j.1432-1033.1979.tb13213.x. [DOI] [PubMed] [Google Scholar]
- 32.Clausen R, Weller M, Wiedemann P, Heimann K, et al. An immunochemical quantitative analysis of the protein pattern in physiologic and pathologic vitreous. Graefes Arch Clin Exp Ophthalmol. 1991;229:186–190. doi: 10.1007/BF00170555. [DOI] [PubMed] [Google Scholar]
- 33.Barzilay JI, Abraham L, Heckbert SR, Cushman M, et al. The relation of markers of inflammation to the development of glucose disorders in the elderly: the Cardiovascular Health Study. Diabetes. 2001;50:2384–2389. doi: 10.2337/diabetes.50.10.2384. [DOI] [PubMed] [Google Scholar]
- 34.Freeman DJ, Norrie J, Caslake MJ, Gaw A, et al. C-reactive protein is an independent predictor of risk for the development of diabetes in the West of Scotland Coronary Prevention Study. Diabetes. 2002;51:1596–1600. doi: 10.2337/diabetes.51.5.1596. [DOI] [PubMed] [Google Scholar]
- 35.Han TS, Sattar N, Williams K, Gonzalez-Villalpando C, et al. Prospective study of C-reactive protein in relation to the development of diabetes and metabolic syndrome in the Mexico City Diabetes Study. Diabetes Care. 2002;25:2016–2021. doi: 10.2337/diacare.25.11.2016. [DOI] [PubMed] [Google Scholar]
- 36.Pradhan AD, Manson JE, Rifai N, Buring JE, Ridker PM. C-reactive protein, interleukin 6, and risk of developing type 2 diabetes mellitus. Jama. 2001;286:327–334. doi: 10.1001/jama.286.3.327. [DOI] [PubMed] [Google Scholar]
- 37.Gerhardinger C, Costa MB, Coulombe MC, Toth I, et al. Expression of acute-phase response proteins in retinal Muller cells in diabetes. Invest Ophthalmol Vis Sci. 2005;46:349–357. doi: 10.1167/iovs.04-0860. [DOI] [PubMed] [Google Scholar]
- 38.El-Ghrably IA, Dua HS, Orr GM, Fischer D, Tighe PJ. Intravitreal invading cells contribute to vitreal cytokine milieu in proliferative vitreoretinopathy. Br J Ophthalmol. 2001;85:461–470. doi: 10.1136/bjo.85.4.461. [DOI] [PMC free article] [PubMed] [Google Scholar]
- 39.Funatsu H, Yamashita H, Sakata K, Noma H, et al. Vitreous levels of vascular endothelial growth factor and intercellular adhesion molecule 1 are related to diabetic macular edema. Ophthalmology. 2005;112:806–816. doi: 10.1016/j.ophtha.2004.11.045. [DOI] [PubMed] [Google Scholar]
- 40.Krady JK, Basu A, Allen CM, Xu Y, et al. Minocycline reduces proinflammatory cytokine expression, microglial activation, and caspase-3 activation in a rodent model of diabetic retinopathy. Diabetes. 2005;54:1559–1565. doi: 10.2337/diabetes.54.5.1559. [DOI] [PubMed] [Google Scholar]
- 41.Limb GA, Alam A, Earley O, Green W, et al. Distribution of cytokine proteins within epiretinal membranes in proliferative vitreoretinopathy. Curr Eye Res. 1994;13:791–798. doi: 10.3109/02713689409025133. [DOI] [PubMed] [Google Scholar]
- 42.Bonini-Filho MA, Jorge R, Barbosa JC, Calucci D, et al. Intravitreal Injection Versus Sub-Tenon’s Infusion of Triamcinolone Acetonide for Refractory Diabetic Macular Edema: A Randomized Clinical Trial. Invest Ophthalmol Vis Sci. 2005;46:3845–3849. doi: 10.1167/iovs.05-0297. [DOI] [PubMed] [Google Scholar]
- 43.Larsson J, Zhu M, Sutter F, Gillies MC. Relation between reduction of foveal thickness and visual acuity in diabetic macular edema treated with intravitreal triamcinolone. Am J Ophthalmol. 2005;139:802–806. doi: 10.1016/j.ajo.2004.12.054. [DOI] [PubMed] [Google Scholar]
- 44.Letcher RL, Chien S, Pickering TG, Laragh JH. Elevated blood viscosity in patients with borderline essential hypertension. Hypertension. 1983;5:757–762. doi: 10.1161/01.hyp.5.5.757. [DOI] [PubMed] [Google Scholar]
- 45.Lominadze D, Joshua IG, Schuschke DA. Increased erythrocyte aggregation in spontaneously hypertensive rats. Am J Hypertens. 1998;11:784–789. doi: 10.1016/s0895-7061(98)00056-9. [DOI] [PubMed] [Google Scholar]
- 46.Kannel WB, D’Agostino RB, Belanger AJ, Sibershatz H, Tofler GT. Long-term influence of fibrinogen on initial and recurrent cardiovascular events in men and women. Am J Cardiol. 1996;78:90–92. doi: 10.1016/s0002-9149(96)00232-9. [DOI] [PubMed] [Google Scholar]
- 47.Stec JJ, Silbershatz H, Tofler GH, Matheney TH, et al. Association of fibrinogen with cardiovascular risk factors and cardiovascular disease in the Framingham Offspring Population. Circulation. 2000;102:1634–1638. doi: 10.1161/01.cir.102.14.1634. [DOI] [PubMed] [Google Scholar]
- 48.Woodward M, Lowe GD, Rumley A, Tunstall-Pedoe H. Fibrinogen as a risk factor for coronary heart disease and mortality in middle-aged men and women. The Scottish Heart Health Study. Eur Heart J. 1998;19:55–62. doi: 10.1053/euhj.1997.0573. [DOI] [PubMed] [Google Scholar]
- 49.Borsey DQ, Prowse CV, Gray RS, Dawes J, et al. Platelet and coagulation factors in proliferative diabetic retinopathy. J Clin Pathol. 1984;37:659–664. doi: 10.1136/jcp.37.6.659. [DOI] [PMC free article] [PubMed] [Google Scholar]
- 50.Kostraba JN, Klein R, Dorman JS, Becker DJ, et al. The epidemiology of diabetes complications study. IV. Correlates of diabetic background and proliferative retinopathy. Am J Epidemiol. 1991;133:381–391. doi: 10.1093/oxfordjournals.aje.a115892. [DOI] [PubMed] [Google Scholar]
- 51.Shiose S, Hata Y, Noda Y, Sassa Y, et al. Fibrinogen stimulates in vitro angiogenesis by choroidal endothelial cells via autocrine VEGF. Graefes Arch Clin Exp Ophthalmol. 2004;242:777–783. doi: 10.1007/s00417-004-0910-2. [DOI] [PubMed] [Google Scholar]
- 52.Mosesson MW, Siebenlist KR, Meh DA. The structure and biological features of fibrinogen and fibrin. Ann N Y Acad Sci. 2001;936:11–30. doi: 10.1111/j.1749-6632.2001.tb03491.x. [DOI] [PubMed] [Google Scholar]
- 53.Cao W, Tombran-Tink J, Chen W, Mrazek D, et al. Pigment epithelium-derived factor protects cultured retinal neurons against hydrogen peroxide-induced cell death. J Neurosci Res. 1999;57:789–800. [PubMed] [Google Scholar]
- 54.Dawson DW, Volpert OV, Gillis P, Crawford SE, et al. Pigment epithelium-derived factor: a potent inhibitor of angiogenesis. Science. 1999;285:245–248. doi: 10.1126/science.285.5425.245. [DOI] [PubMed] [Google Scholar]
- 55.Duh EJ, Yang HS, Haller JA, De Juan E, et al. Vitreous levels of pigment epithelium-derived factor and vascular endothelial growth factor: implications for ocular angiogenesis. Am J Ophthalmol. 2004;137:668–674. doi: 10.1016/j.ajo.2003.11.015. [DOI] [PubMed] [Google Scholar]
- 56.Ogata N, Nishikawa M, Nishimura T, Mitsuma Y, Matsumura M. Inverse levels of pigment epithelium-derived factor and vascular endothelial growth factor in the vitreous of eyes with rhegmatogenous retinal detachment and proliferative vitreoretinopathy. Am J Ophthalmol. 2002;133:851–852. doi: 10.1016/s0002-9394(02)01406-x. [DOI] [PubMed] [Google Scholar]
- 57.Wang XF, Cui JZ, Nie W, Prasad SS, Matsubara JA. Differential gene expression of early and late passage retinal pigment epithelial cells. Exp Eye Res. 2004;79:209–221. doi: 10.1016/j.exer.2004.03.013. [DOI] [PubMed] [Google Scholar]
- 58.Gwon JS, Kim IB, Lee MY, Oh SJ, Chun MH. Expression of clusterin in Muller cells of the rat retina after pressure-induced ischemia. Glia. 2004;47:35–45. doi: 10.1002/glia.20021. [DOI] [PubMed] [Google Scholar]
- 59.Hayasaka S, Hara S, Mizuno K. Partial purification and properties of cathepsin D in the retinal pigment epithelium. Invest Ophthalmol. 1975;14:617–620. [PubMed] [Google Scholar]
- 60.Yamada T, Hara S, Tamai M. Immunohistochemical localization of cathepsin D in ocular tissues. Invest Ophthalmol Vis Sci. 1990;31:1217–1223. [PubMed] [Google Scholar]
- 61.Boulton M, Moriarty P, Jarvis-Evans J, Marcyniuk B. Regional variation and age-related changes of lysosomal enzymes in the human retinal pigment epithelium. Br J Ophthalmol. 1994;78:125–129. doi: 10.1136/bjo.78.2.125. [DOI] [PMC free article] [PubMed] [Google Scholar]
- 62.Hayasaka S, Hara S, Mizuno K. Lysosomal enzymes in subretinal fluid. Albrecht Von Graefes Arch Klin Exp Ophthalmol. 1976;200:13–20. doi: 10.1007/BF00411429. [DOI] [PubMed] [Google Scholar]
- 63.Cavallaro T, Martone RL, Dwork AJ, Schon EA, Herbert J. The retinal pigment epithelium is the unique site of transthyretin synthesis in the rat eye. Invest Ophthalmol Vis Sci. 1990;31:497–501. [PubMed] [Google Scholar]
- 64.Martone RL, Schon EA, Goodman DS, Soprano DR, Herbert J. Retinol-binding protein is synthesized in the mammalian eye. Biochem Biophys Res Commun. 1988;157:1078–1084. doi: 10.1016/s0006-291x(88)80984-7. [DOI] [PubMed] [Google Scholar]
- 65.Jordan-Starck TC, Lund SD, Witte DP, Aronow BJ, et al. Mouse apolipoprotein J: characterization of a gene implicated in atherosclerosis. J Lipid Res. 1994;35:194–210. [PubMed] [Google Scholar]
- 66.Jenne DE, Tschopp J. Clusterin: the intriguing guises of a widely expressed glycoprotein. Trends Biochem Sci. 1992;17:154–159. doi: 10.1016/0968-0004(92)90325-4. [DOI] [PubMed] [Google Scholar]
- 67.May PC, Robison P, Fuson K, Smalstig B, et al. Sulfated glycoprotein-2 expression increases in rodent brain after transient global ischemia. Brain Res Mol Brain Res. 1992;15:33–39. doi: 10.1016/0169-328x(92)90148-5. [DOI] [PubMed] [Google Scholar]
- 68.Klimaschewski L, Obermuller N, Witzgall R. Regulation of clusterin expression following spinal cord injury. Cell Tissue Res. 2001;306:209–216. doi: 10.1007/s004410100431. [DOI] [PubMed] [Google Scholar]
- 69.Agarwal N, Jomary C, Jones SE, O’Rourke K, et al. Immunocytochemical colocalization of clusterin in apoptotic photoreceptor cells in retinal degeneration slow rds mutant mouse retinas. Biochem Biophys Res Commun. 1996;225:84–91. doi: 10.1006/bbrc.1996.1134. [DOI] [PubMed] [Google Scholar]
- 70.Rakoczy PE, Lai CM, Baines M, Di Grandi S, et al. Modulation of cathepsin D activity in retinal pigment epithelial cells. Biochem J. 1997;324(Pt 3):935–940. doi: 10.1042/bj3240935. [DOI] [PMC free article] [PubMed] [Google Scholar]
- 71.Jacobson DR, Pastore RD, Yaghoubian R, Kane I, et al. Variant-sequence transthyretin (isoleucine 122 in late-onset cardiac amyloidosis in black Americans. N Engl J Med. 1997;336:466–473. doi: 10.1056/NEJM199702133360703. [DOI] [PubMed] [Google Scholar]
- 72.Sanner MF, Olson AJ, Spehner JC. Reduced surface: an efficient way to compute molecular surfaces. Biopolymers. 1996;38:305–320. doi: 10.1002/(SICI)1097-0282(199603)38:3%3C305::AID-BIP4%3E3.0.CO;2-Y. [DOI] [PubMed] [Google Scholar]
- 73.Hamilton JA, Benson MD. Transthyretin: a review from a structural perspective. Cell Mol Life Sci. 2001;58:1491–1521. doi: 10.1007/PL00000791. [DOI] [PMC free article] [PubMed] [Google Scholar]
- 74.Felding P, Fex G. Cellular origin of prealbumin in the rat. Biochim Biophys Acta. 1982;716:446–449. doi: 10.1016/0304-4165(82)90040-x. [DOI] [PubMed] [Google Scholar]
- 75.Dickson PW, Howlett GJ, Schreiber G. Rat transthyretin (prealbumin). Molecular cloning, nucleotide sequence, and gene expression in liver and brain. J Biol Chem. 1985;260:8214–8219. [PubMed] [Google Scholar]
- 76.Soprano DR, Herbert J, Soprano KJ, Schon EA, Goodman DS. Demonstration of transthyretin mRNA in the brain and other extrahepatic tissues in the rat. J Biol Chem. 1985;260:11793–11798. [PubMed] [Google Scholar]
- 77.Gao BB, Clermont A, Rook S, Fonda SJ, et al. Extracellular carbonic anhydrase mediates hemorrhagic retinal and cerebral vascular permeability through prekallikrein activation. Nat Med. 2007;13:181–188. doi: 10.1038/nm1534. [DOI] [PubMed] [Google Scholar]