Abstract
We computationally investigate the unsteady pulsatile propagation of a finger of air through a liquid-filled cylindrical rigid tube using a combined boundary element method and lubrication theory approach. The flow-field is governed by the dimensionless parameters CaQ(t) = CaM + CaΩ sin(Ωt) = μQ*(t*)/πR2γ, Ω = μωR/γ and A = 2CaΩ/Ω. Here, CaQ(t) consists of both mean (CaM) and oscillatory (CaΩ) components. It is shown that the behavior of this system is appropriately described by steady-state responses until the onset of reverse flow, wherein the system operates in the unsteady regime (CaΩ > CaM). When flows in this regime are considered, converging and diverging stagnation points move dynamically throughout the cycle and may temporarily separate from the interface at high Ω. We have also found that for CaΩ < 10CaM the bubble tip pressure drop ΔPtip may be estimated accurately from the pressure measured downstream of the bubble tip when corrections for the pressure drop due to Poiseuille flow are applied. The normal stress gradient at the tube wall (∂τn/∂z) is discussed in detail, as this is believed to be the primary factor in airway epithelial cell damage (Bilek et al 2003). In the unsteady regime we find that local film-thinning produces high ∂τn/∂z at low CaΩ. Film thickening at moderate CaΩ in the unsteady regime protects the tube wall from the large gradients near the bubble tip, therefore reducing ∂τn/∂z. We find that the stress field is highly dynamic and exhibits intriguing spatial and temporal characteristics that may be of interest to our field of study, pulmonary airway reopening.
1. Introduction
The goal of this paper is to elucidate a solution of the pulsatile propagation of a semi-infinite air finger through a fluid occluded rigid circular tube. Solution of the free surface problem is achieved with an axisymmetric formulation of the boundary element method (BEM) coupled to lubrication theory in the upstream thin film region. The model formulation and solution methods discussed herein may be of underlying importance to various applications including flow through porous media and the design of microfluidic devices. These studies may also be of importance to biological fluid mechanics applications such as pulmonary airway reopening, erythrocyte migration and embolic events in distal capillaries. The relevance of these studies to problems of physiologic importance can be found in review articles by (Gaver III et al 2006; Grotberg 2001).
Initial experimental investigations conducted by Fairbrother & Stubbs (1935), Bretherton (1961), and Cox (1962) of steady, semi-infinite bubble propagation through a rigid tube demonstrated a correlation between residual film thickness far upstream of the bubble and the dimensionless fluid capillary number . Ca is a function of fluid viscosity (μ), surface tension (γ), and the average fluid velocity downstream of the bubble tip ; representing the balance of viscous and surface tension induced forces. Bretherton extended experimental results to the limit of vanishing Ca via matched asymptotic analysis, determining that . Park & Homsy (1984) followed Bretherton's groundbreaking work to formalize the low Ca asymptotic analysis with perturbation theory. Ratulowski & Chang (1989) used an arclength-angle formulation of a composite lubrication equation to extend the asymptotic analysis to higher Ca.
We simulate this system to capture the complex interfacial and flow field dynamics. Mesh based computational studies using finite difference routines (Reinelt & Saffman 1985; Wassmuth et al 1993) and the finite element method (Giavedoni & Saitia 1997; Heil 2001; Shen & Udell 1985) have been successfully employed under steady state conditions. Application of the boundary element method (BEM), our chosen technique, to air finger propagation in channels was pioneered by Lu & Chang (1988) and followed by Ingham et al (1992) and Halpern & Gaver III (1994). This computational scheme was selected because of the inherent efficiency of the method, which requires meshing and computations only at node points along the boundary of the domain. With axial symmetry and the addition of lubrication theory approximations in the thin film region, where BEM computations demand excessive resources, computational costs for the time-dependent simulation are tractable.
In the Results section we investigate the following characteristics: the dimensionless bubble tip pressure drop ΔPtip, extrapolated ΔPtip (defined below), curvature κtip, velocity Utip, and upstream bubble radius β. We consider the time-dependent behavior of these properties as well as trends occurring at fixed mean capillary number CaM and oscillatory amplitude A over a range of dimensionless frequencies Ω. In the Discussion section we explore the implications of these flows on the temporally and spatially dependent normal stress gradient ∂τn/∂z, because this mechanical stress component has been shown to be of fundamental importance to the damage of pulmonary epithelial cells that may relate to ventilator-induced lung injury (Gaver III et al 2006).
2. Problem Formulation
We examine the oscillatory progression of a semi-infinite finger of air through a rigid, cylindrical tube of radius R containing a Newtonian fluid of viscosity μ and a constant surface tension γ (Figure 1). The dynamics of the air phase are neglected and the reference pressure in this region is P = 0. We assume axial symmetry (r* = (r*, z*)). s* defines the arc-length coordinate along the air-liquid interface, originating at the bubble tip and spanning through the boundary element method (BEM) and lubrication theory (LUBE) regions.
Figure 1.
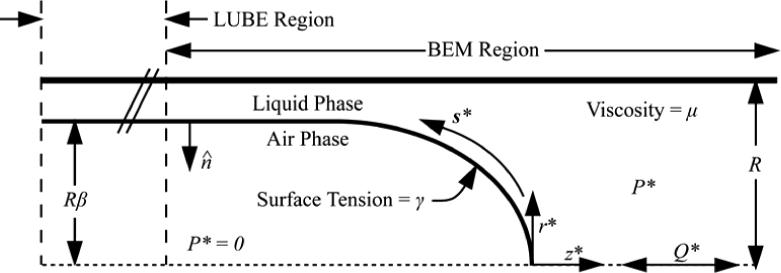
Model
Bubble motion is induced by downstream flow, dictating the behavior of the air finger by conservation of mass. The downstream flow rate (Q*(t*)) is defined according to [2.1], consisting of mean () and oscillatory () components.
| [2.1] |
The dimensional frequency ω determines the period of oscillation. The reopened region far upstream of the bubble tip is of radius rmen = Rβ. Since the interface is a free surface, β is determined as part of the solution.
2.1 Governing equations, BEM region
Governing equations for fluid motion are scaled using the parameters shown in [2.2], with dimensional quantities denoted with an asterisk (*).
| [2.2] |
The velocity scale U = γ/μ, a balance between surface tension and viscous forces, represents the interfacial relaxation velocity. All lengths are scaled by the tube radius R, and time is scaled naturally with velocity and length. The Law of Laplace defines the pressure scale. We pose the governing equations and boundary conditions in the laboratory frame of reference. Below (§3.5, §3.6) time stepping is described, which will allow our simulations to focus on the bubble tip region of interest.
We assume inertial effects are negligible and the unsteadiness in the problem arises from the kinematic boundary condition (limitations associated with this assumption are addressed in §5.3). The flow field is thus described by the dimensionless Stokes equation [2.3] and continuity equation [2.4].
| [2.3] |
| [2.4] |
The flow is driven far downstream with an imposed velocity profile
| [2.5] |
scaling [2.1] yields the dimensionless downstream flow rate
| [2.6] |
The dimensionless parameters describing the system are:
| [2.7] |
CaQ(t) is a capillary number that represents balance between viscous and surface tension effects, consisting of mean (CaM) and sinusoidal oscillatory (CaΩ) components. UAVG(t) represents the average velocity across a cross-section in the downstream region, equal to Q*(t)/πR2. By conservation of mass Q*(t) also represents the gas flow rate into the finger of air from the upstream end. The dimensionless frequency (Ω) and amplitude (A) parameterize bubble oscillation. A specifies the peak to peak oscillatory stroke length of the bubble tip , where is the average bubble radius. In our simulations we define A, Lstroke and are determined through the solution process.
No slip and no penetration are enforced at tube wall [2.8]:
| [2.8] |
The interfacial stress jump condition is defined as
| [2.9] |
where σ is the stress tensor for the for the viscous occluding fluid, n̂men is the outward facing interfacial normal vector, and κ is the 3-dimensional interfacial curvature.
2.2 Governing equations, LUBE region
In the region of the model governed by lubrication theory the evolution equation for the radial position of the meniscus [2.13] is obtained from the z-component of the full Navier-Stokes equation. We simplify by assuming radial symmetry (as dictated by the BEM formulation), viscous dominated flow, and that the ratio of radial to axial length scales is small following a long-wavelength approximation
| [2.10] |
Integrating [2.10] twice w.r.t. r, applying the boundary conditions and , then scaling with [2.2] yields the axial velocity in the lubrication region:
| [2.11] |
where κz is the curvature derivative in the z-direction. We integrate the velocity over the cross-sectional area of the fluid to determine the flow rate Q, from which we attain the flow derivative in the z direction ∂Q/∂z.
Differentiating Q w.r.t. z and applying Leibnitz's rule produces the relationship between the evolution equation and the flow derivative
| [2.12] |
into which we substitute ∂Q/∂z to obtain the evolution equation in the lubrication region
| [2.13] |
It should be noted that if the bubble speed varies too rapidly, spatial gradients in film thickness will be created that may violate the (implicit) lubrication approximation by having too short a lengthscale. By introducing the lubrication region far upstream of the bubble tip, the significance of these errors is reduced in the bubble tip region that is modeled using the BEM formulation.
3. Method of Solution
We pose a problem formulation base in the laboratory frame of reference (i.e. fixed walls), which would result in inappropriately large domains when solved over long periods of time. To prevent this, the governing equations are solved in the laboratory frame and kinematically translated into the bubble tip frame of reference (i.e. the velocity of the bubble tip is zero). This process is further described below in §3.5.
3.1 Boundary element method (BEM)
The boundary element method is utilized to determine the flow field in the region of the model surrounding the bubble tip (Figure 1 and Figure 2). Ladyzhenskaya (1963) showed that
| [2.14] |
where Tik and Uik are the traction and velocity kernels, ui is the velocity vector, and τi is the traction vector τ = σfluid•n̂. The axisymmetric form of the kernels used in this simulation may be found on pages 132−135 and appendix D in Becker (1992). Integrals are evaluated over positions y that describe the boundary S. The solution vector uk = f(x) describes points x within the bounded domain. Near the boundary of the domain [2.14] is re-written as
| [2.15] |
where cik accounts for the stress discontinuities occurring at the boundary. To numerically implement this formulation the axisymmetric domain is discretized into Nelm 3-node quadratic elements as shown in Figure 2. Four degrees of freedom (DOF) exist at each BEM node: ur, uz, τr, τz. Velocity (u) and/or stress (τ) boundary conditions are applied on two of the four degrees of freedom. Nodes adjacent to two surfaces (Figure 2) have 4 DOF for each surface, as discussed in Zimmer et al (2005). The discrete formulation of [2.15]
| [2.16] |
is then evaluated for each node, where Sm represents the boundary of element m. Numeric evaluation of the integrands in [2.16] for each element using standard Gaussian quadrature techniques yields
| [2.17] |
The matrices T and U are of size 2N × 2N and 2N × 3N respectively, where N is the number of nodes. The vector w contains the velocities in the form w2j-1 = uzj, w2j = urj and t contains stress data t2j-1 = τzj and t2j = τrj, where and j = 1,2,...,N. U is 2N × 3N so that two stresses may defined at the corner nodes. Either the velocity or stress is known at each corner. With this [2.17] can be arranged into the Ax = b form where A is 2N × 2N, x is 2N and contains the unknown velocities and stresses, and b hold the known velocities and stresses obtained from the boundary conditions. We then solve for the unknown velocities and stresses with Gaussian elimination. When the solution at the boundary has been obtained, [2.14] can be used to determine the internal velocity field.
Figure 2.
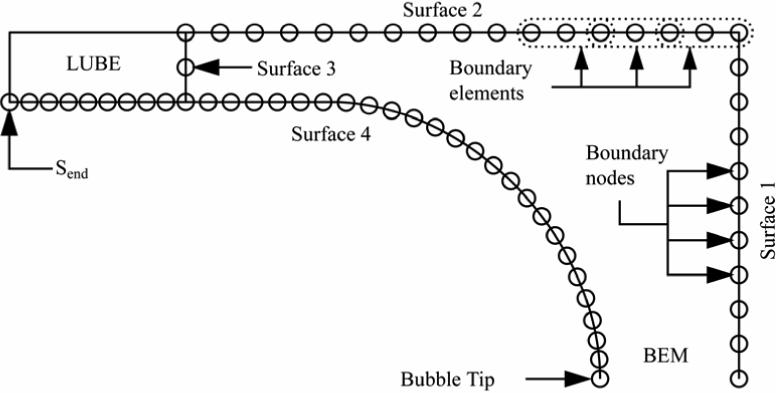
Computational Domain
3.2 Boundary conditions: BEM region
As described in Halpern & Gaver III (1994) and Zimmer et al (2005), boundary conditions must be carefully set to generate accurate results. This entails the definition of mixed conditions at the corner points as described in the Appendix. Flow through the downstream surface of the model (Surface 1 in Figure 2) is defined by the instantaneous capillary number CaQ(t) [2.6]. Along the tube wall no slip and no penetration are enforced via velocity conditions. At the interface (Surface 4 in Figure 2), τr and τz are obtained from [2.9]. For a complete description of the boundary conditions in the BEM domain see Table 1 in the Appendix.
3.3 Lubrication theory
Lubrication theory is used to describe the flow field in the upstream region of the model, reducing the length of the BEM domain and providing boundary conditions on the adjacent BEM region (Figure 2, surface 3). Following standard lubrication theory approximations, the evolution equation [2.13] is obtained as described in §2.2. The curvature κ and the curvature spatial derivatives κz and κzz are continuous throughout the BEM and LUBE regions of the model due to the implementation of a master surface spanning the length of the domain.
3.4 Boundary conditions: LUBE region, BEM/LUBE boundary
In the LUBE region, nodes are fixed axially; the radial velocity is defined by the evolution equation [2.13]. Connection of the two domains through the master cubic spline and the shared boundary condition produces a continuous description of the flow field and interfacial behavior. At the boundary between the BEM and LUBE regions axial velocity and radial stress conditions are enforced. As at the downstream end of the BEM region, shear stress is defined on the corner nodes by differentiating the velocity profile.
3.5 Kinematic translation, tip frame of reference
Solution of the boundary integral equations for a given time step produces a quasi-steady-state solution. To analyze time-dependant behavior a kinematic boundary condition is applied to the free surface in conjunction with the time-dependant flow rate. To prevent elongation of the computational domain nodal positions are kinematically translated in the bubble tip frame of reference by subtracting the tip velocity from the axial velocity at each node point. This allows the tip of the bubble to remain fixed at the origin while solving the equations of motion in the laboratory frame of reference. In the BEM region we apply the following condition:
| [2.18] |
where M = (rm(s,t), zm(s,t)) is the interfacial position vector. Details of this technique are provided by (Zimmer et al 2005). Likewise, in the lubrication region we apply
| [2.19] |
3.6 Time stepping
The time-dependent evolution of the meniscus and flow field is determined by the NetLib routine DLSODES (Double precision Livermore Solver for Ordinary Differential Equations with general Sparse Jacobian matrices), operating on a master domain spanning the BEM and LUBE regions. Nodal positions are redistributed every ¼ cycle, with increased nodal density in the tip region.
3.7 Convergence
We assessed the convergence of our solutions by investigating the impact of critical properties of our solutions (bubble tip pressure drop ΔPtip, bubble tip curvature κtip, tip velocity Utip) as a function of the nodal density and extent of the boundary element domain. Nodal density on the free surface was determined by iterating the steady state solution of Ca(t) = 0.1 with an increasing number of interfacial nodes. The interfacial nodal density was selected so that the maximum change in the solution variables per additional element was less than 5e-5. Comparison of steady state results over 0.01 < CaQ < 1.3 with the simulations of Reinelt & Saffman (1985) show a maximum difference in predicted film thickness < 0.5% and bubble tip pressure drop < 1.6%, demonstrating excellent agreement between the two methods.
The normal component of velocity at the air-liquid interface in the frame of reference of the moving tip was used to define convergence in steady state simulations. When the maximum normal velocity throughout the BEM and LUBE regions was less than 5×10⁻⁸, the steady state was considered converged. Convergence in oscillatory simulations was determined by comparing results from previous cycles. ΔPtip, κtip, and Utip were compared at 144 temporal points per cycle; when the maximum difference of these characteristics varied by less than 10−5 between cycles the oscillatory simulation was considered converged.
In order to determine the appropriate domain length for the BEM region, solutions were calculated for BEM regions over zLFT < z < zRT, where zLFT defines the juncture between the BEM region and the thin-film region that is modeled using lubrication approximations, and zRT is the downstream extent of the BEM domain (typically, zRT = 3). Solutions for A = 1, CaM = 0.01, Ω = 0.06 were calculated with the length of the domain ranging over −14 < zLFT < −0.6 with a fixed nodal density. Bubble tip parameters ΔPtip, Utip, and κtip were insensitive to zLFT for zLFT < −3, so solutions were calculated with the BEM region over −4 < z < 3.
4. Results
4.1 Flow field
As a baseline, we consider the flow field occurring at CaM = 0.01, Ω = 0.04, A = 5. In Figure 3 the dynamic nature of the flow field is introduced by demonstrating the time-dependent streamlines at points throughout the oscillatory cycle. As such, panels a-f present instantaneous streamlines every 1/6th cycle, and identify the time-dependent locations of converging (+) and diverging (-) stagnation points as well a separatrix (X) that temporarily exists during deceleration. These stagnation points are emphasized because of their importance in interfacial transport (Stebe & Barthes-Biesel 1995; Stebe & Maldarelli 1994; Zimmer et al 2005). Note that since this is an unsteady flow, the interface is not a streamline and therefore streamlines may intersect the free surface.
Figure 3.
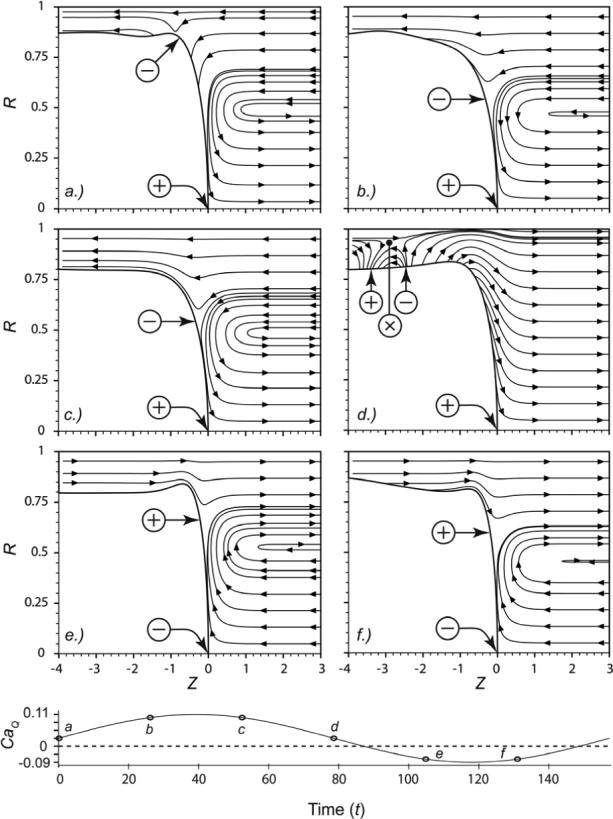
Instantaneous streamlines, bubble tip frame of reference. CaM = 0.01, Ω = 0.04, A = 5, CaΩ = 0.1. Converging stagnation points are represented with (+), diverging stagnation points with (-), and stagnation points separated from the interface (separatrices) are indicated with (X).
Figure 3a shows flows that exist at CaQ = CaM in the accelerating phase produce a converging stagnation point (+) at the bubble tip and a diverging stagnation point (-) in the transition region between the bubble tip to the thin-film (similar to steady-state flows). As the flow rate is increased to a maximum of CaQ(t) = CaM + CaΩ (Figure 3a –b) the transition region diverging stagnation point (-) migrates towards the bubble tip. Subsequently, as CaQ(t) decreases towards CaM (Figure 3c and d) the transition region stagnation point migrates along the interface away from the bubble tip, eventually separating from the free surface to create a separatrix (denoted by X in Figure 3d) and ultimately dissipating at the wall. It is important to note the dissimilarities between Figure 3a and Figure 3d. While both of these flows occur at CaQ(t) = CaM – unlike the accelerating phase, the decelerating phase bears little similarity to the steady-state flow field that would exist at CaM, as it includes two converging stagnation points in addition to the separatrix. This behavior clearly demonstrates that the time-dependent nature of the system modifies the interfacial geometry and flow field even though inertia is not included in this model. In addition, the separatrix was not observed in prior 2-D planar investigations of pulsatile flow (Zimmer et al 2005), highlighting the importance of geometry on the flow fields.
When flow reversal occurs (CaQ(t) < 0), the stagnation points change polarity with the bubble tip transforming from convergent (+) to divergent (-), and the transition region stagnation point becoming convergent (Figure 3e and f). With increasing Ω, the reverse-flow transition region stagnation point (+) may also separate from the interface and convect into the bulk of the fluid. The local film thinning occurring in the accelerating phase of the reverse stroke (Figure 3e) plays a significant role in the normal stress gradient ∂τn/∂z, this effect is discussed in §5.1
4.2 Hysteresis Loops
Figure 4 presents hysteresis loops that demonstrate the dynamic relationship between the key system responses ΔPtip, extrapolated ΔPtip, κtip, and CaQ(t). The extrapolated ΔPtip, (ΔPtip)ext, is determined from the pressure at the downstream boundary by subtracting the instantaneous Poiseuille flow viscous pressure drop Pμ = 8LDOWNCaQ(t) that occurs between bubble tip and downstream end of the domain, LDOWN = zRT. Practically, (ΔPtip)ext is an important quantity because this characteristic is measurable experimentally, while it is not possible to directly measure ΔPtip. We therefore seek to determine whether (ΔPtip)ext is an adequate measure of the tip pressure drop.
Figure 4.
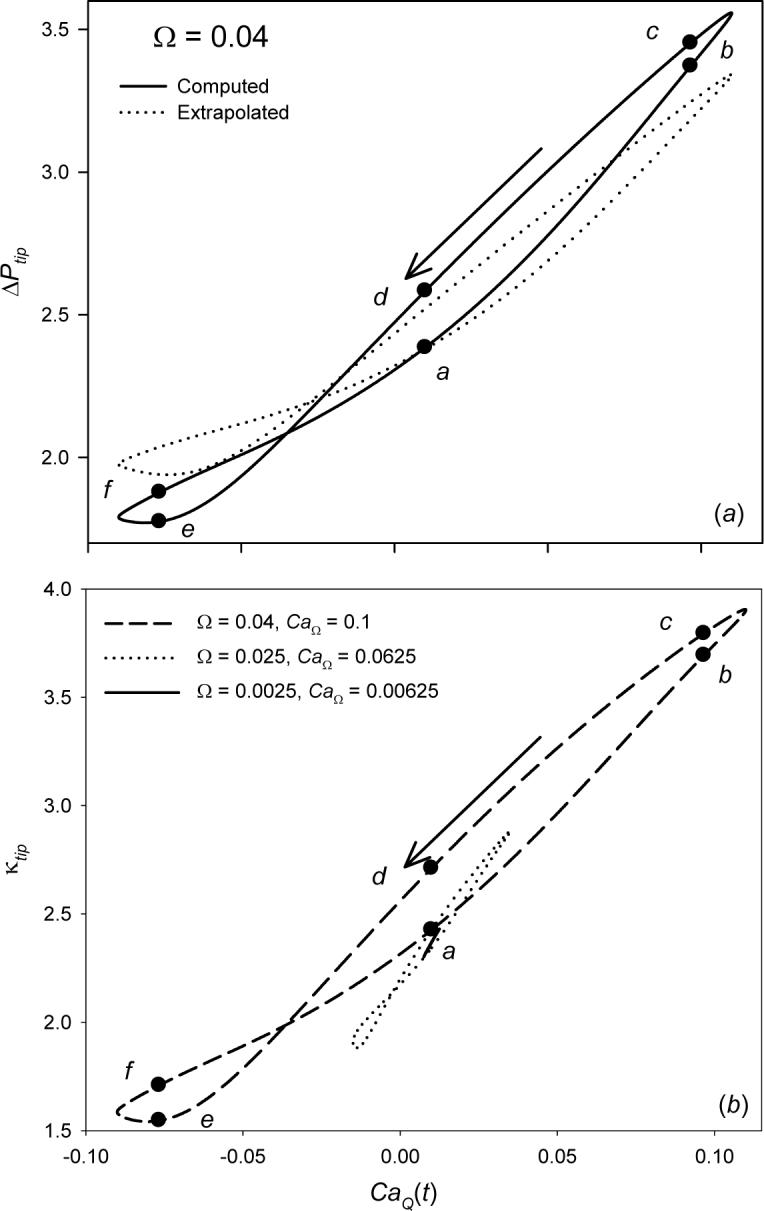
Bubble tip pressure drop ΔPtip (a) and curvature κtip (b) hysteresis loops for CaM = 0.01, A = 5. Symbols a-f correspond to streamlines shown in Figure 3.
Figure 4a shows hysteresis loops of ΔPtip and (ΔPtip)ext over one cycle for CaM = 0.01, A = 5, and Ω = 0.04. (ΔPtip)ext follows the same qualitative pattern as ΔPtip, indicating that downstream pressure measurements can be used to experimentally evaluate interfacial pressure jumps (cycle-averaged quantitative comparison is provided below). In the region CaQ(t) ≥ CaM the hysteresis loop rotates in the counter-clockwise direction, and ΔPtip increases with CaQ(t) so that ΔPtip is greater on the deceleration phase. Streamlines corresponding to this behavior are shown in Figure 3a-d, which correspond to the points a-d in Figure 4. We find that at large CaM or small A the entire hysteresis loop rotates in the counter-clockwise direction. However, as shown in Figure 3 and Figure 4, for small CaM or large A the hysteresis loops cross in the reverse flow region (CaQ < 0, points e and f). This results in a portion of the hysteresis loop that rotates in the clockwise direction. Note that the large A is critical to this behavior, as it allows for a significant region of film thickening during the cycle. For example, if one fixes CaΩ = AΩ/2 by decreasing A and increasing Ω, then the hysteresis area increases and the cross-over region is eventually eliminated.
In order to fully understand the behavior of ΔPtip, it is instructive to investigate the dynamic tip curvature, κtip (Figure 4b). Clearly, ΔPtip is consistent with κtip – this occurs because curvature is a major component of the interfacial stress condition [2.9]; qualitative differences arising between κtip and ΔPtip are a result of viscous effects that become more significant as Ω is increased. In the forward portion of the oscillatory cycle, κtip increases with increasing CaQ(t) until the maximum velocity (CaQ = CaM + CaΩ) is reached. Subsequent deceleration results in local film thickening that increases the tip curvature (compare Figure 3a to Figure 3d) and, hence, increases ΔPtip. This behavior results in the counterclockwise direction of the hysteresis loop.
The clockwise rotation of the ΔPtip and κtip hysteresis loops occur in the portion of the cycle where CaQ(t) < 0 when A is large (see above). The κtip response shows that the curvature is reduced as the bubble travels in the –z direction (which results in the blunting of the bubble tip), causing a commensurate decrease in ΔPtip. κtip (and hence ΔPtip) increases in the accelerating phase near the minimum velocity (compare Figure 3e to Figure 3f), yielding the clockwise orientation.
4.3 Cycle-averaged results
To elucidate the trends present over the range of parameters considered herein (CaM = 0.01, 0.05, 0.1; A = 1, 5 and 5 × 10⁻⁴ ≤ Ω ≤ 10), we present the cycle-averaged results in Figure 5 -Figure 7. Generally, when CaΩ < CaM quasi-steady behavior is observed and when CaΩ > CaM the cycle-averaged data are modified from the steady-state response. This modification results from the reverse flow that exists during a portion of the cycle when CaΩ > CaM, we term this the ‘unsteady regime.’
Figure 5.
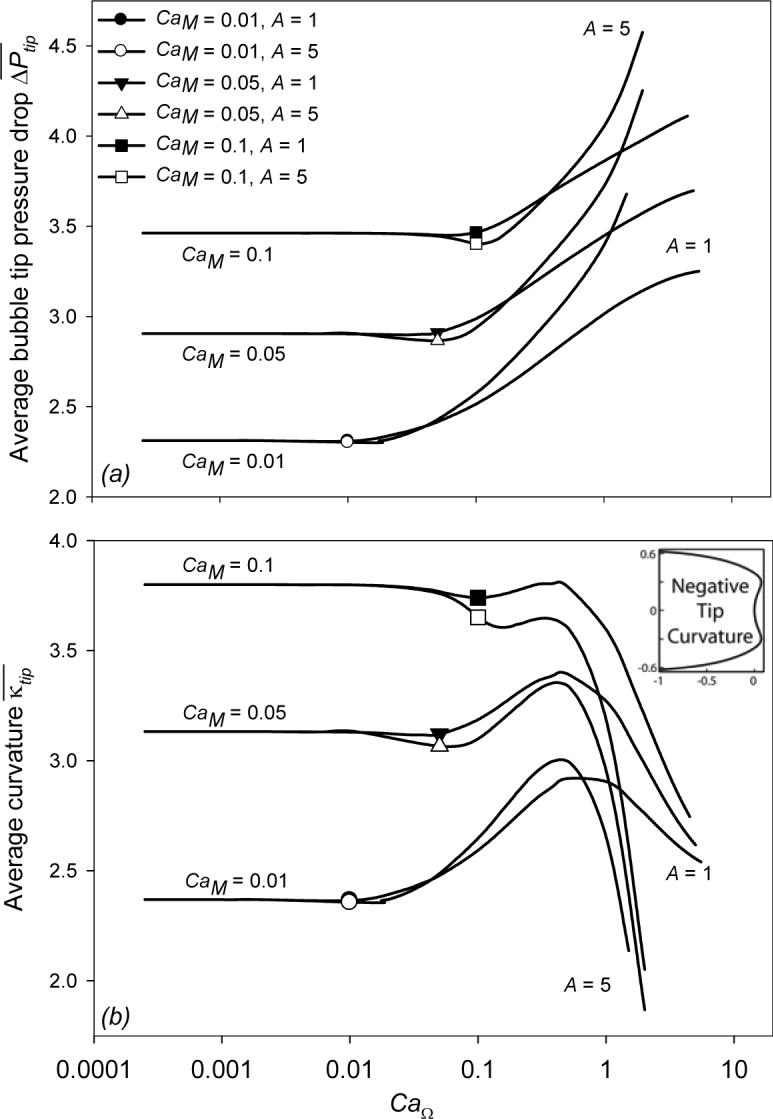
Cycle averaged bubble tip pressure drop ΔP̄tip (a) and curvature (b). Symbols indicate the dimensionless frequency where CaΩ = CaM, data to the right of symbols indicate the unsteady regime and the presence of reverse flow. Inset region is representative of the interfacial geometry when κtip < 0.
Figure 7.
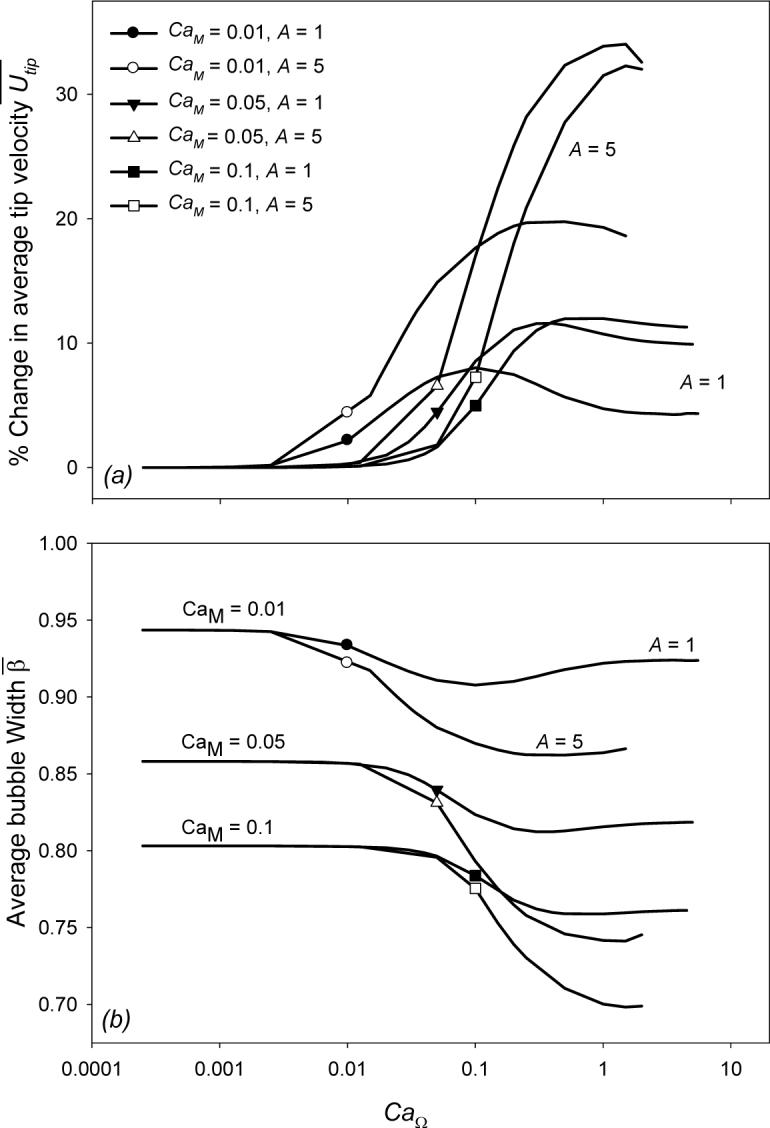
Cycle averaged percent change in bubble tip velocity ΔŪtip (a) and bubble half width (b). Symbols indicate the dimensionless frequency where CaΩ = CaM, data to the right of symbols indicate the unsteady regime and the presence of reverse flow.
In the unsteady regime the cycle-averaged bubble tip curvature (Figure 5b) initially increases with CaΩ. This increase in is consistent with the hysteresis loops shown in Figure 4b, which clearly demonstrates that an increase in CaΩ leads to a net upward shift of the hysteresis loops. Subsequently, Figure 5b demonstrates that a further increase in CaΩ yields a precipitous reduction in . This behavior occurs because κtip becomes negative for a portion of the oscillatory cycle (see inset of Figure 5b); meanwhile, κtip during the large CaQ forward stroke approaches a constant (Halpern & Gaver III 1994). As a result, the is reduced. As A is increased the reduction in is more abrupt because the bubble tip becomes inverted for an extended period of the cycle.
Analogous to , The cycle-averaged bubble tip pressure drop ΔP̄tip (Figure 5a) is unaffected by frequency unless reverse flow occurs (CaΩ > CaM). In this unsteady regime, ΔP̄tip exhibits a monotonic increase, with ΔP̄tip initially increasing in concert with . This correlation between ΔP̄tip and is consistent with the hysteresis loops shown in Figure 4. However, at high CaΩ this correlation is broken – ΔP̄tip increases while decreases. This occurs because of the increasing effect of viscous forces as velocity increases, as discussed in §4.2.
To assess the accuracy of (ΔP̄tip)ext as an estimate of ΔP̄tip as discussed above, we compare ΔP̄tip to (ΔP̄tip)ext in Figure 6. This comparison demonstrates that (ΔP̄tip)ext may be used to predict ΔP̄tip at CaΩ well within the unsteady regime. In fact, our calculations show that the deviation is very low when Ω < 1 for A = 1 or Ω < 0.1 for A = 5 with CaM = 0.01. This large range of correlation holds true for all CaM considered in this study, indicating that one may confidently use (ΔP̄tip)ext to estimate ΔP̄tip when CaΩ < 10CaM.
Figure 6.
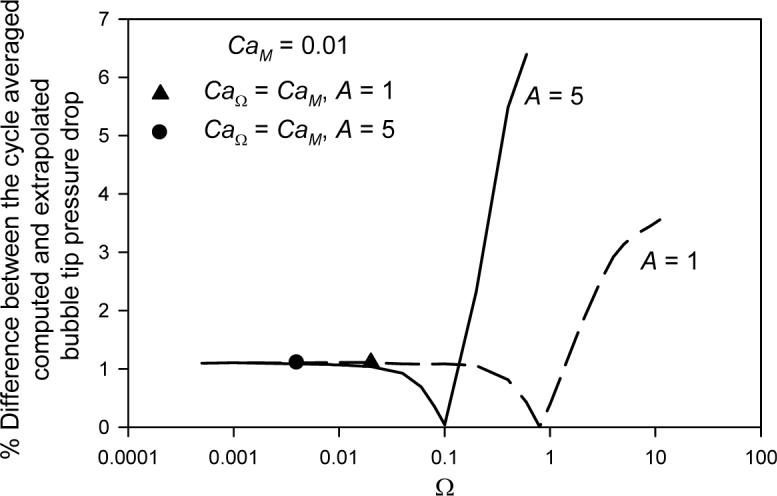
Percent difference between the cycle-averaged pressure drop ΔP̄tip and extrapolated ΔP̄tip for CaM = 0.01. Data to the right of symbols indicate the unsteady regime and the presence of reverse flow.
Figure 7 provides the a) cycle-averaged percent change in bubble tip velocity ΔŪtip and the b) cycle-averaged bubble half width . was calculated by conservation of mass within the system. Flow through the upstream (zLFT) and downstream (zRT) boundaries
| [4.1] |
must be equal as both the air and liquid phases are considered to be incompressible. Therefore,
| [4.2] |
Figure 7a shows that ΔŪtip increases significantly with increasing CaΩ. At A = 1, ΔŪtip stabilizes at high frequencies to a value independent of Ω, but decreases with CaM. Similar trends exist for A = 5; however, direct observations of the plateau region were not feasible. Figure 7b shows a commensurate decrease in with increasing CaΩ. Obviously, pulsatile flow results in a net film thickening, which is observable in Figure 3. As expected, this film thickening response occurs largely in the unsteady regime and is related to the increasing film thickness that is observed under high-Ca steady propagation (Halpern & Gaver III 1994). The effects of bubble thickening are far more pronounced with increasing A because high amplitude cycling modifies the bubble geometry over a region that extends far upstream of the bubble tip. In contrast, low A only perturbs the geometry in the immediate vicinity of the tip and thus does not greatly modify the residual film deposited on the wall.
5. Discussion
Above we have discussed the behavior of the flow field and bubble tip properties (Utip, ΔPtip, κ) that are important to understanding the fluid mechanical interactions fundamental to this analysis. These fundamental characteristics are clearly modified by the presence of pulsatile flow, especially when reverse-flow conditions exist. In this section we focus on the implications of these flow characteristics on the mechanical stresses that exist on the tube wall. As we will demonstrate, these stress fields are highly dependent on the flow parameters, which exhibit both spatial and temporal dependence. These responses are of fundamental interest and may also be of physiological significance, particularly in relation to pulmonary airway reopening. Specifically, we consider the normal stress gradient (§5.1) and shear stress (§5.2) along the tube wall. We then explore the limitations related to our assumptions of Stokes flow (§5.3).
5.1 Normal stress gradient
Magnitude
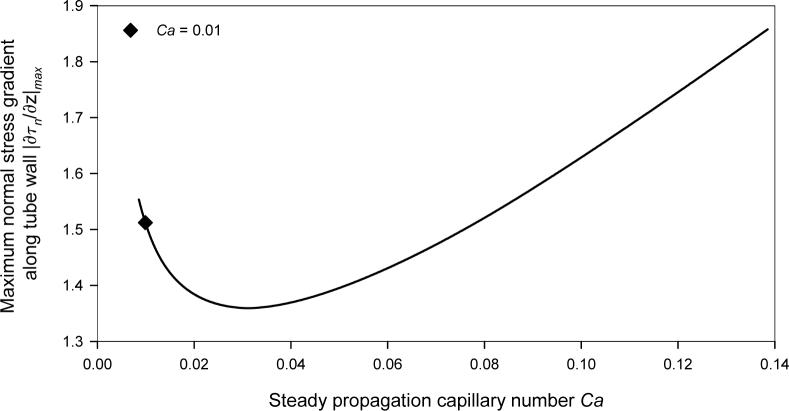
Our interest in the normal stress gradient stems from its importance to damage emanating from the reopening of fluid-occluded airways. Bilek et al (2003) demonstrated that an increased normal stress gradient ∂τn/∂z along a channel wall is directly correlated to increased cell mortality. Those studies focused on very small values of Ca (2.7 × 10⁻⁵ ≤ Ca ≤ 6.8 × 10⁻⁴), and showed that a decrease in Ca resulted in an increase in ∂τn/∂z (corresponding to increased cell damage). Figure 8 shows that ∂τn/∂z is a minimum along the tube wall under steady reopening conditions near Ca = 0.03. In the present study, we focus on low-Ca behavior (CaM = 0.01) because this region is of most interest in physiological systems.
Figure 8.
Maximum normal stress gradient magnitude |∂τn/∂z|max along tube wall, steady state bubble propagation
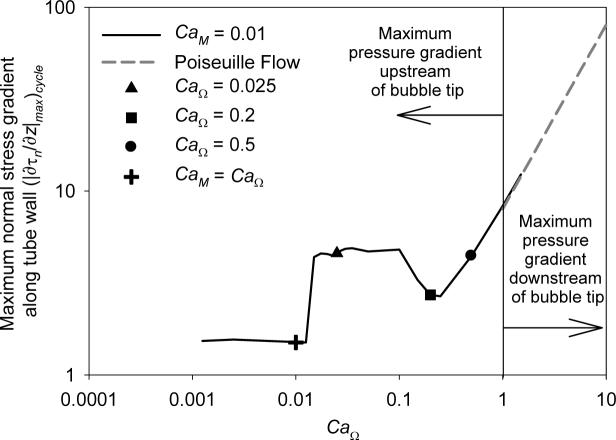
Figure 9 shows the maximum normal stress gradient along the wall at any point in the oscillatory cycle, (|∂τn/∂z|max)cycle as a function of CaΩ for CaM = 0.01 and A = 5. This figure shows that the system exhibits a quasi-steady regime (CaΩ < CaM, to the left of +) wherein (|∂τn/∂z|max)cycle is approximated by the steady-state results shown in Figure 8. The unsteady regime can be sub-divided into three regions:
Figure 9.
Maximum magnitude of the normal stress gradient along the tube wall at any point in the cycle (|∂τn/∂z|max)cycle where A = 5 and CaM = 0.01. + indicates the onset of reverse flow (CaΩ = CaM), data to the right of this point exhibits reverse flow. Dashed line indicates the region where the maximum normal stress gradient may be predicted by (|∂τn/∂z|max)cycle = 8(CaM + CaΩ).
Unsteady regime I
At low CaΩ (CaM < CaΩ ≤ 0.1), (|∂τn/∂z|max)cycle is increased dramatically due to interfacial flows near the bubble tip. The plateau region that occurs over CaM < CaΩ < 0.1 diminishes with increasing CaM (data not shown);
Unsteady regime II
At moderate CaΩ (0.1 < CaΩ < 0.5), the system evolves from the low CaΩ plateau region to the high CaΩ response due to local film thickening, and
Unsteady regime III
At high CaΩ (CaΩ ≥ 0.5): (|∂τn/∂z|max)cycle is equivalent to the pressure gradient due to the Poiseuille flow downstream of the bubble tip, following the form (|∂τn/∂z|max)cycle = 8(CaM + CaΩ).
Below we elucidate the relationships between the normal stress gradient and interfacial geometry in the unsteady regime as they relate to the driving parameters A and Ω.
In order to identify the interfacial characteristics that result in (|∂τn/∂z|max)cycle, we explore the behavior of |∂τn/∂z|max as a function of CaQ(t) for CaΩ = 0.025, 0.2 and 0.5, which represent unsteady regimes I-III, respectively. The time-dependent responses are provided in Figure 10, where the symbols (▲, ■, • as in Figure 9) identify the specific portion of the cycle (CaQ(t)) associated with (|∂τn/∂z|max)cycle. Finally, in Figure 11, we plot a) ∂τn/∂z vs. z and b) interfacial geometry at the CaQ(t) corresponding to (|∂τn/∂z|max)cycle, where the symbols (▲, ■, •) precisely identify the location of (|∂τn/∂z|max)cycle.
Figure 10.
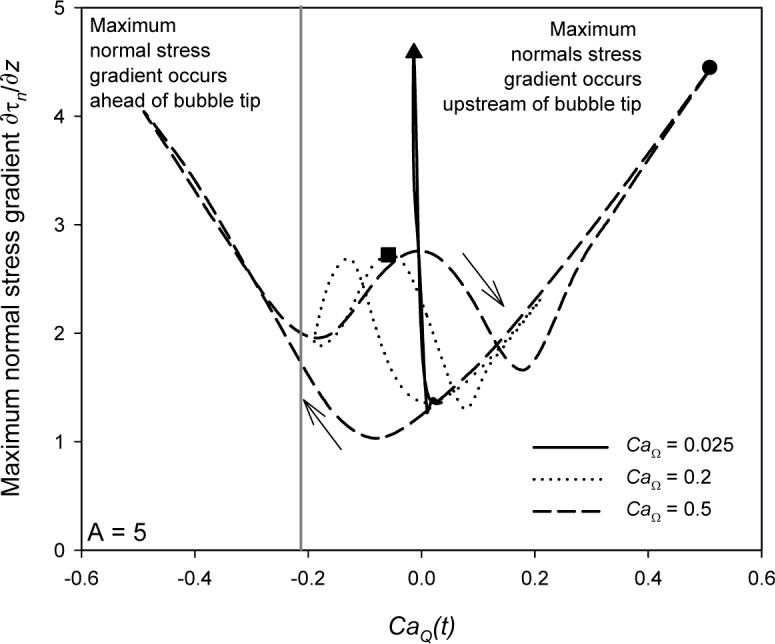
Normal stress gradient hysteresis loops for CaM = 0.01, A = 5. Symbols ▲, ■, and • indicate the location of (|∂τn/∂z|max)cycle for CaΩ = 0.025, 0.2, and 0.5 respectively.
Figure 11.
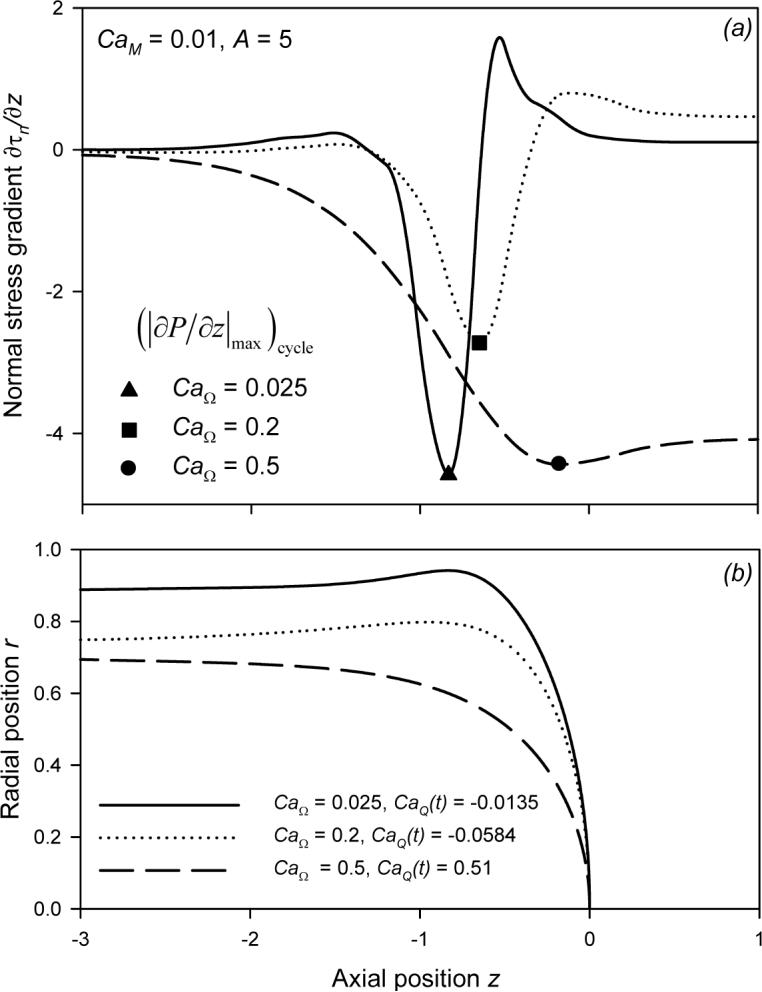
Normal stress gradient ∂τn/∂z (a) and interfacial geometry (b) occurring at (|∂τn/∂z|max)cycle for CaM = 0.01, A = 5. Symbols identify the location of (|∂τn/∂z|max)cycle and correspond to those in Figures 9 and 10.
Unsteady regime I
The time-dependent response in Figure 10 at CaΩ = 0.025 (solid line) corresponds to the sharp increase in the (|∂τn/∂z|max)cycle shown in Figure 9 (▲). This response demonstrates that |∂τn/∂z|max varies substantially over the cycle, with the maximum value (|∂τn/∂z|max)cycle (▲) occurring as a spike on the retracting stroke near CaQ(t) = CaM - CaΩ. This magnitude far exceeds the |∂τn/∂z| that exists over the remainder of the cycle. The bubble tip geometry at this instant (Figure 11b, solid line) shows the extraordinary film thinning that occurs during this part of the reverse stroke. ∂τn/∂z (Figure 11a, solid line) demonstrates the extremely large normal-stress gradient that is exacerbated by this local film thinning. Therefore, the very large increase in (|∂τn/∂z|max)cycle occurs as a result of very slow bubble retraction that induces a high resistance region in the transition region between the bubble cap and thin film. The large magnitude of ∂τn/∂z is consistent with the predictions of the stresses that exist in the leading edge of plug propagation (Fujioka & Grotberg 2004).
Unsteady regime II
A local minimum in (|∂τn/∂z|max)cycle occurs near CaΩ = 0.2. The time-dependent response (Figure 10) demonstrates that this increase in frequency modifies |∂τn/∂z|max substantially. Local maxima occur at several points in the cycle, but the absolute maximum (|∂τn/∂z|max)cycle occurs near CaQ = −0.06 (■). It is evident from the interfacial geometry (Figure 11b, dotted line) that this marked reduction in |∂τn/∂z|max occurs because oscillation has caused the film to thicken, which is consistent with Figure 7b.
Unsteady regime III
With CaΩ = 0.5, Figure 10 shows that |∂τn/∂z|max has local maxima occurring at velocity extrema and at CaQ = 0. (|∂τn/∂z|max)cycle (•) occurs at the maximum forward velocity. At this rate, the film has thickened substantially (Figure 11b), but the normal stress gradient remains very large due to the elevated velocity that occurs from the high CaΩ. This corresponds to the large-CaQ behavior in Figure 9 (•). In this regime (|∂τn/∂z|max)cycle is equivalent to the Poiseuille viscous pressure gradient in the tube downstream of the bubble tip, following the form (|∂τn/∂z|max)cycle = 8(CaM + CaΩ). This relationship is provided by in Figure 9.
Spatial and Temporal Behavior
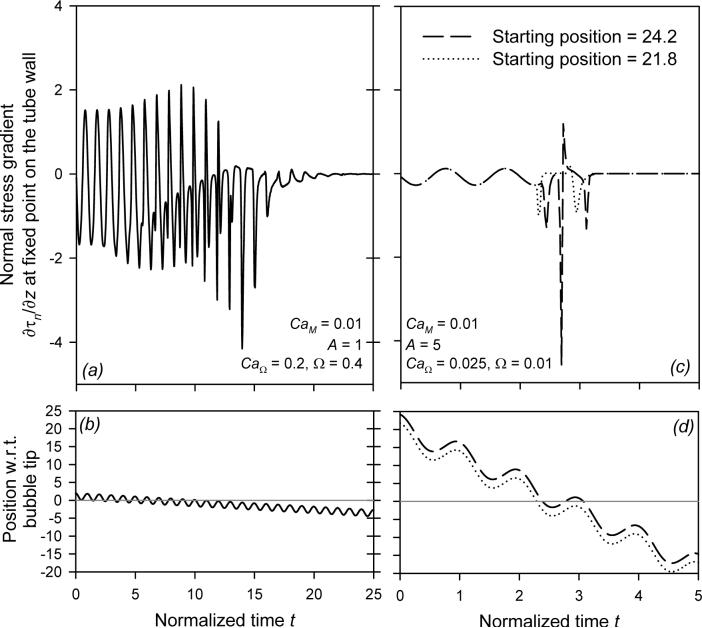
Bilek et al (2003) and Kay et al (2004) have demonstrated that the normal stress gradient is the mechanical stimulus that leads to cellular membrane disruption caused by a finger of air passing over epithelial cells in a fluid-filled channel. In this sub-section, we investigate the implications of the temporal and spatial variation of ∂τn/∂z, which leads to the complex signature described in Figure 12a,c.
Figure 12.
Normal stress gradient ∂τn/∂z at a point fixed on the tube wall (a,c) and position with respect to the bubble tip (b,d). Time is normalized so that oscillations have a period of 1.
In Figure 12a we provide the time-dependent ∂τn/∂z at a point fixed on the tube wall for CaΩ = 0.2 and A = 1. Initially this point is downstream of the bubble tip and experiences the gradient induced by the Poiseuille velocity profile. As the bubble tip approaches the fixed point (position decreasing to zero in Figure 12b), ∂τn/∂z is modified from pure oscillation as the interfacial ∂τn/∂z sweeps across the cell (see Figure 11a for an example of ∂τn/∂z at one instant). In this low amplitude, high frequency scenario the bubble tip repeatedly passes over the fixed point, greatly increasing the potential for trauma. After the bubble tip has passed over the fixed point the high-resistance transition region induces a large magnitude time-dependent stress. For example, near t = 14 the magnitude of ∂τn/∂z is at a maximum, and is qualitatively associated with the local film thinning and high resistance region that exists during the reverse flow. With increased t, the fixed point resides solely beneath a nearly uniform thin film. Only a constant τn exists from the radial component of the bubble curvature, ∂τn/∂z| ∼ 0.
To explore the spatial dependency of the stress-field, we consider the magnitude of ∂τn/∂z affecting two points separated by a small distance (z = 24.2 and 21.8) at A = 5 and CaΩ = 0.025 (Figure 12c). This small variation in location results in significantly different transient ∂τn/∂z during the time at which the bubble tip is passing over the points. This response occurs because each point on the wall is associated with different profiles of the time-dependent stress-field as a result of the Lagrangian translation of the bubble tip. As a result, adjoining points on the wall experience significantly different ∂τn/∂z signatures. The wavelength of the spatial-dependency is approximately A, but would be slightly larger due to the residual film which extends the stroke of the bubble tip according to Figure 7.
When comparing Figure 12a to Figure 12c, it is evident that both CaΩ and A greatly influence the stresses observed at a fixed point on the wall. For CaΩ = 0.2 and A = 1 (Figure 12a) the bubble passes a point on the wall 19 times, while for CaΩ = 0.025 and A = 5 (Figure 12c) the bubble passes by only three times. High frequency causes a region of the wall to experience more frequent exposure to the bubble tip, while increasing A leads to an extended range of bubble motion. As a result, high amplitudes and high frequency may induce repeated trauma.
5.2 Shear stress
Bilek et al (2003) and Kay et al (2004) demonstrate that normal stress gradient, not shear stress (τt) is primarily responsible for cellular damage in a simplified model of airway reopening. Nevertheless, other systems (i.e. epithelial cells in the vasculature) demonstrate effects that are triggered by τt. For this reason, we consider the relationship between τt and the flow parameters of our system. In the range investigated (10−1 > CaM > 10−2) a strong linear correlation exists between CaΩ + CaM (the maximum CaQ(t)) and the maximum shear stress (τt)max along the tube wall at any point in the oscillatory cycle:
| [4.3] |
We find that (τt)max occurs upstream of the bubble tip only at low reopening velocities (CaΩ + CaM < 0.3). Note that the linear relationship between (τt)max and the maximum CaQ(t) is likely to exist only at large CaQ(t); the results of Bilek et al (2003) demonstrate a weaker dependence with reducing Ca.
5.3 Limitations
In the model investigated herein we assume Stokes flow with time-dependent forcing and interfacial response dictated by the KBC (§3.5). In order to investigate the validity of the Stokes flow hypothesis, we rescale the Navier-Stokes equations with velocity- and time-scales relevant to system forcing. Scaling the Navier-Stokes equation with u* = ūtipu and t* = (1/ω)t yields
| [4.4] |
where CaU = μūtip/γ. The Womersley parameter α, describing the unsteady nature of the system, is equal to
| [4.5] |
where ν is the kinematic viscosity. The Reynolds number Re, the ratio of inertial to viscous forces, is defined as
| [4.6] |
Since the present investigation considers a balance between pressure and viscous interactions which ignores temporal and convective acceleration [2.3], Stokes flow is an appropriate approximation if the following conditions are satisfied:
| [4.7] |
Here the Weber number We = ReCa represents the ratio of inertial forces to surface tension.
The Womersley parameter (α) describes the balance between unsteady inertial and viscous effects. For α < 1 the downstream flow is quasi-steady and maintains a nearly parabolic profile. As α is increased the downstream flow profile will assume a more plug-like configuration and become increasingly out of phase with the driving pressure gradient. In this study we assume the flow profile downstream of the bubble is parabolic, valid when α < 1.
Heil (2001) systematically investigated the effect of Re on steady air finger propagation through a rigid channel. It was shown that variations in Re produced small variations in residual film thickness and significant changes in bubble tip pressure drop and flow field. Closed vortices were observed downstream of the bubble tip, not present in Stokes simulations. In the present investigation we neglect these inertial effects, and it is plausible that these may become significant at Re > 1. The present study provides the baseline from which inertial effects can be investigated.
While our computational methods have provided a robust means for exploring a range of parameters, at high Ω and low CaM numerical difficulties may interfere with the solution process. In particular, the boundary element method may suffer from poor accuracy when two boundaries are in very close proximity. This can occur at low CaM because the exceedingly thin film results in adjacent boundaries being separated by very small distances (r < 0.05). As a result, the time-dependent solver (DLSODES, §3.6) may fail to converge at the specified error tolerances and iteration limits. To investigate this range of parameters, one could increase the level of Gauss quadrature for integration of the boundary integral equations [2.15].
6. Conclusions
In this paper we investigate the pulsatile motion of a finger of air propagating within a rigid tube filled with a viscous Newtonian fluid. We present a two-dimensional axisymmetric model incorporating the boundary element method coupled to lubrication theory in the upstream thin-film region, driven by pulsatile flow at the downstream boundary.
We consider the time-dependent behavior of the flow field and bubble geometry throughout the course of the oscillatory cycle. The behavior of this system is well approximated by steady-state responses until the system enters the unsteady regime, CaΩ > CaM. We explore ΔPtip, κtip, Utip, and β throughout the cycle. We find that ΔPtip may be estimated accurately ((ΔPtip)ext) from the pressure measured downstream of the bubble tip after correction for the viscous losses between the measuring point and the bubble tip. This relationship holds true far into the unsteady regime (CaΩ < 10CaM) and validates the use of (ΔPtip)ext in experimental investigation. Furthermore, we find that an increase in CaΩ increases the residual film () that is associated with a significant increase in Ūtip. Even though increases during dynamic oscillation, extreme film thinning may occur at instances in the cycle. This, in turn, is correlated with a highly dynamic stress field that has very interesting temporal and spatial characteristics that may have implications to pulmonary airway damage associated with ventilator-induced lung injury. Further research will investigate the influence of coupling surfactant physicochemical hydrodynamics to this system, which may allow the predication of optimal ventilation strategies for the treatment of obstructive pulmonary disease.
Acknowledgements
The authors would like to thank Rene Salmon, Anne-Marie Jacob, and David Halpern for their assistance with this work. Computations were performed at the Center for Computational Science at Tulane University. This study was supported by NASA grant NAG3-2734, Louisiana Board of Regents graduate fellowships for B.J.S., NIH grants R01-HL81266 and P20-EB001432.
Appendix
Table 1.
Boundary conditions
| Region | ur | uz | τr | τz |
|---|---|---|---|---|
| Surface 1 | 0 | 2Ca(1 — r2) | - | - |
| Surface 1−2 Corner on Surface 1 | - | 0 | −4CaR | - |
| Surface 1−2 Corner on Surface 2 | 0 | - | - | −4CaR |
| Surface 2 | 0 | 0 | - | - |
| Surface 2−3 Corner on Surface 2 | 0 | - | - | |
| Surface 2−3 Corner on Surface 3 | - | 0 | - | |
| Surface 3 | - | - | ||
| Surface 3−4 Corner on Surface 3 | - | 0 | - | |
| Surface 3−4 Corner on Surface 4 | - | - | -κnr | -κnz |
| Surface 4 | - | - | -κnr | -κnz |
REFERENCES
- Becker AA. The Boundary Element Method in Engineering: A complete course. McGraw-Hill Book Company; NewYork: 1992. [Google Scholar]
- Bilek AM, Dee KC, Gaver DP., III Mechanisms of surface-tension-induced epithelial cell damage in a model of pulmonary airway reopening. J. Appl. Physiol. 2003;94:770–83. doi: 10.1152/japplphysiol.00764.2002. [DOI] [PubMed] [Google Scholar]
- Bretherton FP. The motion of long bubbles in tubes. J. Fluid Mech. 1961;10:166–88. [Google Scholar]
- Cox BG. On driving viscous fluid out of a tube. J. Fluid Mech. 1962;14:81. [Google Scholar]
- Fairbrother F, Stubbs AE. Studies in electroendosmosis. Part VI. The bubble-tube method of measurements. J. Chem. Soc. 1935;1:527–9. [Google Scholar]
- Fujioka H, Grotberg JB. Steady Propagation of a Liquid Plug in a 2D-Channel. J. Biomech. Eng. 2004;126:567–77. doi: 10.1115/1.1798051. [DOI] [PubMed] [Google Scholar]
- Gaver DP, III, Jacob A-M, Bilek AM, Dee KC. The Significance of Air-Liquid Interfacial Stresses on Low-Volume Ventilator-Induced Lung Injury. In: Dreyfuss D, Saumon G, Hubmayr RD, editors. Ventilator-Induced Lung Injury. Taylor and Francis Group; New York, NY: 2006. pp. 157–205. [Google Scholar]
- Giavedoni MD, Saitia FA. The axisymmetric and plane cases of a gas phase steadily displacing a Newtonian fluid - A simultaneous solution of governing equations. Phys. Fluids. 1997;9:2420–8. [Google Scholar]
- Grotberg JB. Respiratory fluid mechanics and transport processes. Annu. Rev. Biomed. Engng. 2001;3:421–57. doi: 10.1146/annurev.bioeng.3.1.421. [DOI] [PubMed] [Google Scholar]
- Halpern D, Gaver DP., III Boundary element analysis of the time-dependent motion of a semi-infinite bubble in a channel. J. Comput. Phys. 1994;115:366–75. [Google Scholar]
- Heil M. Finite Reynolds number effects in the Bretherton problem. Phys. Fluids. 2001;13:2517–21. [Google Scholar]
- Ingham DB, Ritchie JA, Taylor CM. The motion of a semi-infinite bubble between parallel plates. Z. Angew. Math. Phys. 1992;43:191–206. [Google Scholar]
- Kay SS, Bilek AM, Dee KC, Gaver DP., III Pressure gradient, not exposure duration, determines the extent of epithelial cell damage in a model of pulmonary airway reopening. J. Appl. Physiol. 2004;97:269–76. doi: 10.1152/japplphysiol.01288.2003. [DOI] [PubMed] [Google Scholar]
- Ladyzhenskaya OA. The Mathmatical Theory of Viscous Incompressible Flow. Gordon and Breach; New York: 1963. [Google Scholar]
- Lu W-Q, Chang H-C. An extension of the biharmonic boundary integral method to free surface flow in channels. J. Comput. Phys. 1988;77:340–60. [Google Scholar]
- Park CM, Homsy GW. Two-phase displacement in Hele-Shaw cells: theory. J. Fluid Mech. 1984;139:291–308. [Google Scholar]
- Ratulowski J, Chang H-C. Transport of gas bubbles in capillaries. Phys. Fluids A. 1989;1:1642–55. [Google Scholar]
- Reinelt DA, Saffman PG. The penetration of a finger into a viscous fluid in a channel and tube. SIAM J. Sci. Stat. Comput. 1985;6:542. [Google Scholar]
- Shen EI, Udell KS. A Finite Element study of low Reynolds number two-phase flow in cylindrical tubes. ASME J. Appl. Mech. 1985;52:253–6. [Google Scholar]
- Stebe KJ, Barthes-Biesel D. Marangoni effects of adsorption -desorption controlled surfactants on the leading edge of an infinitely long bubble in a capillary. J. Fluid Mech. 1995;286:25–48. [Google Scholar]
- Stebe KJ, Maldarelli C. Remobilizing surfactant retarded fluid particle interfaces II. Controlling the surface mobility at interfaces of solutions containing surface active components. J. Colloids Interfaces Sci. 1994;163:177–89. [Google Scholar]
- Wassmuth F, Laidlaw WG, Coombe DA. Calculation of interfacial flows and surfactant redistribution as a gas/liquid interface moves between two parallel plates. Phys. Fluids A. 1993;5:1533–48. [Google Scholar]
- Zimmer ME, Williams HAR, Gaver DP., III The pulsatile motion of a semi-infinite bubble in a channel: flow fields, and transport of an inactive surface-associated contaminant. J. Fluid Mech. 2005;537:1–33. [Google Scholar]


