Abstract
This paper explains the circuitry and signal processing to perform electrical impedance spectroscopy on piezoelectric materials and ultrasound transducers. Here, we measure and compare the impedance spectra of 2−5 MHz piezoelectrics, but the methodology applies for 700 kHz–20 MHz ultrasonic devices as well. Using a 12 ns wide 5 volt pulsing circuit as an impulse, we determine the electrical impedance curves experimentally using Ohm's law and fast Fourier transform (FFT), and compare results with mathematical models. The method allows for rapid impedance measurement for a range of frequencies using a narrow input pulse, digital oscilloscope and FFT techniques. The technique compares well to current methodologies such as network and impedance analyzers while providing additional versatility in the electrical impedance measurement. The technique is theoretically simple, easy to implement and completed with ordinary laboratory instrumentation for minimal cost.
Keywords: impulse circuit, electrical impedance, piezoelectric, ultrasound measurement, spectroscopy, pulse
1. Background
Electrical impedance spectroscopy (EIS) of piezoelectric devices and materials, henceforth referred to as PEDs, derives from the measurement of the current into and the voltage across the PED as a function of the applied sinusoidal voltage frequency. According to Ohm's law the impedance can be calculated by complex division of the voltage and current. The impedance of the PED can be calculated by applying a sinusoidal voltage to the PED in series with a resistor, and measuring the voltage across the resistor and across the PED. Performing this measurement by sweeping the frequencies of the applied signal provides the impedance phase and magnitude. The power—voltage multiplied by current—delivered to the PED can also be determined from the voltage and current measurements. The impedance plot, and more importantly the current and voltage measurements as a function of frequency, provides useful information to builders and users of the piezoelectric device.
EIS provides many piezoelectric properties that are necessary in developing ultrasound transducers for imaging, ablation, level measurement and other ultrasonic applications [1, 2]. The electrical impedance of piezo-material over a range of frequencies is important in understanding the behavior of the piezoelectric around resonance and parallel resonance. It is also useful to compare different piezoelectric materials such as films, composites and single crystals for their possible uses and electro-acoustic behavior [3].
By analyzing the electrical impedance curve as a function of frequency, one can determine properties of the piezo-material such as impedance Z, admittance Y, maximum impedance frequency fp, maximum admittance frequency fs, mechanical Qm and the components of the RLC circuit that mimic the material [4–7]. Therefore, a quick and affordable way to measure the impedance of a piezo-material and ultrasonic devices can be of significant benefit.
Numerous methods have been introduced to measure electrical impedances for transducer sensitivity calibrations [7], maximization of acoustic energy conversion/transfer [8, 9] and to determine other properties of piezoelectric ceramics [1, 2]. A good review of standard methods used at different frequencies and in a variety of devices is ‘Agilent Technologies Impedance Measurement Handbook’ [10], available at the Agilent Technologies website. In practice, EIS of piezoelectrics is easily done using network analyzers and impedance meters. However, these devices generally cost ten to forty thousand dollars, which is prohibitive for many potential users. In this paper, we demonstrate a practical and affordable pulsing circuit along with the methodology to easily perform EIS for assumed lossless PEDs [6, 11], using a well-established signal processing approach.
The approach in this paper uses an impulse response to determine the transfer function of a simple circuit or system. A pulse applied to a PED in series with a known impedance source in time results in a measurable response. When the measured response is converted into the frequency domain, Ohm's law can be used to determine the impedance of the PED as a function of frequency.
2. Methods
2.1. Pulsing circuit
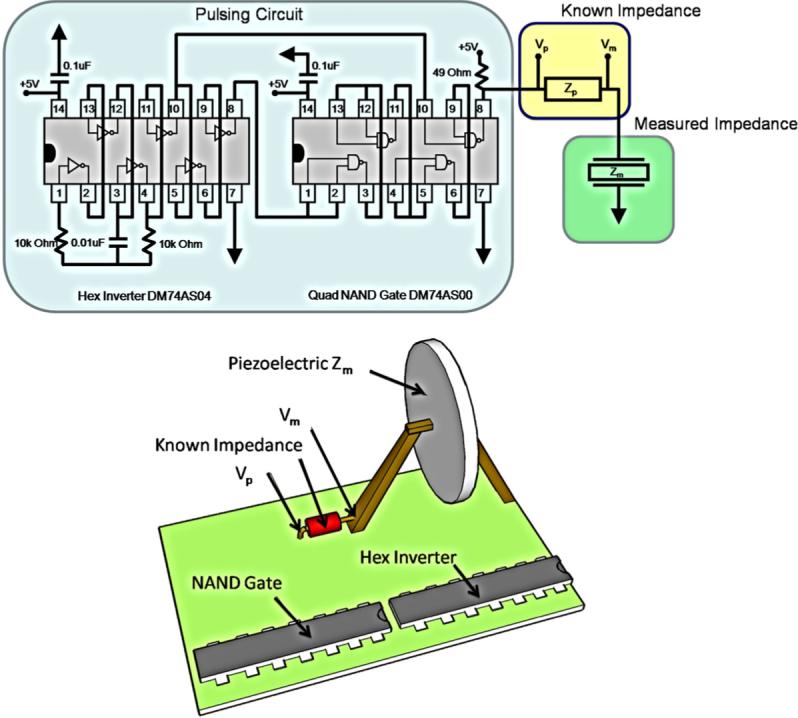
The pulsing circuit shown in figure 1 is constructed from two common high speed integrated circuits (ICs) (Mouser Corporation), mounted on a prototyping board. The first IC was a Hex Inverter (DM74AS04 Fairchild Semiconductor), wired to form a simple 4 kHz square wave oscillator (pins 1−4 and 12−13). The output from the oscillator pin 4 was then sent through even multiples of gates as shown in the figure to obtain two equivalent wave forms. The two outputs from the Hex Inverter (pins 10 and 8) were sent to the second IC, a high speed Quad NAND Gate (DM74AS00 Fairchild Semiconductor). The NAND Gate's intrinsic 4 ns propagation delay was used to slow the output (pin 8 Hex Inverter) by approximately 12 ns. The delayed signal was then logically combined with the non-delayed signal (pins 9 and 10, NAND Gate). The output at pin 8 of the NAND Gate was a 10 ns wide 5 volt pulse. Bypass capacitors (pins 14, both ICs) and a pull-up resistor (pin 8, NAND Gate) were used to sharpen the pulse and remove ringing as shown in figure 1.
Figure 1.

Schematic and CAD of the 12 ns 5 volt pulsing circuit used in the impedance measurement study.
2.2. Experimental measurements and analysis
The pulsing circuit in figure 1 was connected in series to a known impedance source Zp, a simple 49 Ω resistor with 1% tolerance, and the unknown PED electrical impedance Zm, as shown in figure 1. The transient voltage responses Vp and Vm were measured across Zp with × 10 scope probes triggered off of pin 10 of the NAND Gate. The measured PEDs were connected to the pulsing circuit and known impedance source using a two-point copper prong holder (bottom of figure 1). To measure Zm, the digital wave forms of Vp and Vm were collected using a Tektronics Model TDS2002B oscilloscope at a sample rate (SR) of 4 ns per point. The measurements of Vp and Vm were collected using the screen capture setting on the oscilloscope out to 20 μs in time.
For each piezoelectric measured, Vp and Vm were padded with zeros to make the signal 3 × 10⁶ points long in time, and the fast Fourier transform (FFT) was taken in MatLab (Math Works Corporation, Natick, MA). The FFT of transient voltage measurements Vp and Vm provided the frequency domain content of the signals FVp and FVm, respectively. The electrical impedance of the unknown PED as a function of the frequency FZm was determined according to
| (1) |
The resulting complex impedance vector FZm was plotted for its magnitude and phase (y-axis), in conjunction with its frequency vector (x-axis). The per-point frequency step for the x-axis f was given by
| (2) |
where SR is the sample rate and F is the number of points for which the FFT was taken.
2.3. Impedance measurement using a network analyzer
The impedance phase and magnitude plots were collected with an HP 4194 impedance analyzer and saved into a digital text file for comparison with results from section 2.2. The PEDs were placed in a two-point holder with leads that connected the PEDs to the system. The holder was identical to the impulse measurements holder of section 2.2, see figure 1.
2.4. Impedance data fitting
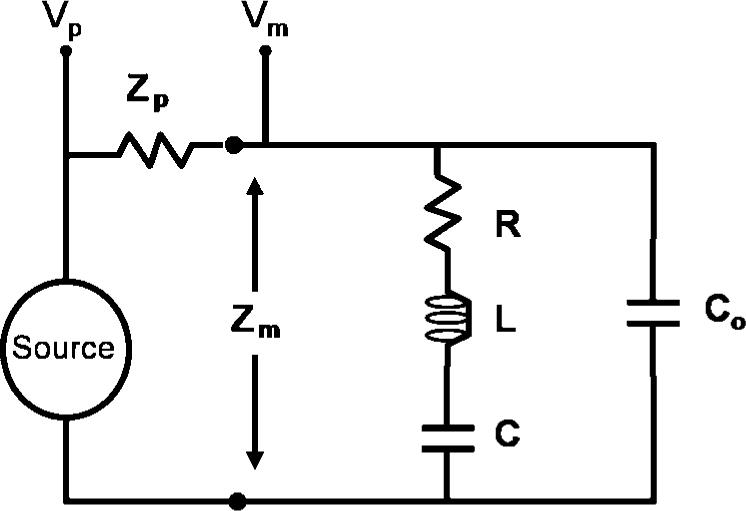
The impedance phase and magnitude plots from the data were fitted to the simple model for a piezoelectric using IEEE Standards 1988. The basic model consists of an RLC circuit in parallel with another capacitor, as shown in figure 2. The impedance and admittance functions for a piezoelectric model can also be represented more precisely by a transmission line equivalent circuit [12, 13].
Figure 2.

Circuit representing a simple model of piezoelectric and PSpice models.
For the circuit shown in figure 2, the relationships among parameters may be determined by using Ohm's law and circuit theory. The series resonant frequency for the circuit ωs is given by
| (3) |
The conductance at resonance G(ωs) provides the resistance value R for the model according to
| (4) |
Manipulating the real and imaginary components of the admittance yields
| (5) |
| (6) |
| (7) |
where B(ωs) is the maximum value of the susceptance, Ce is the parallel equivalent capacitance of the model and ωp is the parallel resonant frequency.
Four parameters, R, L, C and Co, for the model were estimated using equations (4)–(7) respectively and the measured impedance data from the impulse method Fzm and the network analyzer system. Then a least-squares approach was used to fit the model parameters more accurately.
2.5. PSpice model of the impulse impedance measurement method and ac sweep
Experimental impedance data Fzm from section 2.2 and the model fitting of section 2.4 provided the R, L, C and Co parameter values for the simple circuit in figure 2. The corresponding values were then used in a PSpice model (Candence Corporation, San Jose, CA) to simulate the impulse method of section 2.2 and to perform a standard ac sweep analysis of the circuit. The PSpice model simulated the piezoelectric equivalent circuit shown in figure 2.
For the impulse model, the source was defined as a 4 volt 12 ns wide pulse with 4 ns rise and fall times. Transient analysis was used to simulate the circuit in 0.1 ns time steps to 20 μs. Vp and Vm were measured in the program and imported into MatLab for analysis.
The circuit in figure 2 was used in the PSpice ac sweep analysis. The source was a 4 volt sinusoid that was swept from dc-10 MHz in 1 kHz increments. The current through Zp and voltage Vm were measured in the program, and the impedance magnitude and phase were compared with the experimentally measured data.
3. Results
3.1. Pulsing circuit analysis and performance
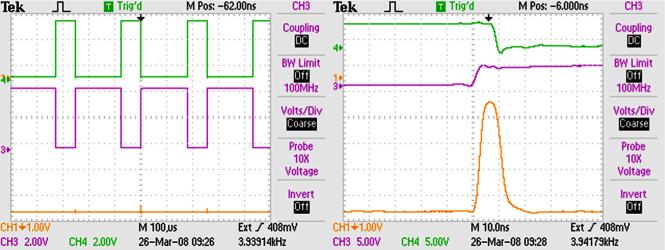
Figure 3 shows oscilloscope measurements from the pulsing circuit. The green and purple square waves shown in the left side of the figure were logically combined at pins 10 and 9 of the NAND gate to produce the test signal in yellow at the bottom of the figure. The signals are shown in more detail on the right side of the figure where each division corresponds to 10 ns. The high speed NAND Gate produces a stable 12 ns wide 4 volt pulse when both green and purple logic signals are ‘on’, as shown in the right side of figure 3. The yellow pulse is the measured output from pin 8 of the NAND Gate. The yellow pulse signal has 5 ns rise time and 7 ns fall time with minimal ringing around the edges of the signal.
Figure 3.
Oscilloscope screen capture of a 4 kHz oscillator. The green, purple and yellow curves correspond to the outputs of pin 10, pin 9 and pin 8 of the NAND gates, respectively. Left: 100 μs per division. Right: 10 ns per division.
3.2. Experimental analysis of impedance measurement approaches
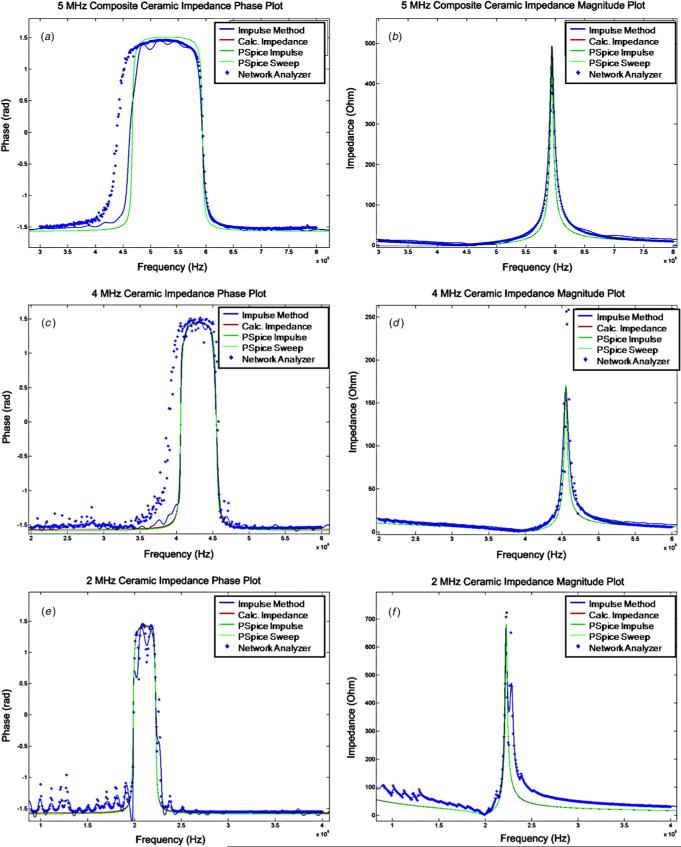
The following flat disk PEDs were tested: a 0.5 inch diameter 5 MHz piezoelectric EBL 2 composite, a 0.75 inch diameter 4 MHz piezoelectric EBL 1 and a 0.59 inch diameter 2 MHz piezoelectric EBL 2 (EBL Products, Hartford, CT). The electrical impedance was measured five times using the impulse approach with a 49 Ω 1% resistor as Zp and five times using the network analyzer. Figure 4 is a composite of data from the impulse method, the network analyzer and PSpice models. We found good agreement between experimentally measured data for the impulse method (blue line) and the network analyzer (blue asterisk) for the three samples. There were no significant variations among measurements using the two techniques. The impedance calculated from the data and the impedance from the two PSpice models gave similar results for each sample, as shown in figure 4. The component values of the piezoelectric equivalent circuit were determined from the PSpice model of the experimental impedance data and compiled in table 1. Results for each PED are discussed separately.
Figure 4.
Impedance phase (on left) and magnitude (on right) plots for five methods and three different piezoelectric materials. (a) and (b) 5 MHz 0.5 inch diameter composite piezoelectric impedance plots agree well overall. The phase shift of the network analyzer around resonance begins at a lower frequency compared to other methods. (c) and (d) 4 MHz 0.75 inch diameter piezoelectric impedance plots agree except for the lower frequency phase shift of the network analyzer around resonance compared with the other methods. The network analyzer shows a higher parallel resonant magnitude compared with the other methods. (e) and (f) 2 MHz 0.59 inch diameter piezoelectric impedance plots agree well. The phase and magnitude measurements of the network analyzer and impulse method have low amplitude spectral ripples through EIS plots.
Table 1.
Tabulated model data for piezoelectric materials studied R, L, C and Co. Also including the resonant and parallel resonant frequencies and impedance magnitudes measured using the impulse and network analyzer methods. The table shows good agreement between the two approaches.
| R | L | C | Co | fs | fp | Magnitude at fs | Magnitude at fp | |
|---|---|---|---|---|---|---|---|---|
| Piezoelectric material | (Ω) | (μH) | (pF) | (pF) | (MHz) | (MHz) | (Ω) | (Ω) |
| 5 MHz impulse | 0.150 | 0.602 | 1.93 | 3.12 | 4.67 | 5.94 | 0.15 | 480 |
| 5 MHz network analyzer | 0.598 | 0.938 | 1.36 | 1.73 | 4.45 | 5.95 | 0.7 | 380 |
| 4 MHz impulse | 0.203 | 1.00 | 1.54 | 5.97 | 4.06 | 4.55 | 0.2 | 168 |
| 4 MHz network analyzer | 0.170 | 1.00 | 1.65 | 4.70 | 3.92 | 4.56 | 0.53 | 325 |
| 2 MHz impulse | 1.06 | 9.36 | 0.684 | 2.67 | 1.98 | 2.23 | 1 | 675 |
| 2 MHz network analyzer | 1.06 | 9.35 | 0.684 | 2.51 | 1.99 | 2.23 | 2 | 720 |
3.2.1. 5 MHz piezoelectric composite PZT disk (figures 4(a) and (b))
Figure 4(a) shows the impedance phase measurement obtained from the impulse method, from calculations based on equations (3)–(7), from the PSpice model of the impulse measurement, from the PSpice model of an ac sweep and from the network analyzer. The phase shift before resonance occurs at 4.5 MHz for the various methods, except for the network analyzer where it occurs at 4 MHz. Figure 4(b) shows that the impedance magnitudes determined for the five methods were similar.
3.2.2. 4 MHz piezoelectric PZT disk (figures 4(c) and (d))
Figure 4(c) shows that the phase shift before resonance is similar for the different methods (4 MHz), except that it occurs at a lower frequency (3.7 MHz) for the network analyzer. Figure 4(d) shows that the impedance magnitudes determined were similar for all five methods, except that the magnitude of the impedance at parallel resonance was greater for the network analyzer (250 Ω) compared to the other methods (180 Ω).
3.2.3. 2 MHz piezoelectric PZT disk (figures 4(e) and (f))
The phase and impedance plots (figures 4(e) and (f)) were quantitatively similar to those obtained for the other two materials, but the data showed small amplitude variations at low frequencies, and through resonance and parallel resonance. The phase shift and resonant frequency were identical for the impulse method and network analyzer (1.98 MHz). This was true for the parallel resonant frequency of 2.2 MHz as well.
Table 1 shows component values for the impedance data determined from the impulse method and the network analyzer. The resonant and parallel resonant frequencies fs and fp and magnitudes were similar.
4. Discussion
The pulsing circuit comprising the two ICs, four resistors, three capacitors and prototyping board costs ten dollars to build. The simplicity in the design makes it easy to construct in 1 h. The pulse width can be lengthened or shortened by increasing or decreasing the number of gates through which the signal propagates. The 12 ns pulse from the circuit shown in figure 1 provided sufficient bandwidth to measure the impedance of 2−5 MHz PEDs. A shorter pulse would be required to measure higher frequency PEDs. A longer pulse might be sufficient to measure lower frequency PEDs. In practice, we have used the pulsing circuit as presented to perform EIS of ultrasonic probes and piezo-materials with impedance in the range 700 kHz–20 MHz.
By applying a voltage pulse to a component with known impedance in series with a PED, and analyzing the transient voltage response across the known component in the frequency domain, we were able to use Ohm's law to accurately measure the impedance magnitude and phase of 2, 4 and 5 MHz piezoelectric disks. The impulse impedance measurement approach agreed well with measurements from a network analyzer system that is often used for these purposes. The resonance and parallel resonance frequencies measured by the approaches were found to be within 5% of each other. The magnitudes of the impedance were also similar, particularly at resonance where the impedance is most important for device design.
Modeling of the impulse measurement method of impedance in PSpice and ac sweep models agreed closely with the calculated impedance from the piezoelectric equivalent circuit. It was easier to determine the equivalent circuit parameters for the impedance plots using the impulse method, because it provided a high resolution data set (only limited by the length of the recorded signal in time). The network analyzer provided an ac sweep type of measurement approach for a set of 401 points per window. Depending on the characteristics of the PED, the network analyzer may or may not provide enough information to fully characterize the PED.
The network analyzer system was relatively easy to use and provided impedance phase and magnitude curves rapidly. The impulse method required extra time to collect the transient response of the PED and then analyze the signal using the FFT algorithm. The known impedance Zp in figure 1 may be easily interchanged with a capacitor or PED-equivalent circuit. Using an iterative approach, a simple known component such as a resistor, as used in this study, may be refined into a more closely matched impedance to the PED to obtain a more accurate measurement. The approach also has the advantage with the simple circuit: to do signal averaging and to increase the dynamic range of measurement by using a digital scope/acquisition card with higher bit count. Furthermore, the nature of the impulse method may make it particularly suitable in certain applications. For example, to measure the impedance of a transducer in a water tank, the tank must be lined with acoustic absorbing material. Otherwise, reflections from within the tank affect the measured impedance. With the impulse method, data are collected before artifacts from reverberant echoes appear.
5. Conclusion
In this paper, a simple pulsing circuit that was used to perform electrical impedance spectroscopy (EIS) with ordinary laboratory instrumentation is described. The technique is straightforward and useful to laboratories that do not possess a network analyzer or an equivalent device. Results showed that 2, 4 and 5 MHz piezoelectric disk impedance spectra were accurately measured using the impulse impedance approach. The impulse method has been used in our laboratory to measure electrical impedance spectra of ultrasonic transducers and materials from 700 kHz to 20 MHz.
Acknowledgments
The authors would like to thank reviewers and colleagues for feedback and guidance. We would also like to thank EBL Products Inc. for providing test samples and Cornell University's Sonic MEMS group for use of the network analyzer. This research was supported by the National Institutes of Health and The National Science Foundation Graduate Fellowship Program.
References
- 1.Schmerr L, Lopez-Sancheza A, Huang R. Complete ultrasonic transducer characterization and its use for models and measurements. Ultrasonics. 2006;44(Suppl 1):e753–75. doi: 10.1016/j.ultras.2006.05.088. [DOI] [PubMed] [Google Scholar]
- 2.Kaltenbacher M, Simkovics R, Kaltenbacher B, Lerch R. Determination of piezoelectric material parameters using a combined measurement and simulation technique. Proc. IEEE Ultrasonics Symp. 2001:0-7803-7177. [Google Scholar]
- 3.Loyaua V, Feuillard G. Relationship between electrical impedance of a transducer and its electroacoustic behavior: measurement without primary source. J. Appl. Phys. 2006;100:034909. [Google Scholar]
- 4.Maeda M, Hashimoto H, Suzuki I. Measurements of complex materials constants of piezoelectrics: extensional vibrational mode of a rectangular bar. J. Phys. D: Appl. Phys. 2003;36:176–80. [Google Scholar]
- 5.Kwok K, Chan H, Choy C. Evaluation of the material parameters of piezoelectric materials by various methods. IEEE Trans. Ultrason. Ferroelectr. Freq. Control. 1997;44:733–42. [Google Scholar]
- 6.IEEE Standards Boards . ANSI/IEEE standard on piezoelectricity 176−1987. Standards Committee of the IEEE Ultrasonics, Ferroelectrics and Frequency Control Society; New York: 1988. [Google Scholar]
- 7.Lopez-Sanchez A, Schmerr L. Determination of an ultrasonic transducer's sensitivity and impedance in a pulse-echo setup. IEEE Trans. Ultrason. Ferroelectr. Freq. Control. 2006;53:2101–12. doi: 10.1109/tuffc.2006.150. [DOI] [PubMed] [Google Scholar]
- 8.Kim H, Priya S, Stephanou H, Uchino K. Consideration of impedance matching techniques for efficient piezoelectric energy harvesting. IEEE Trans. Ultrason. Ferroelectr. Freq. Control. 2007;54:1851–9. doi: 10.1109/tuffc.2007.469. [DOI] [PubMed] [Google Scholar]
- 9.Richards D, Anderson M, Bahr D, Richards R. Efficiency of energy conversion for devices containing a piezoelectric component. J. Micromech. Microeng. 2004;14:717–21. [Google Scholar]
- 10.Agilent Technologies Agilent Technologies Impedance Measurement Handbook. 2006 http://cp.literature.agilent.com/litweb/pdf/5950-3000.pdf.
- 11.San Emeterio JL, Ramos A, Sanz P, Cegarra M. Definition and measurement of the normalized electrical impedance of lossy piezoelectric resonators for ultrasonic transducers. Ultrasonics. 2000;38:140–4. doi: 10.1016/s0041-624x(99)00178-x. [DOI] [PubMed] [Google Scholar]
- 12.Mason W. Electromechanical Transducers and Wave Filters. Van Nostrand; New York: 1948. [Google Scholar]
- 13.Redwood M, Lamb J. On the measurement of attenuation and ultrasonic delay lines. Proc. IEEE B. 1956;103:773–80. [Google Scholar]


