

Abstract
When reinterpreted, data from Ahmed and Koob (1998) show that the reinforcing strength of cocaine, an inessential good, increases with experience. However, no such effect obtains with a homeostatically regulated good such as food. The present study evaluated whether this difference could serve to distinguish abused drugs from biologically necessary goods. In Experiment 1, five rats from Christensen, Silberberg, Hursh, Huntsberry and Riley (2008) earned cocaine under a Fixed-Ratio 3 schedule for 7 sessions. Thereafter, in a demand procedure identical to that in Christensen et al., demand was re-assessed by measuring consumption at Fixed Ratios between 3 and 560. In Experiment 2, five different rats from Christensen et al. had their food demand curves redetermined using an identical procedure as the first. When fit with the exponential model, the second determination of cocaine demand in Experiment 1 showed greater essential value than the first, indicating that strength increased with cocaine exposure. In Experiment 2, the re-determined food demand curves showed no change from their initial determination. These results show that the strength of cocaine, but not food, increases with increased experience. Measures of time-based changes in essential value may serve as a basis for distinguishing addictive from non-addictive reinforcers.
Keywords: addiction, exponential model of demand, behavioral economics, cocaine, food, demand, lever press, rats
Economic demand curves can be used to map the relation between an individual's consumption of a good and a good's price. When plotted in price (X axis)-log consumption (Y axis) space, these curves are downward sloping—that is, as the price of a good increases, the demand for it decreases.
Operant-based analogues of these demand curves can be constructed by allowing animals to earn as many units of a good as they desire as the size of a Fixed-Ratio (FR) schedule is varied across sessions. If goods that differ in size, potency or type are to be compared in a single plot, the unit of price (P) for each good is defined as the number of responses needed to produce one percent of that good at the lowest price on its demand curve (Hursh & Winger, 1995). For example, if, as is typically the case, consumption is highest under FR 1; and if the subject earns 200 reinforcers before sating, then each unit of price would equal two responses (i.e., 1% of 200 reinforcers requires 2 responses under an FR 1).
Once demand curves are plotted in this fashion, Hursh and Silberberg (2008) have advanced an exponential equation they believe accommodates these demand curves. It takes the form:
| (1) |
where Q, Q0, and e, respectively, signify units of consumption, units of consumption at the lowest price on the demand curve, and the base of the natural logarithm. The range of the exponential is adjusted so that it accommodates the number of log units (k) spanned by the demand curve with the largest range of consumption. Depending on the goods, k generally assumes a value ranging from 1 to 4 log units. The symbol α defines a free parameter that is adjusted to minimize the difference between the predictions of the equation and each demand curve. It varies inversely with a good's reinforcing strength or, in the terms of Hursh and Silberberg, a good's essential value. C represents the cost requirement (e.g., an FR 10 would have C = 10). The exponential term, Q0·C (i.e., normalized price), equals the cost of the reinforcer adjusted for the level of responding required to defend the level of demand at Q0.
Christensen et al. (2008) recently tested the predictive adequacy of this exponential model with two goods, cocaine and food. They found that it accommodated the variance in demand for these goods, and that food had greater essential value than intravenously (i.v.) administered cocaine. In addition, they showcased the utility of an economic approach in explaining an otherwise paradoxical drug effect: In some studies (e.g., Aigner & Balster, 1978), cocaine seems to evidence remarkable reinforcing power while in others its reinforcing efficacy seems weak (e.g., Foltin & Fischman, 1994). Actually, both sets of data are consistent with the judgment Christensen et al. (2008) reach that, when compared with food, cocaine is a reinforcer of lower essential value. As a demand analysis makes clear, the essential value of a good is defined by an animal's persistence in defending consumption as prices increase. It is this test that shows cocaine is inferior, at least when compared to food.
Reinforcer Classification
If the reader accepts our view that the essential value of cocaine is unremarkable or even weak, we have placed a popular distinction between food and cocaine in jeopardy—that “drug reward is more powerful than such natural biologically essential rewards as food, water, and sex… (Gardner, 2000, p. 286).” Indeed, if Gardner's assertion is true, why was it not validated in the results of Christensen et al. (2008 also see Lenoier et al., 2007)? The resolution of this quandary in classification ranges from denying there are important differences between cocaine and food to selection of alternative criteria that preserve this distinction. In this report, we adopt the latter approach.
An alternative basis for distinguishing between biologically relevant reinforcers and drugs of abuse might be based on work by Ahmed and Koob (1998). They found that rats working in 1-h sessions under a paced FR 1 for i.v. delivered cocaine responded at low, but stable rates; however, when a second group of rats was exposed to 6-h sessions, the rate and absolute level of consumption escalated across sessions. Inspection of Figure 2D from their paper supports labeling this an “escalation effect” because the dose-consumption curve for animals having experienced 6-h sessions was similar to that for those having experienced 1-h sessions except that it was shifted upward. Such a result is consistent with the idea that extended access to cocaine increased the point of drug satiety by an additive constant.
Figure 2.
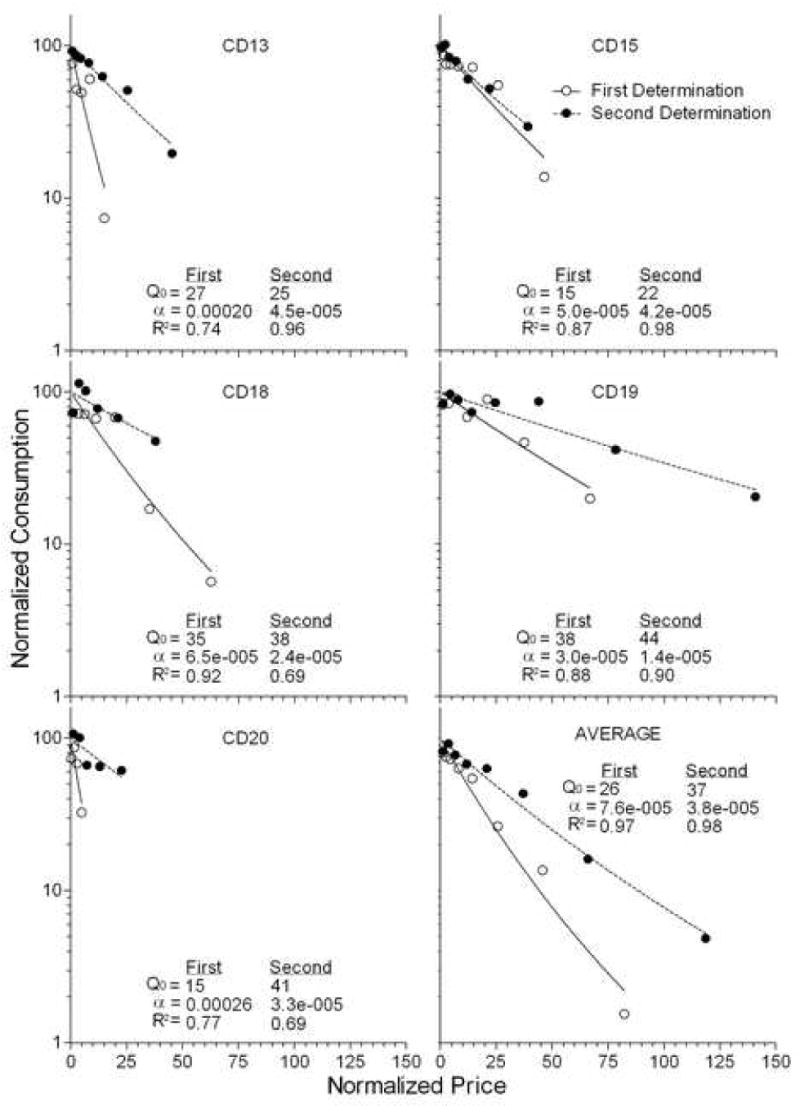
Individual data points represent normalized cocaine consumption as a function of normalized price for five rats and the group data for the first (open circle) and second (closed circle) determination. Each demand curve is fit with Equation 1 (solid and dotted line, respectively). The first determination was from Christensen et al. (in press). The second determination is from the present experiment. Values of parameters for the demand equation are presented in each panel.
Even in the absence of test, we know Ahmed and Koob's (1998) escalation effect is not reproducible with food. Due to homeostasis, lengthening food-consumption sessions must preclude an “escalation effect” because response rates for food consumption would decrease when a session's duration is increased. Given this is so, should we advance the presence vs. absence of an escalation effect as a basis for distinguishing cocaine from food?
As we discuss below, a classificatory scheme based on this distinction seems defensible, but the category labels of “escalation present” and “escalation absent” are not. The problem is that Ahmed and Koob's (1998) long-session data do not appear solely as an upward shift in consumption when they are analyzed in terms of the economics of demand.
To make a demand analysis of Ahmed and Koob's curves, three changes are in order. First, dose size must be expressed as price (responses/mg of cocaine) so that the graph does, in fact, plot demand. Second, price must be normalized to reflect the fact that it takes more responses to produce one percent of maximal consumption for subjects presented with 6-h sessions than for those with 1-h sessions (Hursh & Winger, 1995). Finally, to ensure comparability to the other graphs presented in this report and in Christensen et al. (2008), the axis of consumption should be normalized as well (Hursh & Winger, 1995). When this is done, the data from Figure 2D of Ahmed and Koob take the form presented in Figure 1. The axes of consumption and price are in log-linear format, respectively, because this is the form the exponential equation takes. Differences in α are easily discerned because the line's slope reflects the value of α.
Figure 1.
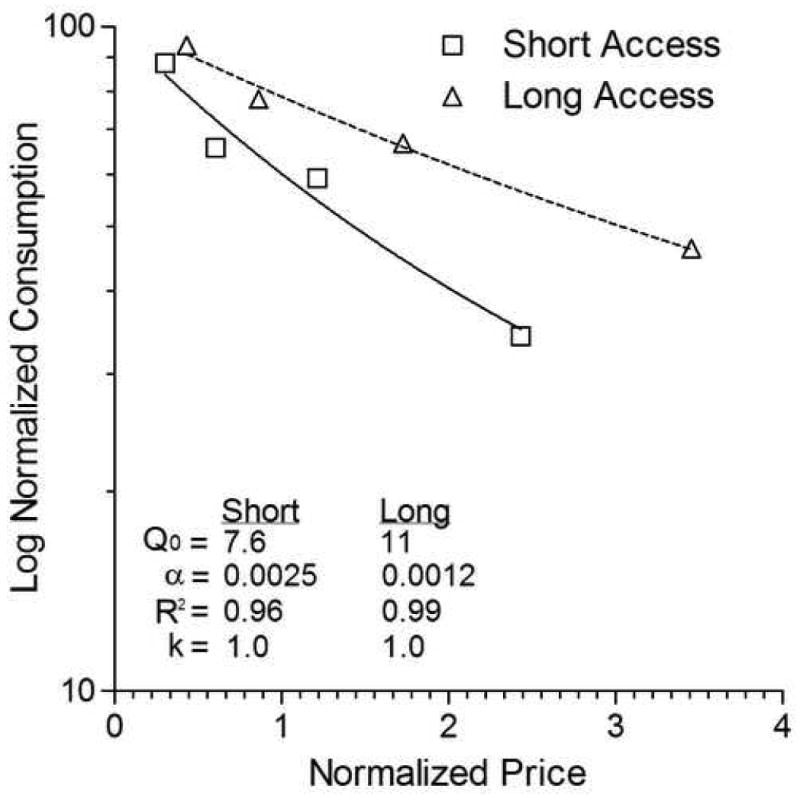
Demand curves for cocaine from Ahmed & Koob (1998; Figure 2D) plotted with normalized axes (Data obtained from S. Ahmed). The lines of best fit through the data are based on the exponential model of demand (Hursh & Silberberg, 2008). Parameter values of the model are presented in the Figure. See text for other details.
The results in Figure 1 show that in Ahmed and Koob (1998) rats with extended access to cocaine defended cocaine consumption with greater vigor than did their short-access counterparts. When normalized so that consumption at the lowest constraint is defined as 100% for both groups and so that each price represents an equivalent cost-benefit ratio (responses per 1% of the highest level of consumption), we find that the dose effect shift is not equal across constraints: the downward slope of the demand curve is less in the group given extended sessions. As measured by the exponential model of demand, which has been fit to the data, the essential value of cocaine is higher in animals with extended access relative to those with short access. As a consequence, the language “escalation effect” can no longer serve to describe these curves because extended-access data no longer appear simply as an upward shift in consumption. Indeed, as the between-curve difference in the value of α makes clear, what we witness in the data from Ahmed and Koob is not an escalation effect, but a reinforcement effect: Cocaine in long-access sessions is of higher reinforcing value than cocaine in short-access sessions.
Ahmed & Koob (2005) have analyzed this same upward shift in a similar economic framework by transforming dose size to unit price and then comparing the maximal level of responding, Rmax (functionally equivalent to Omax; see Hursh & Winger, 1995), between the two functions. Though consumption and price were not normalized in their analysis, in this case, a similar conclusion was reached. Rmax was higher in the escalated relative to the non-escalated animals indicating that the strength of cocaine in the escalated animals was higher.
These facts notwithstanding, the results of Ahmed and Koob (1998) can still provide an empirical rationale for distinguishing between food and cocaine. All that need differ are the category labels. Now the question is: Can drugs of abuse (e.g., cocaine) be distinguished from biologically essential reinforcers (e.g., food) in that the former, but not the latter, increases in essential value as a function of the duration of exposure?
Answering this question requires the use of a single demand procedure to provide two demonstrations: first, that cocaine grows in essential value with duration of exposure; and second, that food does not. These demonstrations are, respectively, the goals of Experiments 1 and 2. In both experiments, the method of analysis will be based on the economics of demand. The question to address is: When measured by the exponential model, do changes appear in essential value when demand curves are redetermined?
Experiment 1
To begin this analysis, we take the rats used in Experiment 2 of Christensen et al. (2008), extend their history of cocaine exposure from that used in the prior study, and then redetermine cocaine demand. If an extended cocaine history, arranged in terms of demand, increases cocaine's essential value, this fact should be evidenced by a decrease in the value of α (reduced sensitivity to price) in the demand curve from Experiment 1 when compared to its value in Experiment 2 of the prior study.
As a prelude to this effort, it is useful to review some of the prior behavioral work that compares the reinforcing properties of cocaine and food in non-human animals. Researchers have shown that patterns of responding are quite similar between these commodities under a variety of traditional schedules of reinforcement such as FR (Goldberg, 1973), variable-interval (Weiss et al., 2003), progressive-ratio (Negus & Mello, 2003), second-order schedules (Goldberg, 1973; Spear & Katz, 1991) as well as other types of schedules (Weiss et al., 2003). When presented in choice, allocation conformed, to some degree, to the predictions of the generalized matching law (Woolverton & Alling, 1999). Interestingly, Foltin (1999) has also shown, with some limitations, that cocaine and food will act as substitutes. In general, the reinforcing properties of these commodities appear similar.
Other choice studies have found that the selection of food relative to cocaine increases where a closed economy is used instead of an open economy (Nader & Woolverton, 1992a), where the price of cocaine increases (Nader & Woolverton, 1992b), where there is an increased delay between responding for cocaine and reinforcement (Woolverton & Anderson, 2006), where the magnitude of cocaine decreases (Woolverton & Balster, 1981), where position in a social hierarchy is decreased (Czoty et al., 2005), and where the magnitude of the food is increased (Nader & Woolverton, 1991; Woolverton & English, 1997; also see Nader et al., 2002).
Method
Subjects
Five, male Long-Evans rats from Christensen et al. (2008, Experiment 2), maintained at 85% of their free-feeding weights as determined at 16 weeks of age, served as subjects. Subjects were individually housed in plastic cages with cedar chip bedding in a colony room that had a 12-hour light-dark cycle (lights on at 0800). Sessions were conducted between 0700 and 1000. Water was continuously available in their home cages. The housing and care of the rats followed the guidelines of the “Guide for the Care and Use of Laboratory Rats” (Institute of Laboratory Animal Resources on Life Sciences, National Research Council, 1996).
Apparatus
Five operant conditioning chambers, sized 20 cm by 20 cm by 23.5 cm, served as the experimental space. The two side walls of the chamber were composed of Plexiglas, and the front and rear walls were aluminum. The grid floor consisted of 0.4-cm diameter steel rods spaced 1.3 cm apart. An aluminum response lever (1 cm by 2.5 cm by 2.5 cm) was located on the front wall 2.5 cm from the right side wall and 2.5 cm above the floor. A 1- by 1-cm food receptacle located 2 cm above the floor protruded 2 cm out from the center of the front wall. A Coulbourn stimulus light was located 4 cm directly above the response lever. A second stimulus light was located on the side wall 12.5 cm above the grid floor and 4.5 cm from the back wall.
Cocaine (provided by the National Institute on Drug Abuse, Bethesda, MD) in saline solution (5.12 mg/ml) was infused at a rate of 1.56 ml/min by 10-ml syringes driven by Med Associates (East Fairfield, VT) syringe pumps located outside of the operant conditioning chamber. Tygon tubing (Saint Gobain Performance Plastics, Akron, OH) extended from the 10-ml syringe to a Med Associates plastic swivel and tether apparatus that descended through the ceiling of the chamber. The tether was attached to a plastic screw that was cemented on the rat's head in order to reduce the tension on the catheter.
Subject History from Christensen et al. (2008), Experiment 2
All rats were initially trained to respond for food. Each training session was composed of four 30-min periods during which two 45-mg food pellets were delivered as a reinforcer for a lever press according to the FR contingency. The light on the side wall, which was continuously illuminated during each FR component, flashed for 10 s whenever a reinforcer was earned and was extinguished during the 1-min absent component which separated successive components. Lever presses during the absent component had no scheduled consequences. Except for the last FR component, responses made in one component that did not result in reinforcement before the component ended counted toward completion of the FR in the subsequent component. For the first few sessions, the size of the FR was gradually increased from one to its terminal value of 10. Once animals were responding so that the number of reinforcers earned did not vary by more than 20% on a FR 10 for two consecutive sessions, lever press training was considered complete.
Following this training, all rats were surgically prepared with chronic indwelling jugular-vein catheters and restraint headmounts using a procedure described by Panlilio, Weiss and Schindler (1996). In short, under Ketamine (60 mg/kg) and Xylazine (10 mg/kg) anesthesia, a 3.5-cm Silastic (0.044-mm ID, 0.814-mm OD) tube was inserted into the right jugular vein. This Silastic tubing was connected to an 8-cm piece of vinyl tubing (Dural Plastics; 0.5-mm ID, 1.0 mm-OD) that was passed under the skin around and above the shoulder and exited the body at the back between the shoulder blades. The vinyl tubing was threaded through a 10- by 10-mm section of Tygon tubing that served as a subcutaneous anchor. Six stainless-steel jeweler's screws were implanted in the skull to which a 20-mm plastic screw was cemented with dental acrylic so that it stood perpendicular to the top of the skull. After surgery, rats were given 5-7 days to recover in their home cages. Catheters were flushed daily with 0.1 ml of a saline solution containing 1.25 units/ml Heparin and 0.08 mg/ml Gentamycin.
Following recovery from surgery, all subjects were trained to lever press for cocaine infusions delivered at a concentration of 1 mg/kg. This training regimen was identical to that used for food except that: (a) cocaine was now the reinforcer instead of food; and (b) the alternate stimulus lamp located above the lever was used to cue FR components and reinforcer deliveries.
When animals were responding reliably under an FR 10, a demand curve for cocaine was determined. Conditions were identical to those in the cocaine training phase with the following three differences. First, cocaine components lasted 15 min instead of 30 min and the absent component lasted 16 min instead of 1 min. Second, while a session always started with a cocaine component followed by the absent component, the six remaining components were presented in a block randomized fashion such that within each block a cocaine component and an absent component were presented in random order. Third, the FR increased every three sessions according to the following list: 3, 10, 18, 32, 56, 100, 178, 320, and 560.
Procedure
Upon completing the determination of a cocaine demand curve in Experiment 2 of Christensen et al. (2008), animals in the present experiment responded for the same dose of cocaine (1 mg/kg) for seven daily sessions under an FR 3. Except for the constant price, the experimental arrangement was unchanged from that in Christensen et al. (2008). After completing seven sessions, a complete demand curve was assessed using the same procedure from Christensen et al. (2008), described above under Subject History fromChristensen et al. (2008), Experiment 2.
Results
The open and closed circles in Figure 2, respectively, present the cocaine demand curves from Experiment 2 of Christensen et al. (2008) and Experiment 1 of the present report in normalized-price by normalized-consumption space. The values of each subject's Q0, α, and R2 are presented within each panel. As is clear in the Figure and confirmed with a dependent-samples Wilcoxon test on the alpha values, the redetermined demand curve for cocaine supports a higher essential value than the original curve from Christensen et al. (2008; Z = 2.023, p < 0.05). As had been the case in the initial determination, the redetermined function is well described by the exponential model of demand.
Figure 3 presents the total amount of cocaine (mg/kg) earned for a rat under each of the FR schedules defining the demand curve from Experiment 2 of Christensen et al. (2008; open bars) and the present experiment (closed bars). A two-way repeated-measures ANOVA reveals a significant effect of session (F7, 4 = 18.13, p < 0.001) and history (F1,4 = 19.39, p < 0.02) and a non-significant session-by-history interaction (p > 0.05). Asterisks denote ratio sizes at which all subjects consumed more cocaine during the second demand determination than the first. Using a dependent-samples Wilcoxon test, the increase in consumption was significant up through the price of FR 56 (Zs = 2.023, ps < 0.05), with the increase at FR 100 approaching significance (p = 0.068). The reader interested in the absolute consumption data from which Figures 2 and 3 are drawn is referred to the table in the Appendix.
Figure 3.
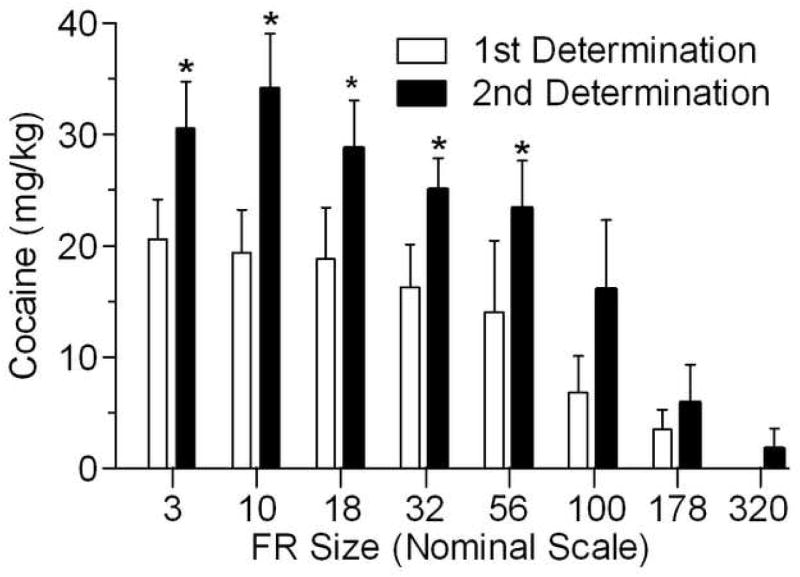
Average (+S.E.M.) infusions at each FR in the first (open bars) and second (closed bars) determination of cocaine demand for animals in Experiment 1.
Discussion
In this experiment, rats that had been used to define a cocaine demand curve in another study (Christensen et al., 2008) were exposed for seven sessions to the FR-3 contingency in that study's procedure. Subsequently, they continued on the same procedure with increasing ratios across sessions until their performances defined a cocaine demand curve for the second time. Clearly, continued exposure to cocaine resulted in the redetermined cocaine function showing higher essential value (Figure 2) and higher levels of demand (Figures 3) than in Christensen et al. (2008). The decrease in α across successive determinations is consistent with the notion that the reinforcing power of cocaine grows with experience; and the upward shift in demand seen in Figure 3 seems compatible with the dose-escalation effect noted by Ahmed and Koob (1998). Given that Ahmed and Koob also found that essential value grew with experience (see reanalysis of their data in Figure 1), our results and theirs appear compatible.
Our data and Ahmed and Koob's (1998) show that changes in essential value and drug escalation can covary. Is one of these effects the consequence of the other? Although it is not possible to answer this question with confidence, viewing escalation as due to the growing essential value of cocaine is advantaged by its compatibility with the commonly held view that the reinforcing power of addictive substances grows with their use, compelling increased consumption.
Despite the results of our experiment, our notion—that the essential value of cocaine grows with exposure—may be questioned based on other data sets. Liu et al. (2005) reported that under progressive-ratio (PR) schedules, the breakpoint for cocaine reinforcement does not change with session length (also see Childs et al., 2006; see, however, Deroche-Gammonet et al., 2004; Lack et al., 2008; Paterson & Markou, 2003). In addition, Vanderschuren and Everitt (2004) found that response rates to a “drug-seeking” lever were the same whether sessions of cocaine administration were long or short. These results support the view that there is no necessary connection between the duration of cocaine consumption and reinforcing power.
We reconcile these data with ours by arguing that the outcomes of demand analysis should be given greater credence than those from these alternate assays. Regarding rate measures such as Vanderschuren and Everitt's (2004), Hursh and Silberberg (2008) note that over a range of moderate to high rates of reinforcement, response rates can be largely invariant, limiting their utility as a strength measure (e.g., see Catania & Reynolds, 1968; Hall & Lattal, 1999). Problems are also present in breakpoint analyses such as the one provided by Liu et al. (2005). As step size increases in a PR, the breakpoint measure necessarily becomes cruder, and can be step-size dependent (Hodos & Kalman, 1963). For this reason, approximate equivalence in breakpoint need not mean approximate equivalence in reinforcing value. Given these difficulties, we believe the demand analysis offered here and in Christensen et al. (2008) should be used preferentially as the measure of reinforcer strength. Unlike PR strength measures, which are based on a single “breakpoint,” demand analysis is independent of absolute level of consumption, and is based on the slope of consumption across the entire range of constraint. A demand analysis based on the current findings, along with the reanalyzed data from Ahmed and Koob's (1998) in Figure 1, support the view that the duration of cocaine exposure and cocaine's essential value covary.
Experiment 2
The results of Experiment 1 are consistent with the notion that the essential value of cocaine grows with use. Experiment 2 addresses the next part of our thesis—that a demand analysis similar to that used in Experiment 1 will fail to appear with the biologically necessary good of food. The key question we ask is whether the duration of food reinforcement also affects its reinforcing power.
Suggestive evidence is available from a study that made multiple determinations of demand for food (Raslear et al., 1988). To our visual inspection, little change appears in the form of their demand curves as a function of duration of exposure (see their Figure 2A). If so, it suggests that food might be a useful counterpoint to cocaine. Based on the results of Experiment 1 and our interpretation of Raslear et al., it might be possible to show that the reinforcing properties of cocaine, but not food, grow with exposure. To test this possibility, Experiment 2 will repeat the general design of Experiment 1, this time with food serving as the reinforcer.
Subjects
Five, male Long Evans rats from Christensen et al. (2008, Experiment 3), maintained at 85% of their free-feeding weights and given unrestricted access to water in their home cages, served as subjects.
Subject History from Christensen et al. (2008), Experiment 3
The experimental history of these animals (Christensen et al., 2008, Exp. 3) was identical to that of the subjects in Experiment 1 except that: (a) the animals were never intubated with catheters; and (b) never allowed to respond for cocaine. Only food served as the reinforcer; and except during training, was earned exclusively during a session. If animals fell below 70% of their free-feeding weight, they were temporarily removed from the study and given unrestricted access to food in their home cages until they reached at least 80% of their free-feeding weight. Once at this criterion, food was taken away. One day later they were fed a ration to maintain their body weights at 80% of free-feeding levels, and were returned to the study the following day.
Apparatus
The apparatus was the same as described in Experiment 1.
Procedure
The procedure was the same as that described in Experiment 1 except that food was used as the reinforcer instead of cocaine, the food-stimulus light located on the side wall opposite the lever was used instead of the cocaine-stimulus light, and animals were not supplementally fed unless they fell below 70% of their free-feeding weights. In that case, the supplemental-feeding procedure described above was used.
Results
The open and closed triangles in Figure 4, respectively, represent the food demand curves from Experiment 3 of Christensen et al. (2008) and Experiment 2 of the present report in normalized price-by-consumption space. The values of each subject's Q0, α, and R2 are presented within each panel. There was not a significant difference in the essential value of food using a dependent-samples Wilcoxon test on the alpha values (Z = 1.483, p > 0.05). The fits by the exponential model are excellent. With the exception of one fit for CD24, where R2 = 0.93, all fits accommodate at least 97% of the variance.
Figure 4.
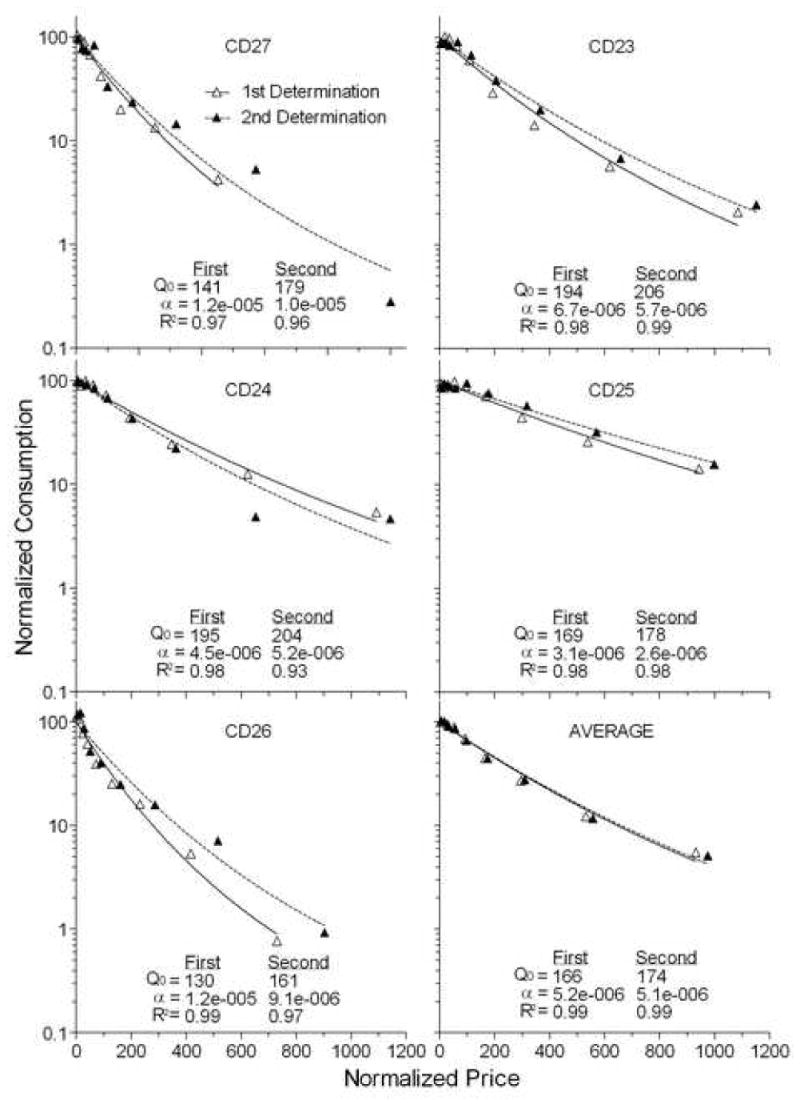
Two food demand curves in normalized price, consumption space. One curve (open triangles) is from the first determination of demand for the rats from Experiment 3 in Christensen et al. (in press). The other (closed triangles) is from the second determination in the present experiment. Each curve is fit by the exponential equation of demand, the parameter values of which are presented within the panel.
Figure 5 presents the mean number of g of food consumed per kg of body weight under each FR defining the demand curve from Experiment 3 of Christensen et al. (2008, Experiment 3; open bars) and the present experiment (closed bars). This dose-like transformation of the food-consumption axis eliminates the effect of any change in subjects' body weights between successive determinations. A two-way repeated-measures ANOVA revealed the expected significant effect of session (F8,4 = 51.28, p < 0.001), but no effect of history or a session-by-history interaction (ps > 0.05).
Figure 5.

Average (+S.E.M.) infusions at each FR in the first (open bars) and second (closed bars) determination of food demand for animals in Experiment 2.
Discussion
To a first approximation, neither the essential value of food nor the food-consumption, body-weight ratio changed between successive determinations of demand curves. These results with food contrast with those from Experiment 1. In that experiment, the essential value of cocaine and the level of its consumption increased significantly between successive determinations. These results provide empirical support for an idea advanced earlier: A possible basis for distinguishing between a drug of abuse (in this case, cocaine), and a biologically regulated, necessary good (i.e., food) now has empirical support. Whether the effects we report—that reinforcement with cocaine, but not food, has hysteretic properties—generalize to other drugs of abuse and biologically necessary goods remains on open question. Providing evidence for the generality of the hysteretic properties of drugs of abuse, Lenoir & Ahmed (2007) have recently shown heroin elasticity is greater in rats given short sessions to heroin relative to rats given long access. To our knowledge, there exists no data aside from what is presented here comparing the elasticity of biologically necessary goods at different time points in history. To the extent that these effects do generalize to other goods, it may be the case that we have a basis for distinguishing between classes of goods that differ in their presumed addictive properties.
General Discussion
Foltin and Fischman (1994) found that cocaine addicts would often tradeoff infusions of cocaine for corn chips or a videotape movie. To us, these results were puzzling for they seem to contradict the commonly held view that drugs such as cocaine are distinguishable from many other goods in terms of their greater reinforcing power (Gardner, 2000). If, indeed, cocaine is singular in its value, why is an addict exchanging its infusion for a bag of food snacks?
By use of a demand analysis, Christensen et al. (2008) explained these findings, claiming error in the commonly held view: Addicts tradeoff cocaine for food snacks because, in the economic context in which this choice occurred, cocaine's reinforcing power is unremarkable. If this explanation is accepted, how then should we distinguish drugs of abuse from other goods? The present report proposes we consider a metric based not on static differences in reinforcer strength, but on dynamic changes noted by Ahmed and Koob (1998) in cocaine consumption over time (escalation effect). Perhaps some feature of the reinforcing value of addictive substances grows with exposure, while those of homeostatically regulated goods like food do not.
To make the Ahmed and Koob (1998) data amenable to a demand analysis, their data were transformed to demand curves. When this was done, it was clear that an effect they describe as escalation could be attributed to reinforcement, for their transformed data showed that lengthening sessions not only increased cocaine's consumption, but also increased its essential value.
For the purpose of providing a basis for discriminating among reinforcers in terms of their abuse liability, the causal relation between escalation and increasing reinforcer value is unimportant. To the extent that these measures covary, either growth in consumption or in reinforcing value could be used to identify substances likely to be abused. We favor interpreting Ahmed and Koob's (1998) results as a reinforcement effect primarily because the data plotted in Figure 1 reflect a characteristic many consider present in addictive substances—that their continued use compels their subsequent consumption.
In order to see if cocaine could be distinguished from food in terms of time-dependent changes in escalation and essential value, two demand analyses from Christensen et al. (2008), one based on cocaine and the other on food, were repeated. We found that cocaine grew in reinforcer value and increased in consumption (escalation) over successive determinations (see Figures 2 and 3). Neither of these changes occurred when the reinforcer was food (see Figures 4 and 5). These results suggest that a possible means for distinguishing between substances that are of high abuse liability from those that are not might be to determine if the reinforcing power of a good increases with duration of exposure. If it does, its abuse potential might be elevated. Obviously, the generality of this claim awaits subsequent investigation.
Acknowledgments
This research was supported by National Institute on Drug Abuse Grant 1F31DA024493-01 awarded to C. Christensen.
Appendix
Absolute individual and group consumption levels during the first (1st) and second (2nd) determinations for Experiment 1 (cocaine) and Experiment 2 (food)
| Cocaine | ||||||||||||
|---|---|---|---|---|---|---|---|---|---|---|---|---|
| CD13 | CD15 | CD18 | CD19 | CD20 | Average | |||||||
| Price | 1st | 2nd | 1st | 2nd | 1st | 2nd | 1st | 2nd | 1st | 2nd | 1st | 2nd |
| 3 | 20.7 | 23.5 | 14.3 | 21.3 | 25.7 | 27.7 | 31.0 | 37.0 | 11.3 | 43.3 | 20.6 | 30.6 |
| 10 | 14.0 | 22.0 | 12.7 | 22.5 | 25.3 | 43.0 | 31.7 | 42.5 | 13.3 | 41.0 | 19.4 | 34.2 |
| 18 | 13.3 | 21.0 | 11.0 | 18.5 | 25.2 | 38.5 | 34.0 | 39.0 | 10.5 | 27.0 | 18.8 | 28.8 |
| 32 | 16.3 | 19.7 | 11.0 | 17.5 | 23.5 | 29.3 | 25.7 | 32.3 | 5.0 | 26.5 | 16.3 | 25.1 |
| 56 | 2.0 | 16.0 | 10.7 | 13.3 | 24.0 | 25.5 | 33.5 | 37.3 | 0.0 | 25.0 | 14.0 | 23.4 |
| 100 | 0.0 | 13.0 | 10.5 | 11.5 | 6.0 | 18.0 | 17.5 | 38.0 | 0.0 | 0.0 | 6.8 | 16.1 |
| 178 | 0.0 | 5.0 | 8.0 | 6.5 | 2.0 | 0.0 | 7.5 | 18.3 | 0.0 | 0.0 | 3.5 | 6.0 |
| 320 | 0.0 | 0.0 | 2.0 | 0.0 | 0.0 | 0.0 | 0.0 | 9.0 | 0.0 | 0.0 | 0.4 | 1.8 |
| Food | ||||||||||||
| CD27 | CD23 | CD24 | CD25 | CD26 | Average | |||||||
| FR | 1st | 2nd | 1st | 2nd | 1st | 2nd | 1st | 2nd | 1st | 2nd | 1st | 2nd |
| 3 | 146.7 | 171.7 | 172.0 | 179.7 | 197.3 | 198.7 | 159.3 | 155.0 | 148.0 | 190.7 | 164.7 | 179.1 |
| 10 | 135.0 | 137.0 | 196.0 | 183.3 | 175.3 | 195.3 | 144.7 | 168.7 | 139.7 | 197.0 | 158.1 | 176.3 |
| 18 | 127.7 | 132.7 | 189.0 | 171.7 | 193.7 | 187.7 | 156.3 | 158.7 | 101.0 | 139.7 | 153.5 | 158.1 |
| 32 | 95.3 | 149.5 | 159.3 | 186.5 | 176.3 | 172.3 | 166.0 | 152.0 | 79.3 | 83.7 | 135.3 | 148.8 |
| 56 | 59.7 | 59.7 | 116.0 | 139.0 | 141.0 | 139.0 | 150.3 | 170.0 | 51.0 | 65.0 | 103.6 | 114.5 |
| 100 | 28.3 | 42.0 | 56.0 | 79.3 | 86.0 | 88.0 | 119.3 | 136.3 | 33.0 | 40.3 | 64.5 | 77.2 |
| 178 | 19.0 | 26.0 | 27.5 | 41.0 | 47.5 | 45.5 | 74.5 | 102.5 | 21.0 | 25.5 | 37.9 | 48.1 |
| 320 | 6.0 | 9.5 | 11.0 | 14.0 | 24.5 | 10.0 | 43.5 | 57.5 | 7.0 | 11.5 | 18.4 | 20.5 |
| 560 | 0.0 | 0.5 | 4.0 | 5.0 | 10.5 | 9.5 | 24.0 | 28.0 | 1.0 | 1.5 | 7.9 | 8.9 |
Footnotes
Publisher's Disclaimer: This is a PDF file of an unedited manuscript that has been accepted for publication. As a service to our customers we are providing this early version of the manuscript. The manuscript will undergo copyediting, typesetting, and review of the resulting proof before it is published in its final citable form. Please note that during the production process errors may be discovered which could affect the content, and all legal disclaimers that apply to the journal pertain.
Contributor Information
Chesley J. Christensen, Email: cc4038a@american.edu.
Alan Silberberg, Email: asilber@american.edu.
Steven R. Hursh, Email: srhursh@ibrinc.org.
Peter G. Roma, Email: peteroma1@yahoo.com.
Anthony L. Riley, Email: alriley@american.edu.
References
- Ahmed SH, Koob GF. Transition from moderate to excessive drug intake: Change in hedonic set point. Science. 1998;282:298–301. doi: 10.1126/science.282.5387.298. [DOI] [PubMed] [Google Scholar]
- Ahmed SH, Koob GF. Transition to drug addiction: a negative reinforcement model based on an allostatic decrease in reward function. Psychopharmacology. 2005;180:473–90. doi: 10.1007/s00213-005-2180-z. [DOI] [PubMed] [Google Scholar]
- Aigner TG, Balster RL. Choice behavior in rhesus monkeys: Cocaine versus food. Science. 1978;201:534–35. doi: 10.1126/science.96531. [DOI] [PubMed] [Google Scholar]
- Catania AC, Reynolds GS. A quantitative analysis of the responding maintained by interval schedules of reinforcement. Journal of the Experimental Analysis of Behavior. 1968;11:327–83. doi: 10.1901/jeab.1968.11-s327. [DOI] [PMC free article] [PubMed] [Google Scholar]
- Childs E, Shoaib M, Stolerman IP. Cocaine self-administration in rats with histories of cocaine exposure and discrimination. Psychopharmacology. 2006;286:168–76. doi: 10.1007/s00213-006-0364-9. [DOI] [PubMed] [Google Scholar]
- Christensen CJ, Silberberg A, Hursh SR, Huntsberry ME, Riley AL. Essential value of cocaine and food in rats: tests of the exponential model of demand. Psychopharmacology. 2008;198(2):221–29. doi: 10.1007/s00213-008-1120-0. [DOI] [PubMed] [Google Scholar]
- Czoty PW, McCabe C, Nader MA. Assessment of the Relative Reinforcing Strength of Cocaine in Socially Housed Monkeys Using a Choice Procedure. The Journal of Pharmacology and Experimental Therapeutics. 2005;312(1):96–102. doi: 10.1124/jpet.104.073411. [DOI] [PubMed] [Google Scholar]
- Deroche-Gamonet V, Belin D, Piazza PV. Evidence for addiction-like behavior in the rat. Science. 2004;305:1014–17. doi: 10.1126/science.1099020. [DOI] [PubMed] [Google Scholar]
- Foltin RW. Food and cocaine self-administration by baboons: effects of alternatives. Journal of the Experimental Analysis of Behavior. 1999;72:215–34. doi: 10.1901/jeab.1999.72-215. [DOI] [PMC free article] [PubMed] [Google Scholar]
- Foltin RW, Fischman MW. Effects of buprenorphine on the self-administration of cocaine by humans. Behavioural Pharmacology. 1994;5:79–89. doi: 10.1097/00008877-199402000-00009. [DOI] [PubMed] [Google Scholar]
- Gardner EL. What we have learned about addiction from animal models of drug self-administration. The American Journal on Addictions. 2000;9:285–313. doi: 10.1080/105504900750047355. [DOI] [PubMed] [Google Scholar]
- Goldberg SR. Comparable behavior maintained under fixed-ratio and second-order schedules of food presentation, cocaine injection or d-amphetamine injection in the squirrel monkey. The Journal of Pharmacology and Experimental Therapeutics. 1973;186(1):18–30. [PubMed] [Google Scholar]
- Hall GA, Lattal KA. Reward density and variable-interval schedule performance in an open economy. Journal of the Experimental Analysis of Behavior. 1999;72:341–54. doi: 10.1901/jeab.1999.72-341. [DOI] [PMC free article] [PubMed] [Google Scholar]
- Hodos W, Kalman G. Effects of increment size and reinforce volume on progressive ratio performance. Journal of the Experimental Analysis of Behavior. 1963;6:387–92. doi: 10.1901/jeab.1963.6-387. [DOI] [PMC free article] [PubMed] [Google Scholar]
- Hursh SR, Silberberg A. Economic demand and essential value. Psychological Review. 2008;115:186–98. doi: 10.1037/0033-295X.115.1.186. [DOI] [PubMed] [Google Scholar]
- Hursh SR, Winger G. Normalized demand for drugs and other reinforcers. Journal of the Experimental Analysis of Behavior. 1995;64:373–84. doi: 10.1901/jeab.1995.64-373. [DOI] [PMC free article] [PubMed] [Google Scholar]
- Lack CM, Jones SR, Roberts DC. Increased breakpoints on a progressive ratio schedule reinforced by IV cocaine are associated with reduced locomotor activation and reduced dopamine efflux in nucleus accumbens shell in rats. Psychopharmacology. 2008;195:517–25. doi: 10.1007/s00213-007-0919-4. [DOI] [PubMed] [Google Scholar]
- Lenoir M, Ahmed SH. Supply of a nondrug substitute reduces escalated heroin consumption. Neuropsychopharmacology. 2007 doi: 10.1038/sj.npp.1301602. Epub ahead of print. [DOI] [PubMed] [Google Scholar]
- Lenoir M, Serre F, Cantin L, Ahmed SH. Intense sweetness surpasses cocaine reward. PLoS ONE. 2007;2:e698. doi: 10.1371/journal.pone.0000698. [DOI] [PMC free article] [PubMed] [Google Scholar]
- Liu Y, Roberts DCS, Morgan D. Effects of extended-access self-administration and deprivation on breakpoints maintained by cocaine in rats. Psychopharmacology. 2005;179:644–51. doi: 10.1007/s00213-004-2089-y. [DOI] [PubMed] [Google Scholar]
- Nader MA, Sinnott RS, Mach RH, Morgan D. Cocaine- and food-maintained responding under a multiple schedule in rhesus monkeys: environmental context and the effects of a dopamine antagonist. Psychopharmacology. 2002;163:292–301. doi: 10.1007/s00213-002-1202-3. [DOI] [PubMed] [Google Scholar]
- Nader MA, Woolverton WL. Effects of increasing the magnitude of an alternative reinforcer on drug choice in a discrete-trials choice procedure. Psychopharmacology. 1991;105:169–74. doi: 10.1007/BF02244304. [DOI] [PubMed] [Google Scholar]
- Nader MA, Woolverton WL. Choice between cocaine and food by rhesus monkeys: effects of conditions of food availability. Behavioural Pharmacology. 1992a;3:635–38. [PubMed] [Google Scholar]
- Nader MA, Woolverton WL. Effects of increasing response requirement on choice between cocaine and food in rhesus monkeys. Psychopharmacology. 1992b;108:295–300. doi: 10.1007/BF02245115. [DOI] [PubMed] [Google Scholar]
- Negus SS, Mello NK. Effects of chronic d-amphetamine treatment on cocaine- and food-maintained responding under a progressive-ratio schedule in rhesus monkeys. Psychopharmacology. 2003;167:324–32. doi: 10.1007/s00213-003-1409-y. [DOI] [PubMed] [Google Scholar]
- Panlilio LV, Weiss SJ, Schindler CW. Cocaine self-administration increased by compounding discriminative stimuli. Psychopharmacology. 1996;125:202–8. doi: 10.1007/BF02247329. [DOI] [PubMed] [Google Scholar]
- Paterson NE, Markou A. Increased motivation for self-administered cocaine after escalated cocaine intake. NeuroReport. 2003;14:2229–32. doi: 10.1097/00001756-200312020-00019. [DOI] [PubMed] [Google Scholar]
- Raslear TG, Bauman RA, Hursh SR, Shurtleff D, Simmons L. Rapid demand curves for behavioral economics. Animal Learning & Behavior. 1988;16:330–39. [Google Scholar]
- Spear DJ, Katz JL. Cocaine and food as reinforcers: effects of reinforcer magnitude and response requirement under second-order fixed-ratio and progressive-ratio schedules. Journal of the Experimental Analysis of Behavior. 1991;56:261–75. doi: 10.1901/jeab.1991.56-261. [DOI] [PMC free article] [PubMed] [Google Scholar]
- Vanderschuren LJ, Everitt BJ. Drug seeking becomes compulsive after prolonged cocaine self-administration. Science. 2004;305:1017–19. doi: 10.1126/science.1098975. [DOI] [PubMed] [Google Scholar]
- Weiss SJ, Kearns DN, Cohn SI, Schindler CW, Panlilio LV. Stimulus control of cocaine self-administration. Journal of the Experimental Analysis of Behavior. 2003;79:111–35. doi: 10.1901/jeab.2003.79-111. [DOI] [PMC free article] [PubMed] [Google Scholar]
- Woolverton WL, Alling K. Choice under concurrent VI schedules: comparison of behavior maintained by cocaine or food. Psychopharmacology. 1999;141:47–56. doi: 10.1007/s002130050805. [DOI] [PubMed] [Google Scholar]
- Woolverton WL, Anderson KG. Effects of delay to reinforcement on the choice between cocaine and food in rhesus monkeys. Psychopharmacology. 2006;186:99–106. doi: 10.1007/s00213-006-0355-x. [DOI] [PubMed] [Google Scholar]
- Woolverton WL, Balster RL. Effects of antipsychotic compounds in rhesus monkeys given a choice between cocaine and food. Drug and Alcohol Dependence. 1981;8:69–78. doi: 10.1016/0376-8716(81)90088-0. [DOI] [PubMed] [Google Scholar]
- Woolverton WL, English JA. Further analysis of choice between cocaine and food using the unit price model of behavioral economics. Drug and Alcohol Dependence. 1997;49:71–78. doi: 10.1016/s0376-8716(97)00145-2. [DOI] [PubMed] [Google Scholar]