Abstract
Protonated poly(ethylene glycol), produced by electrospray ionization (ESI), with molecular weights ranging from 0.3 to 5 kDa and charge states from 1+ to 7+ were characterized using high-field asymmetric waveform ion mobility spectrometry (FAIMS). Results for all but some of the 3+ and 4+ charge states are consistent with a single gas-phase conformer or family of unresolved conformers for each of these charge states. The FAIMS compensation voltage scans resulted in peaks that could be accurately fit with a single Gaussian for each peak. The peak widths increase linearly with compensation voltage for maximum ion transmission but do not depend on m/z or molecular weight. Fitting parameters obtained from the poly(ethylene glycol) data were used to analyze conformations of oxidized and reduced lysozyme formed from different solutions. For oxidized lysozyme formed from a buffered aqueous solution, a single conformer (or group of unresolved conformers) was observed for the 7+ and 8+ charge states. Two conformers were observed for the 9+ and 10+ charge states formed from more denaturing solutions. Data for the fully reduced form indicate the existence of up to three different conformers for each charge state produced directly by ESI and a general progression from a more extended to a more folded structure with decreasing charge state. These results are consistent with those obtained previously by proton-transfer reactivity and drift tube ion mobility experiments, although more conformers were identified for the fully reduced form of lysozyme using FAIMS.
Keywords: FAIMS, Lysozyme, Protein conformation, PEG, Poly(ethylene glycol)
1. Introduction
The ability to characterize complex mixtures, such as environmental, natural product, and cellular proteome samples, can be greatly enhanced by using two or more orthogonal methods of analysis. For example, the combination of liquid chromatography (LC) with mass spectrometry has been used to separate and identify thousands of proteins from microgram sample quantities [1]. Although the peak capacity of LC separations can be high, the time required for optimum separations can be long which limits sample throughput. For example, two dimensional LC separations can have peak capacities of ∼3000 but can require up to 30 h analysis time [1,2]. The development of rapid separation methods to either augment or replace traditional solution-phase separations could result in improved analytical capabilities and increased sample throughput [3].
Drift tube ion mobility spectrometry (IMS) and high-field asymmetric waveform ion mobility spectrometry (FAIMS) are rapid gas-phase separation methods with potential to significantly increase sample throughput. Clemmer and coworkers have developed an on-line combination of LC, IMS, and mass spectrometry to improve separations without increasing analysis time [4-6]. This method has been used for both bottom-up [7-10] and top down approaches to proteomics [11]. The gas-phase conformers of peptides, proteins, and DNA have also been investigated using drift tube IMS [12-20].
FAIMS [21-23] can also been used to separate a wide variety of ions in the gas phase, and has been used to separate protein conformers [21,22]. With FAIMS, ions are separated based on differences between the mobility of the ion in the presence of weak and strong electric fields [22]. Ions formed by electrospray ionization (ESI) can be introduced into the FAIMS device through a desolvation region into a gap between two cylindrical electrodes. The use of cylindrical electrodes can enhance ion transmission through the FAIMS device due to ion focusing which can result in improved sensitivity [24]. Ions are transmitted past the electrode surfaces towards the entrance of the mass spectrometer by a carrier gas that flows between the two electrodes. An asymmetric waveform is applied to one electrode. Ions are displaced towards one and then the other electrode by a high field for a short time followed by a low field of opposite polarity for a longer time. If the ion mobility is the same at high and low electric fields, the ion will experience zero net displacement towards an electrode and will be transmitted through the FAIMS device into the mass spectrometer. However, the mobilities of most ions depend on electric field strength over the range used in these experiments resulting in a net displacement of the ions towards one of the electrodes. The mobilities of atomic ions and small organic ions tend to increase at higher electric fields, whereas the mobilities of proteins and larger molecules tend to decrease at higher electric fields [21]. To select which ions are transmitted into the mass spectrometer, a dc potential, referred to as a compensation voltage (CV), is applied to one electrode to eliminate the net displacement of the ion towards one electrode of the FAIMS device. CV scans are generated by scanning through a range of compensation voltages and measuring the ion abundance transmitted through the FAIMS device as a function of compensation voltage. Although it is currently not possible to determine absolute cross-sections directly from the FAIMS CV scans, the presence of different gas-phase conformations of the same ion is indicated by two or more peaks of ion transmission in FAIMS CV scans [25].
Although separation by FAIMS and drift tube IMS are fast, the number of components that can be separated is relatively small. In many cases, incomplete separations lead to broadened peaks in mobility scans. With drift tube ion mobility, the instrumental response is typically well characterized so that the number of components that contribute to broadened peaks can be estimated by determining the minimum number of overlapping flight time distributions required to fit the observed experimental data [26-28]. Such fitting processes have been used for protein separations [28] and have also been used to determine dimer binding energies [15] and barrier heights for conversions between conformers [16,17].
The minimum number of unresolved conformers in FAIMS CV scan peaks is difficult to determine by fitting methods because the width of peaks in FAIMS CV scans depends on many factors, such as the shape of [29,30] and gap between [30] the electrodes, the frequency and magnitude of the applied asymmetric waveform [31], the carrier gas composition [32-35], and the compensation voltage [24]. The variety of parameters influencing the width of FAIMS CV scan peaks makes it challenging to accurately predict the expected peak width of a single gas-phase conformer.
Guevremont and coworkers reported that peak shapes are influenced by ion focusing from the curved electrode surfaces used in cylindrical devices, with ion–ion repulsion and ion diffusion limiting the extent of ion focusing [22,24]. Increased ion focusing results in wider peaks in FAIMS CV scans. For ions with a larger difference between high and low mobility, the ion focusing is greater and a higher magnitude CV is required for ion transmission into the mass spectrometer. Therefore, ions with larger peak widths due to increased ion focusing are transmitted through the FAIMS device at higher magnitude CV values [22,24]. This correlation between peak width and CV presents a challenge for estimating the number of conformers in CV scan peaks as the expected peak width of a single conformer is different for ions transmitted through the FAIMS device at differing compensation voltages.
The relationship between CV and peak width can be experimentally determined from CV scan data of a series of ions with a single gas-phase conformation transmitted through the FAIMS device in a range of CV values. Polyethlylene glycol has a single major conformation as measured by drift tube IMS [36-39], with several lower abundant minor peaks resolved by FAIMS CV scans [40]. The low molecular weight PEG samples used in these FAIMS and drift tube IMS studies have a limited range of molecular weights and charge states. The structures of higher molecular weight PEG ions have been characterized by differential mobility analysis [41] and these ions can be used to extend the range of molecular weights and charge states used in such an analysis.
Here, we experimentally determine the relationship between peak width and compensation voltage using CV scan data of the synthetic linear polymer PEG and apply this relationship to estimate the minimum number of lysozyme conformers separated by FAIMS, both with disulfide bonds intact and reduced. Lysozyme was used to evaluate this method because there are extensive collisional cross-section [28] and gas-phase basicity [42] measurements which suggested significant gas-phase conformational differences between ion populations with disulfide bonds intact and reduced.
2. Experimental
2.1. Samples
Polyethylene glycol 600, 3400, 4600, hen egg-white lysozyme, and dithiothreitol (DTT) (Sigma–Aldrich Co., St. Louis, MO) were used without further modification except for experiments in which the disulfide bonds of lysozyme were reduced as described below. Methanol, acetic acid (Fisher Scientific, Pittsburgh, PA), and ammonium bicarbonate (J.T. Baker, Phillipsburg, NJ) were used as received. The solution concentrations of all PEG samples with average molecular weights of 600, 3400, and 4600 Da were 100 μM (calculated from the average molecular weight) in 49.5/49.5/1% by volume water/methanol/acetic acid. Lysozyme solutions were 3 × 10⁻⁵ M in either an aqueous solution buffered with 200 mM ammonium bicarbonate or 33.2/66.5/0.3%, by volume, water/methanol/acetic acid solution. Some water/methanol/acetic acid solutions contained 1.3 mM DTT as a reducing agent. Disulfide bonds were reduced using the method of Gross et al. [42]. In short, 1 mL aliquots of 50 μM lysozyme and 2 mM DTT were heated in a 100 °C water bath for 30 min. The heated solution was then diluted with methanol and acetic acid to the concentrations described above and loaded into a resistively heated ESI nanocapillary tip. The capillary tip was heated to ensure that the disulfide bonds remained reduced.
2.2. Mass spectrometry
All mass spectra were obtained on the Berkeley-Bruker 9.4 T FT/ICR mass spectrometer (Bruker Daltonics, Billerica, MA) [43]. The extended pseudo-open cylindrical cell used in these experiments has been described previously [44]. Ions were formed by nanoelectrospray using a pulled capillary that was positioned about 5 mm from the opening in the curtain plate of FAIMS [44]. A voltage of 2400−2900 V was applied to a platinum wire inserted into the back end of the capillary so that it made contact with the solution to be sprayed. Ions were accumulated in the hexapole ion guide for 0.2 s prior to injection into the cell and eight ion injections were used prior to mass analysis. No signal averaging was done. Data in which the disulfide intact versus reduced forms of lysozyme are compared were all obtained on the same day.
2.3. FAIMS
An Ionalytics Selectra (Thermo-Electron, Waltham, MA) was used for the FAIMS experiments. The interface of FAIMS to the Berkeley-Bruker FT/ICR mass spectrometer has been described previously [40,44]. The asymmetric waveform that is used in the FAIMS apparatus consists of a sine wave that is combined with the second harmonic which is 90° out of phase. The maximum amplitude, or dispersion voltage (DV) of this waveform was −3800 and −4600 V for lysozyme and PEG, respectively. For all experiments, a nitrogen carrier gas flow rate of 2 L/min was used, the potential of the outer FAIMS electrode was −30 V and the curtain plate potential was 1000 V. CV scans were obtained by changing compensation voltage from −2 to −22 V with a step size of about 0.1 V.
2.4. Analysis
All FAIMS data was analyzed using R statistical analysis software (R foundation for Statistical Computing, Vienna, Austria) Version 2.1.0. Both PEG and lysozyme CV scans were fit to a Gaussian equation:
| (1) |
where a, b, and c, are the amplitude, center, and population standard deviation, respectively. The population standard deviation is related to the full width at half maximum (FWHM) by:
| (2) |
The CV data were fit using the curve fitting tool in Matlab (The Mathworks, Natick, MA). For the PEG data, the program was used to find the optimized parameters for a single Gaussian peak. The peak widths for the protonated PEG data were then plotted against the CV of the Gaussian center and a trend line was fit to this data. Using the equation from this trend line, the width of a single conformer was calculated at specific CV values. The lysozyme CV data was then fit by iteratively fixing the width, finding the optimum center at that width, and then adjusting the width to the new center. This typically required three to four iterations. The number of Gaussians under the CV data was then taken to be the minimum number necessary to fit the data.
3. Results
3.1. FAIMS CV scans of PEG
Protonated molecules of PEG with molecular weights ranging from 370 to 5126 Da and with charge states ranging from 1+ to 7+ were formed from PEG 600, 3400, and 4600 solutions. CV scans were obtained for the ions formed from these three solutions. For each of the PEG ions, there is typically a single major peak of ion transmission through the FAIMS device. Representative CV scans for several charge states of protonated PEG oligomers formed from solutions containing PEG 600 and 3400 are shown in Fig. 1. Using drift tube IMS, Bowers and coworkers found that there was a single conformer for singly charged, cationized PEG 600 ions [36-39]. Using FAIMS, Robinson et al. found a single large peak (98.9%) and three minor peaks in CV transmission for singly charged sodiated PEG, indicating the presence of a single predominant conformer and three low abundance conformers [40]. With a differential mobility analyzer, Ude et al. measured mobilities of ammoniated PEG over a wide range of m/z and showed general trends in ion conformation as a function of molecular weights and charge states [41]. These results indicate that the major peak in each PEG CV scan corresponds to a single gas-phase structure or unresolved population of structures.
Fig. 1.
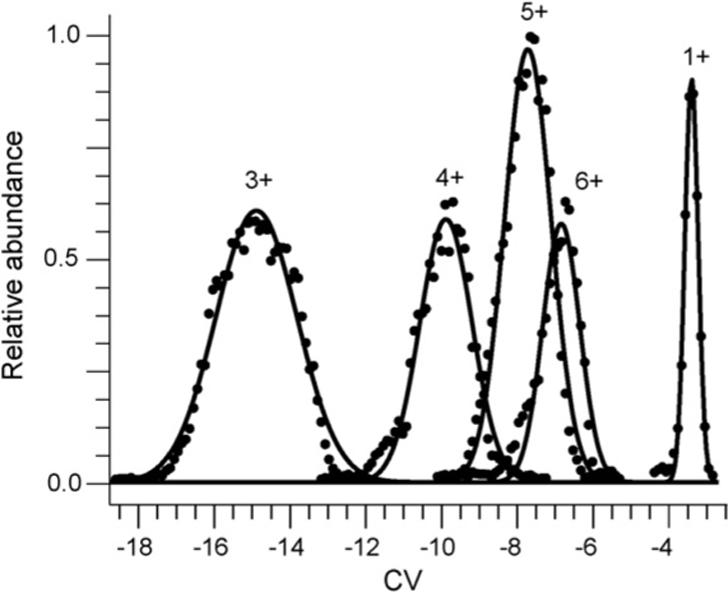
FAIMS CV scans of protonated PEG 1+ formed by ESI from a 1.0 × 10⁻⁴ M PEG 600 in 49.5/49.5/1%, by volume, water/methanol/acetic acid solution and protonated PEG 3+ through 6+ from a 1.0 × 10⁻⁴ M PEG 3400 solution in 49.5/49.5/1%, by volume, water/methanol/acetic acid. The solid lines are the best fit Gaussian distributions to the experimental data. Data for the 2+ and 7+ significantly overlap those for the 5+ and 6+, respectively, and were omitted for clarity.
To characterize the peaks observed in CV scans of PEG ions for which a single conformer or family of unresolved conformers are indicated, a Gaussian distribution is fit to the major peak for each PEG n-mer. The CV value of maximum ion transmission and the width for the PEG CV scan peaks are determined from the center and width (b in Eq. (1) and c in Eq. (2)) of the Gaussian distribution fitted to each PEG CV scan peak. Peaks corresponding to the 3+ charge state with masses between 2800 and 3600 Da clearly have shoulders indicating the presence of multiple unresolved conformers (data not shown). These data were excluded from further analysis. In general, the peaks can be accurately fit by a Gaussian distribution; the R2 error in the fit is less than 0.97 in most cases. The width of the peaks in CV scans increases as the magnitude of compensation voltage for ion transmission increases (Fig. 1). Guevremont and coworkers observed similar results for a mixture of five amino acids and suggested that the increase in CV scan peak widths is due to the increased ion focusing for ions transmitted through the FAIMS device with increased magnitude of compensation voltage [22,24].
3.2. Modeling peak width
To better characterize the relationship between peak width and CV, the widths and CV values of maximum ion transmission were determined for 280 protonated PEG ions from PEG 600, 3400, and 4600. These data show a linear relationship for peak width versus CV with a slope of −0.10 and an R2 error of 0.78 (Fig. 2).
Fig. 2.
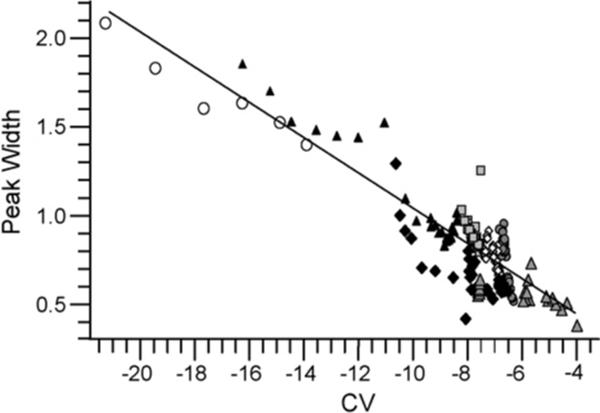
The peak widths of Gaussian distributions as a function of CV for PEG 1+ (grey filled triangles), 2+ (solid diamonds), 3+ (open circles), 4+ (black filled triangles), 5+ (squares), 6+ (open diamonds), and 7+ (filled circles). The trend line is calculated using linear regression of all plotted PEG peak width data.
To determine if there is a correlation between peak width and m/z, peak widths for charge states 1+ to 7+ from PEG 600, 3400, and 4600 are plotted versus m/z in Fig. 3. Peak widths ranged from 0.4 to 2.2 V for ions spanning a m/z range from 300 to 1350 with no consistent trend. However, peaks for PEG 3+ and some 4+ charge states are significantly wider than those of other charge states. A plot of m/z versus CV values for maximum ion transmission (Fig. 4) show that the PEG 3+ and 4+ ions that have wider peaks (m/z 850−965) are transmitted through the FAIMS device at more negative CV values than those for the other PEG ions. Thus, the larger peak width of these ions correlates to the CV value of ion transmission, not m/z.
Fig. 3.
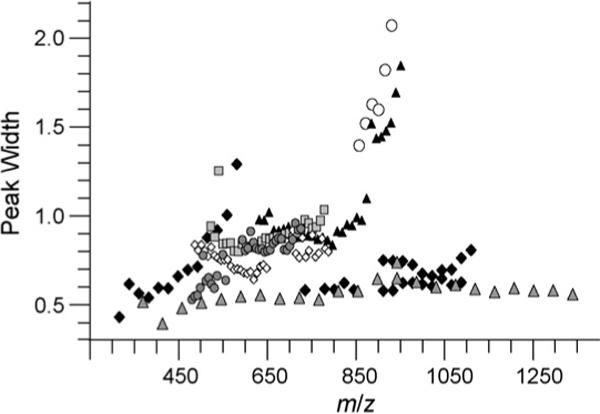
The peak widths of Gaussian distributions as a function of m/z for PEG 1+ (grey filled triangles), 2+ (solid diamonds), 3+ (open circles), 4+ (black filled triangles), 5+ (squares), 6+ (open diamonds), and 7+ (filled circles).
Fig. 4.
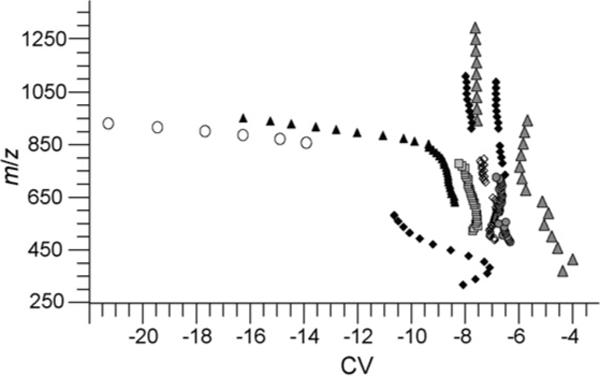
The m/z of PEG ions as a function of CV of ion transmission for PEG 1+ (grey filled triangles), 2+ (solid diamonds), 3+ (open circles), 4+ (black filled triangles), 5+ (squares), 6+ (open diamonds), and 7+ (filled circles).
It is likely that the different trend in transmission through FAIMS observed for these larger 3+ and 4+ ions is due to a difference in the gas-phase conformers of these ions compared to the other PEG ions in this study. Bowers and coworkers found that the cross-sections of singly cationized PEG ions increase linearly with molecule size [36,39]. For ammoniated PEG ions, Ude et al. found that the conformation of very low charge state ions approached a limit corresponding to an “almost spherical” shape, whereas the conformation of highly charged ions corresponded to a more stretched linear structure [41]. In between the two limits, both intermediate and transition structures were observed [41]. The PEG ions in the FAIMS studies are protonated and the charge density of the ions corresponds to the range of “stretched” structures observed for the ammoniated species [41] with the exception of the high mass 3+ and 4+ and the low mass 2+ charge states. For the 3+ and 4+ charge states, the charge density corresponds to the transition to partially folded structures that Ude et al. determined for the ammoniated species [41]. The differential mobility measured by FAIMS is significantly larger for these transition structures, which may be the result of higher conformational flexibility. The charge density for the 2+ ions spans the range corresponding to the “stretched” and “almost spherical” structures for ammoniated species [41]. The presence of different conformer types may explain the trend in CV versus m/z for some of these ions.
The peak widths for a single conformer type in the CV scans do not correlate with m/z but do correlate with the magnitudes of the CV value. Using the CV versus peak width trend, the intrinsic peak width of a single conformer population at a given compensation voltage with the parameters used in this experi- ment can be determined. The minimum number of conformers present in a CV scan for which multiple unresolved conformers are present can be estimated by determining the minimum number of Gaussian distributions, with peak widths constrained by the peak width versus CV relationship, required to fit the CV data.
3.3. FAIMS of lysozyme
ESI mass spectra of lysozyme from a buffered, aqueous solution results in two dominant charge states, 7+ and 8+ (Fig. 5a), whereas 9+ to 12+ charge states are produced from water/methanol/acetic acid solutions that contain DTT (Fig. 5b). ESI mass spectra from denaturing solutions with and without the reducing agent DTT had no significant differences in either the charge state distribution or the extent of the reduction indicating that the addition of DTT has little impact on lysozyme conformations or disulfide bonds when the solutions are at room temperature. In the ESI mass spectra obtained from heated water/methanol/acetic acid solutions without DTT (Fig. 5c), the high charge states are more abundant and the charge state distribution is bimodal suggesting the presence of two or more populations of conformers in solution. This result is consistent with slightly more unfolded protein conformations being populated at high temperatures. The lack of additional charges states in the distributions suggests that the conformations accessible to the protein are similar in the two solutions. Water loss is observed for some fraction of the ions formed from heated solutions.
Fig. 5.
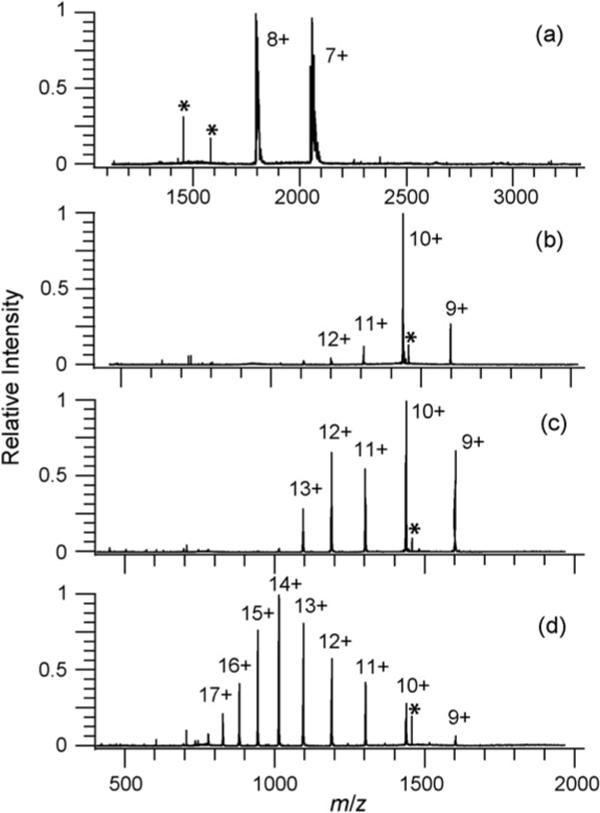
ESI mass spectra of 3.3 × 10⁻⁵ M lysozyme from (a) a 200 mM ammonium bicarbonate aqueous solution, (b–d) 33.2/66.5/0.3%, by volume, water/methanol/acetic acid solution with: (b) DTT at 20 °C, (c) 30 min at 100 °C, and (d) both DTT and 30 min at 100 °C. The mass of the ions formed from solutions with DTT and 30 min at 100 °C (d) indicates that all four disulfide bonds are reduced. Less than 10% reduction of a single disulfide bond was detected in ESI mass spectra from the other solutions (a–c). Adducts in (a) corresponding to attachment of sodium and ammonia are observed for both the 7+ and 8+ change states formed from buffered solutions. Asterisk (*) indicates instrumental noise peaks.
Lysozyme has four disulfide bonds which can be reduced by a combination of adding a reducing agent, such as DTT, and heating the solution (Fig. 5d) [42]. Both heating the solution and the presence of a reducing agent are required to reduce the disulfide bonds in lysozyme. No detectable change in mass is observed when only the reducing agent is present (Fig. 5b) or when the solution is heated without the reducing agent (Fig. 5c). By fitting the isotope distributions, we conclude that less than 10% of the lysozyme ions have a single disulfide bond reduced under these conditions. In contrast, ESI mass spectra of lysozyme from heated solutions that have DTT result in ions that are fully reduced (less than 20% of the population has a single disulfide bond intact). These ions have the highest charge states indicating that they have the most extended conformations.
CV scans of the 7+ and 8+ charge states formed from the buffered aqueous solution result in a single peak (Fig. 6). For 9+ and 10+ charge states formed from a water/methanol/acetic acid solution with DTT at room temperature (fully oxidized), there is a single peak with a broad shoulder for each (Fig. 6). Similar CV scans for the 9+ and 10+ are obtained for the heated water/methanol/acetic acid solution without the reducing agent (data not shown). This indicates that either heating the solution or adding the reducing agent alone has little effect on the gas-phase conformations of lysozyme. CV scans for the 10+ through 16+ charge states formed from a lysozyme solution with reduced disulfide bonds have broadened peaks or shoulders indicating the presence of two or more conformers for each, whereas the peak for the 17+ charge state is narrower suggesting a single dominant conformer (Fig. 7).
Fig. 6.
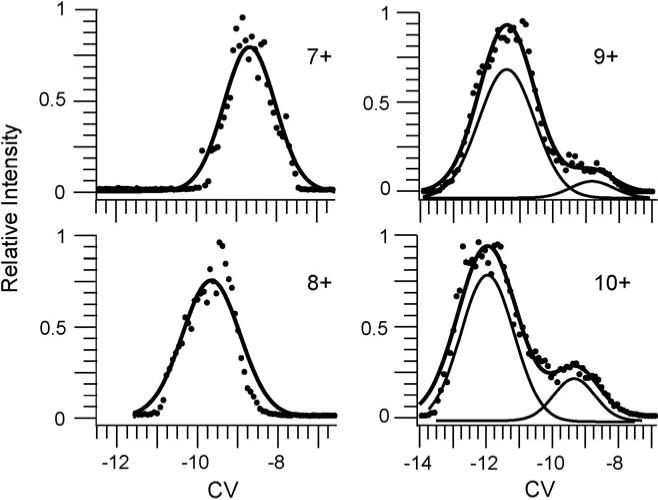
CV scans for fully oxidized lysozyme 7+ to 10+ charge states formed by ESI from either a 200 mM ammonium bicarbonate aqueous solutions (7+ and 8+) or a 33.2/66.5/0.3%, by volume, water/methanol/acetic acid solution with 2.0 mM DTT reducing agent added (9+ and 10+) (no reduced lysozyme present). For the 7+ and 8+ a single Gaussian distribution (solid line) fit the CV data. The sum of two Gaussian distributions (solid line) fit the CV data for 9+ and 10+. The individual Gaussian distributions (thin solid lines) that make up the total fit for the 9+ and 10+ are plotted lower for clarity.
Fig. 7.
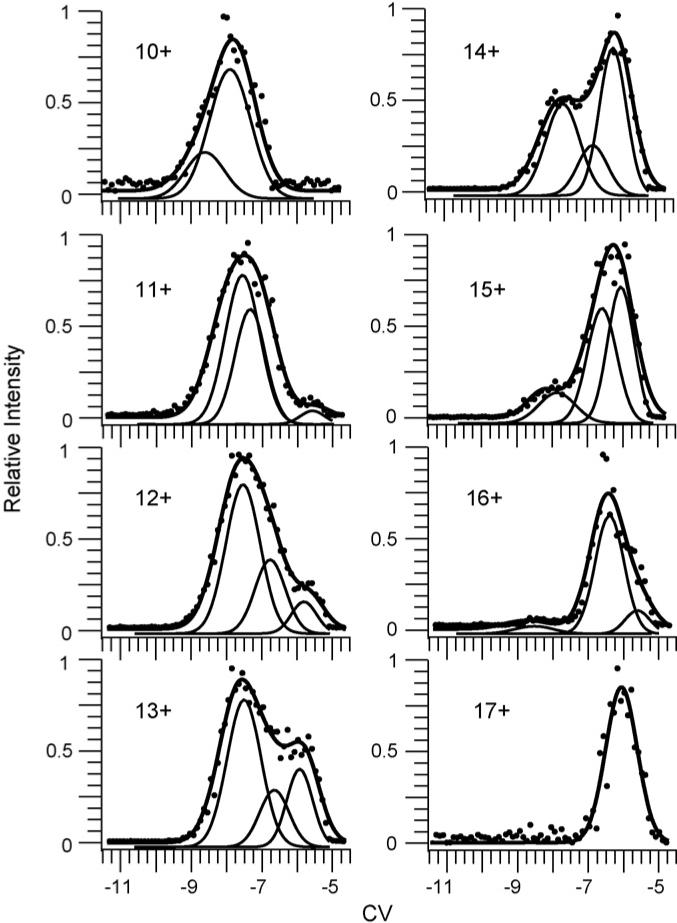
CV scans for fully reduced lysozyme 10+ through 16+ formed from 33.2/66.5/0.3%, by volume, water/methanol/acetic acid solution with DTT and heated to 100 °C for 30 min. The sum of two Gaussian distributions fit the CV data for 10+. For the 11+ to 16+, three Gaussian distributions fit the CV data and a single Gaussian distribution fit to the CV data for 17+ (solid lines). Individual Gaussian distributions (thin solid lines) used in the sum for 10+ through 16+ are plotted lower for clarity.
3.4. Gas-phase lysozyme conformations
The minimum number of conformers that constitute a FAIMS CV peak is estimated by determining the minimum number of Gaussian distributions required to fit the data. The peak widths of the Gaussian distributions are determined using the relationship between peak width and CV value determined from the PEG data. For these PEG data, the peak widths depend strongly on compensation voltage but not m/z, charge state, or molecular weight. This suggests that the fitting parameters determined from the PEG data should be applicable to the lysozyme data as well.
The peaks for the 7+ and 8+ charge states formed from buffered aqueous solutions can be accurately fit by a single Gaussian distribution indicating that a single conformer or family of unresolved conformers is transmitted through the FAIMS device for these charge states (Fig. 6). Two Gaussian distributions are required to fit the data for the 9+ and 10+ charge states formed from the unheated denaturing solution indicating the presence of two partially resolved conformers, or families of conformers (Fig. 6).
For the reduced lysozyme 11+ through 16+, three Gaussian distributions are required to fit the data indicating the presence of at least three conformers for each of these charge states (Fig. 7). It is possible that the low abundance conformers may correspond to the small fraction of the population that has a single disulfide bond intact (<20% overall abundance). The use of FAIMS to separate populations with differing numbers of disulfide bonds intact is currently under investigation. Two Gaussian distributions are required to fit the 10+ charge state, indicating two conformers in the ion populations of these charge states (Fig. 7). The 17+ has one conformer in the ion population as indicated by the single Gaussian distribution required to fit the observed CV scan data (Fig. 7). The charge state, CV, and relative percentage of the conformers, formed from different solutions, as determined by the Gaussian fitting are summarized in Table 1.
Table 1.
The CV of maximum ion transmission, peak width, and relative abundance of the Gaussians used to fit the CV scans of charge states of oxidized and reduced lysozyme formed from solution consisting of 3.3 × 10⁻⁵ M lysozyme in 33.2/66.5/0.3%, by volume, water/methanol/acetic acid with DTT at room temperature and heated to 100 °C for 30 min, respectively
| Charge state | CV (V) | FWHM (V) | Relative abundance (%) | |
|---|---|---|---|---|
| Oxidized (disulfide intact) | 9+ | −11.4 | 1.86 | 89 |
| −8.8 | 1.43 | 11 | ||
| 10+ | −12.1 | 2.02 | 78 | |
| −9.4 | 1.52 | 22 | ||
| Reduced (disulfide reduced) | 10+ | −7.7 | 1.24 | 74 |
| −8.8 | 1.43 | 26 | ||
| 11+ | −7.1 | 1.12 | 41 | |
| −8.0 | 1.27 | 54 | ||
| −5.6 | 0.90 | 5 | ||
| 12+ | −6.9 | 1.12 | 29 | |
| −7.8 | 1.26 | 59 | ||
| −5.8 | 0.93 | 12 | ||
| 13+ | −6.7 | 1.09 | 20 | |
| −7.8 | 1.24 | 52 | ||
| −5.9 | 0.95 | 28 | ||
| 14+ | −6.8 | 1.10 | 17 | |
| −7.8 | 1.26 | 32 | ||
| −6.1 | 0.98 | 51 | ||
| 15+ | −6.6 | 1.07 | 40 | |
| −8.1 | 1.32 | 11 | ||
| −6.0 | 0.96 | 49 | ||
| 16+ | −6.6 | 1.06 | 79 | |
| −8.8 | 1.43 | 5 | ||
| −5.6 | 1.43 | 16 | ||
| 17+ | −6.1 | 0.98 | 100 |
CV scans for lysozyme 10+ formed from the same solution containing DTT, but with one solution at 20 °C (fully oxidized) and one heated to 100 °C for 30 min (fully reduced) are compared in Fig. 8. The fit to the oxidized form indicates the presence of two conformers that are partially resolved by FAIMS. The fit to the reduced form also indicates the presence of two conformers that make up the broadened peak in the FAIMS data. The CV values for the reduced form (Fig. 8b) are less negative than those of the oxidized form (Fig. 8a). With bovine ubiquitin ions for which collisional cross-section measurements of FAIMS separated conformers have been performed [45], more compact or folded conformers are transmitted at more negative CV values. This is consistent with extended conformers being produced from the solution in which the disulfide bonds are reduced.
Fig. 8.
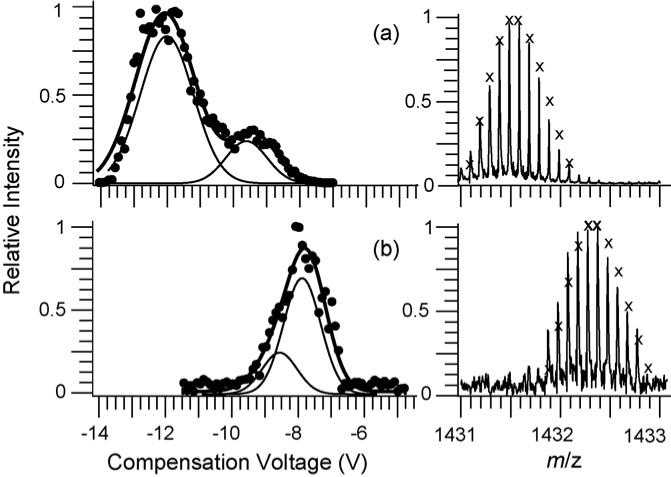
CV scans for: (a) fully oxidized and (b) fully reduced lysozyme 10+ from 33.2/66.5/0.3%, by volume, water/methanol/acetic acid solution. The summed Gaussian distribution (solid line) for both scans is comprised of two individual Gaussian distributions (thin solid lines) which are individually plotted lower for clarity. Partial mass spectra (right) show isotope distributions (calculated distributions indicated by “×”) for the 10+ change state indicating an 8 Da mass change upon reduction of the four disulfide bonds.
4. Discussion
In a buffered aqueous solution, a single dominant conformation is expected. ESI spectra obtained from this solution results in just two charge states, the 7+ and 8+, consistent with a compact conformation in solution. In the gas phase, a single conformer or family of unresolved conformers were identified for these two charge states. For solutions that contain methanol and acetic acid, more direct comparisons can be made to previous drift tube IMS [28] and proton-transfer reactivity [42] measurements in which denaturing solutions were also used, although the exact compositions differed in each of these experiments. For oxidized lysozyme 9+ and 10+, a dominant compact structure (more negative CV) is observed. For both charge states, the presence of a less abundant more extended conformer is indicated, with the abundance of this more extended conformer greater for the 10+ than for the 9+ consistent with more Coulomb repulsion in the former ion. Comparisons of CV values measured for the same ion formed from different solutions is problematic because the gas composition that flows through the FAIMS device is slightly different as a result of volatilization of the solvent upon ESI; different gas-phase compositions can change the differential mobility of an ion [32,33]. However, the data for the oxidized versus reduced ions should be directly comparable because the solution compositions were identical and therefore the composition of the carrier gas was the same; only the temperature of the solution was changed. Nano-ESI of solutions at different temperatures does not appear to affect the temperature of the gas inside the FAIMS device.
Proton-transfer reactivity experiments by Gross et al. indicated the presence of two conformers of oxidized lysozyme for the 9+ and one for the 10+ formed directly from solution, but a second 10+ conformer was produced by charge stripping higher charge state ions [42]. From ion mobility experiments done in a drift tube, Valentine et al. also observed a dominant peak corresponding to a largely folded conformation for both the 9+ and 10+ charge states with a shoulder indicating the presence of a less compact minor conformer [28]. As observed with FAIMS, the minor conformer with the larger cross-section is more abundant for the 10+ charge state. Using higher injection voltages into the drift tube, which caused collisional activation and subsequent unfolding to occur, a total of four different conformers of each of these charge states were observed [28]. These conformers ranged between highly folded, with cross-sections about 200Å2 larger than those calculated from the crystal structure to partially unfolded structures with a cross-section about 600Å2 larger than that of the crystal structure [28].
For the fully reduced lysozyme, a single largely unfolded structure was observed for the highest charge state (17+) formed directly by ESI. A transition from largely unfolded to more folded structures (more negative CV) as the charge state decreases from 16+ to 10+ is observed with FAIMS, with evidence for several intermediate structures present for each of these charge states. In contrast, only a single extended conformer was identified for each of the 13+ to 15+ charge states from proton-transfer reactivity measurements, but 1, 3, and 2 conformers were identified for the 10+, 11+, and 12+ charge states, respectively. Drift tube IMS studies indicated a single conformer for the 10+ to 18+, and also showed a progression from more extended to partially folded structures with decreasing charge state. These latter experiments were done with high injection voltages which may have resulted in significant unfolding of the original starting structures.
For the 10+ charge state of oxidized and reduced lysozyme formed from identical solution compositions, the FAIMS data indicate the presence of two conformers for each, but these conformations do not overlap, i.e., both conformers of the oxidized form have more negative CV values indicating that these ions are more compact. This is consistent with results from both drift tube ion mobility and proton-transfer reactivity experiments that also indicate that the oxidized and reduced conformers do not overlap in overall cross-section or shape.
Although the general trends in these data are consistent with what has been measured previously, more direct comparisons are made difficult because different solution conditions were used in each of these experiments. In addition, the FAIMS separations probe different or additional features of the ion population than either collision cross-section or proton-transfer reactivity measurements alone [44].
5. Conclusions
Low molecular weight PEG appears to be a useful standard for producing predominantly a single conformer (or a family of indistinguishable conformers) in the protonated form. The 3+ and 4+ charge states of higher molecular weight PEG ions have notably different sensitivity to the FAIMS separations which may reflect transitional structures of these ions. From FAIMS of these ions, the relationship between peak shape, width, and various experimental parameters was determined. Peaks in the CV data can be accurately fit to a Gaussian; there is linear relationship between CV value and peak width, but not m/z (for a given conformer type) consistent with earlier studies that indicate FAIMS separations are largely orthogonal to m/z [44]. From these relationships, broader FAIMS peaks resulting from unresolved protein conformers can be deconvoluted.
These results also indicate that FAIMS data could be more efficiently acquired by using a linear ramp in CV step size rather than a constant step size done conventionally. A linear ramp in CV step size would result in peaks of nearly equal width as a function of scan time. This is analogous to the use of temperature ramps in gas chromatography which make possible improved separations with less analysis time. The use of a linear ramp in CV step size to improve data acquisition efficiency in currently under investigation.
For lysozyme, the FAIMS data indicate just a single gas-phase structure for low charge state ions formed from buffered aqueous solutions, and also a single conformer for the most highly charged ion (17+) formed from heated denaturing solutions in which all four disulfide bonds are reduced. Results for lower charge state ions from this latter solution indicate the presence of multiple conformers. The changes in CV values for reduced lysozyme ions are consistent with a gradual change from more extended to more compact conformations with decreasing charge state. Results for the 10+ charge state formed from identical solutions, but one which is heated and lysozyme is fully reduced clearly shows evidence for a total of four different conformers, with the two most unfolded conformers corresponding to the fully reduced ions. Although the peak width depends on several experimental parameters, the use of PEG as a calibrant appears to provide reliable data that can be used for fitting protein data as well.
Acknowledgments
The authors are grateful to Professor Donald F. Hunt for his pioneering contributions to mass spectrometry including innovations in methods, instrumentation, and biomedical applications. We also thank Thermo Electron Corporation for the loan of the Ionalytics Selectra, David E. Garcia for experimental assistance with data acquisition, and NIH for generous funding (R01 GM064712-05).
References
- 1.Smith RD. Trends Biotechnol. 2002;20:S3. doi: 10.1016/s1471-1931(02)00197-0. [DOI] [PubMed] [Google Scholar]
- 2.Washburn MP, Wolters D, Yates JR. Nat. Biotechnol. 2001;19:242. doi: 10.1038/85686. [DOI] [PubMed] [Google Scholar]
- 3.Shvartsburg AA, Tang K, Smith RD. J. Am. Soc. Mass Spectrom. 2005;16:2. doi: 10.1016/j.jasms.2004.09.009. [DOI] [PubMed] [Google Scholar]
- 4.Valentine SJ, Kulchania M, Barnes CAS, Clemmer DE. Int. J. Mass Spectrom. 2001;212:97. [Google Scholar]
- 5.Lee YJ, Hoaglund-Hyzera CS, Barnes CAS, Hilderbrand AE, Valentine SJ, Clemmer DE. J. Chromatogr. B. 2002;782:343. doi: 10.1016/s1570-0232(02)00569-x. [DOI] [PubMed] [Google Scholar]
- 6.Myung S, Lee YJ, Moon MH, Taraszka J, Sowell R, Koeniger S, Hilderbrand AE, Valentine SJ, Cherbas L, Cherbas P, Kaufmann TC, Miller DF, Mechref Y, Novotny MV, Ewing MA, Sporleder CR, Clemmer DE. Anal. Chem. 2003;75:5137. doi: 10.1021/ac030107f. [DOI] [PubMed] [Google Scholar]
- 7.Koeniger SL, Valentine SJ, Myung S, Plasencia M, Lee YJ, Clemmer DE. J. Proteome Res. 2005;4:25. doi: 10.1021/pr049877d. [DOI] [PubMed] [Google Scholar]
- 8.Taraszka JA, Gao XF, Valentine SJ, Sowell RA, Koeniger SL, Miller DF, Kaufman TC, Clemmer DE. J. Proteome Res. 2005;4:1238. doi: 10.1021/pr050037o. [DOI] [PubMed] [Google Scholar]
- 9.Taraszka JA, Kurulugama R, Sowell RA, Valentine SJ, Koeniger SL, Arnold RJ, Miller DF, Kaufman TC, Clemmer DE. J. Proteome Res. 2005;4:1223. doi: 10.1021/pr050038g. [DOI] [PubMed] [Google Scholar]
- 10.Moon MH, Myung S, Plasencia M, Hilderbrand AE, Clemmer DE. J. Proteome Res. 2003;2:589. doi: 10.1021/pr034018v. [DOI] [PubMed] [Google Scholar]
- 11.Sowell RA, Koeniger SL, Valentine SJ, Moon MH, Clemmer DE. J. Am. Soc. Mass Spectrom. 2004;15:1341. doi: 10.1016/j.jasms.2004.06.014. [DOI] [PubMed] [Google Scholar]
- 12.Baker ES, Bernstein SL, Bowers MT. J. Am. Soc. Mass Spectrom. 2005;16:989. doi: 10.1016/j.jasms.2005.03.012. [DOI] [PubMed] [Google Scholar]
- 13.Gidden J, Ferzoco A, Baker ES, Bowers MT. J. Am. Chem. Soc. 2004;126:15132. doi: 10.1021/ja046433+. [DOI] [PubMed] [Google Scholar]
- 14.Wyttenbach T, Bowers MT. Mod. Mass Spectrom. 2003;225:207. [Google Scholar]
- 15.Wyttenbach T, Bowers MT. Top. Curr. Chem. 2003;225:207. [Google Scholar]
- 16.Gidden J, Bowers MT. Eur. Phys. J. D. 2002;20:409. [Google Scholar]
- 17.Kinnear BS, Hartings MR, Jarrold MF. J. Am. Chem. Soc. 2001;123:5660. doi: 10.1021/ja004196e. [DOI] [PubMed] [Google Scholar]
- 18.Kohtani M, Jones TC, Schneider JE, Jarrold MF. J. Am. Chem. Soc. 2004;126:7420. doi: 10.1021/ja048766c. [DOI] [PubMed] [Google Scholar]
- 19.Koeniger SL, Merenbloom SI, Clemmer DE. J. Phys. Chem. B. 2006;110:7017. doi: 10.1021/jp056165h. [DOI] [PubMed] [Google Scholar]
- 20.Counterman AE, Clemmer DE. J. Phys. Chem. B. 2004;108:4885. [Google Scholar]
- 21.Purves RW, Guevremont R. Anal. Chem. 1999;71:2346. doi: 10.1021/ac981380y. [DOI] [PubMed] [Google Scholar]
- 22.Guevremont R. J.Chromatogr. A. 2004;1058:3. [PubMed] [Google Scholar]
- 23.Purves RW, Guevremont R, Day S, Pipich CW, Matyjaszczyk MS. Rev. Sci. Instrum. 1998;69:4094. [Google Scholar]
- 24.Guevremont R, Purves RW. Rev. Sci. Instrum. 1999;70:1370. [Google Scholar]
- 25.Purves RW, Barnett DA, Guevremont R. Int. J. Mass Spectrom. 2000;197:163. doi: 10.1002/1096-9888(200008)35:8<976::AID-JMS25>3.0.CO;2-Q. [DOI] [PubMed] [Google Scholar]
- 26.Dugourd P, Hudgins RR, Clemmer DE, Jarrold MF. Rev. Sci. Instrum. 1997;68:1122. [Google Scholar]
- 27.Mason EA, McDaniel EW. Transport Properties of Ions in Gases. Wiley; New York: 1988. [Google Scholar]
- 28.Valentine SJ, Anderson JG, Ellington AD, Clemmer DE. J. Phys. Chem. B. 1997;101:3891. [Google Scholar]
- 29.Guevremont R, Purves RW. J. Am. Soc. Mass Spectrom. 2005;16:349. doi: 10.1016/j.jasms.2004.11.013. [DOI] [PubMed] [Google Scholar]
- 30.Guevremont R, Thekkadath G, Hilton CK. J. Am. Soc. Mass Spectrom. 2005;16:948. doi: 10.1016/j.jasms.2005.03.001. [DOI] [PubMed] [Google Scholar]
- 31.Shvartsburg AA, Tang KQ, Smith RD. J. Am. Soc. Mass Spectrom. 2004;15:1487. doi: 10.1016/j.jasms.2004.06.018. [DOI] [PubMed] [Google Scholar]
- 32.Shvartsburg AA, Tang K, Smith RD. Anal. Chem. 2004;76:7366. doi: 10.1021/ac049299k. [DOI] [PubMed] [Google Scholar]
- 33.Barnett DA, Ells B, Guevremont R, Purves RW, Viehland LA. J. Am. Soc. Mass Spectrom. 2000;11:1125. doi: 10.1016/S1044-0305(00)00187-2. [DOI] [PubMed] [Google Scholar]
- 34.Barnett DA, Purves RW, Ells B, Guevremont R. J. Mass Spectrom. 2000;35:976. doi: 10.1002/1096-9888(200008)35:8<976::AID-JMS25>3.0.CO;2-Q. [DOI] [PubMed] [Google Scholar]
- 35.Barnett DA, Ells B, Guevremont R, Purves RW. J. Am. Soc. Mass Spectrom. 2002;13:1282. doi: 10.1016/S1044-0305(02)00527-5. [DOI] [PubMed] [Google Scholar]
- 36.Gidden J, Wyttenbach T, Jackson AT, Scrivens JH, Bowers MT. J. Am. Chem. Soc. 2000;122:4692. [Google Scholar]
- 37.Wyttenbach T, von Helden G, Bowers MT. Int. J. Mass Spectrom. 1997;165:377. [Google Scholar]
- 38.von Helden G, Wyttenbach T, Bowers MT. Science. 1995;267:1483. doi: 10.1126/science.267.5203.1483. [DOI] [PubMed] [Google Scholar]
- 39.von Helden G, Wyttenbach T, Bowers MT. Int. J. Mass Spectrom. Ion Process. 1995;146:349. [Google Scholar]
- 40.Robinson EW, Garcia DE, Leib RD, Williams ER. Anal. Chem. 2006;78:2190. doi: 10.1021/ac051709x. [DOI] [PMC free article] [PubMed] [Google Scholar]
- 41.Ude S, de la Mora JF, Thomson BA. J. Am. Chem. Soc. 2004;126:12184. doi: 10.1021/ja0381306. [DOI] [PubMed] [Google Scholar]
- 42.Gross DS, Schnier PD, Rodriguez-Cruz SE, Fagerquist CK, Williams ER. Proc. Natl. Acad. Sci. U.S.A. 1996;93:3143. doi: 10.1073/pnas.93.7.3143. [DOI] [PMC free article] [PubMed] [Google Scholar]
- 43.Jurchen JC, Williams ER. J. Am. Chem. Soc. 2003;125:2817. doi: 10.1021/ja0211508. [DOI] [PMC free article] [PubMed] [Google Scholar]
- 44.Robinson EW, Williams ER. J. Am. Soc. Mass Spectrom. 2005;16:1427. doi: 10.1016/j.jasms.2005.04.007. [DOI] [PMC free article] [PubMed] [Google Scholar]
- 45.Purves RW, Barnett DA, Ells B, Guevremont R. J. Am. Soc. Mass Spectrom. 2000;11:738. doi: 10.1016/S1044-0305(00)00136-7. [DOI] [PubMed] [Google Scholar]


