Abstract
To understand the properties of materials, their phase structure must be established. It has been difficult in previous work to visualize the heterogeneous cross-linked structure of methacrylate-based networks. In this work, nano-sized phases with worm-like features were detected in the surfaces of model crosslinked methacrylate copolymer containing hydrophobic/hydrophilic co-mono-mers using tapping mode atomic force microscopy/phase imaging technique. The effects of different surface-contact covers on the height and phase-contrast images of model resin surfaces were also studied. Based on the experimental data, the identification of phase domains was proposed.
Keywords: nano-patterning, cross-linked methacrylate copolymer, atomic force microscopy (AFM), phase imaging, phase separation
INTRODUCTION
Cross-linked polymers formed by free radical polymerization of multi-methacrylate monomers and oligomers are used in many current and emerging applications, including protective and decorative coatings, contact lenses, optical fiber coatings, dental materials, superabsorbent materials, and hydrogels for biomaterials.1-4 Highly cross-linked networks prepared by free-radical polymerization of multimethacrylates are very heterogeneous due to the formation of microgels (which are regions that have above average cross-linked densities localized around a center of initiation) as well as the presence of regions containing unreacted monomer and hydrophilic oligomers.5 Evidence for spatial heterogeneities in multi-methacrylate systems has been provided by frequency dependent dielectric6,7 and dynamic mechanical measurements.8,9 The spatial heterogeneity exists throughout the polymerization and it is speculated that the final network morphology is the result of agglomeration of the microgels into clusters and connection between the clusters.10,11
It is difficult to correlate a morphologic description with a specific size scale, which relates to the microgels and the degradation-susceptible domains consisting of partially polymerized, low-crosslinked materials. These domains range in size from nanometers to micrometers and it is suspected that these domains are the sites for detrimental interaction between the external environment and the polymer matrix. The mapping and identification of these regions are both scientific and technologic challenges. The subtle variation in local physical properties makes it difficult to resolve these domains using techniques such as scanning electron microscopy (SEM). In the past, analytical techniques such as small-angle X-ray scattering, X-ray photoelectron spectroscopy, neutron scattering, and secondary ionmass spectrometry have been widely used to provide valuable in-depth micro-structural information of polymers.12,13 Real-time proton NMR T2 relaxation analysis was used recently to study the network structure development during cross-linking photopolymerization of polyethylene glycol di-acrylate and its mixture with a mono-functional 2-ethyl-hexyl acrylate.5 The results reveal largely heterogeneous origin of networks which are built up at the intermediate stage of photo-curing. However, these techniques provide limited capability to both visually and qualitatively characterize the domain morphology from the micron to the angstrom scale.
Atomic force microscopy (AFM) used in the tapping mode with phase imaging technique is a powerful analytical tool for studying spatial heterogeneity at the nanometer scale. In tapping mode, the AFM probe oscillates such that there is only intermittent contact between the tip and sample surface. There are two types of tapping-mode images, i.e. one known as the height image is a record of the change in the vertical displacement that is necessary to keep a fixed amplitude (through the feedback loop) and the other image known as the phase image is a record of the change in the oscillator phase lag relative to the cantilever response. This additional imaging capability has provided increased sensitivity to variations of the local viscoelastic properties in heterogeneous systems. Measurements have been performed with tapping mode atomic force micros-copy (TMAFM) at room temperature and have enabled the visualization and identification of nanoscale structure in polymer blends. With the advance of TMAFM, it is possible to provide direct, spatial mapping mechanically in heterogeneous regions, and this technique has been successfully applied to mapping the distribution of polymers in heterogeneous systems such as polymer blends and blockcopolymers,14-18 or mapping the distribution of fillers, such as silica or carbon black, in a polymer matrix.19,20
The objective of this work was to explore the existence of spatial heterogeneity in photopolymerized experimental resins of hydroxylethylmethacrylate (HEMA), 2, 2-bis[4-(2-hydroxy-3-methacryloxypropoxy) phenyl]-propane (BisGMA) and their mixture using TMAFM. HEMA is a mono-methacrylate with low viscosity and hydrophilic monomer, while BisGMA is a cross-linkable dimethacrylate, viscous and hydrophobic in nature. We have recently shown that the photo-curing process of HEMA and BisGMA co-monomers gives rise to a material with two Tg's measured by modulated differential scanning calorimetry, indicating the existence of heterogeneity.21,22 However, much less is known about the morphology of the crosslinked networks containing these hydrophilic and hydrophobic components. In this study, we will investigate the nanostructure of these resins and also will highlight the strengths and limitations of the AFM technique for the study of morphologic and phase features in amorphous crosslinked copolymers.
MATERIALS AND METHODS
The model methacrylate resins consisted of HEMA (Acros Organics, NJ, USA) and/or BisGMA (Polysciences Inc., Washington, PA). The following photoinitiators (all from Aldrich, Milwaukee, WI) were used in this study: camphorquinone (CQ), 2-(dimethylamino) ethyl methacrylate (DMAEMA), ethyl-4-(dimethylamino) benzoate (EDMAB) and diphenyliodonium hexafluorophosphate (DPIHP). The amounts of photosensitizer CQ, co-initiator amine and iodonium salt were fixed at 0.5 mol %, 0.5 mol %, and 1.0 wt %, respectively, with respect to the total amount of monomer. Shaking and sonication were required to yield well-mixed resin solutions. All the materials in this study were used as received.
According to the scheme (shown Fig. 1), The model resins were injected into circular aluminum mold (ID 4.0 mm) and sealed with a cleaned cover glass (Fisherfinest™ Premium, Cat No. 12-548-5A, borosilicate glass). The surface contact covers that were used in this study included cover glass, PELCO® mica disc (TED PELLA, Inc., Redding, CA; Cat No. NC9655734) and plastic slips (Fisherbrand® Microscope cover slips, Cat No. 12-547, PVC). Each specimen was light-cured for 20 s using a curing light (Spectrum® 800, Dentsply, Milford, DE) operated at 550 mW/cm2. After 24 h, the cover slips were carefully peeled off and the cylindrical specimens (4.0 mm diameter × 1.0 mm thickness) were stored in vacuum at ambient temperature for one week before AFM observations. Three type of methacrylate resins were prepared: poly (HEMA), poly (BisGMA) and Poly (HEMA-co-BisGMA) (30/70 by weight) were prepared. At least four specimens that were free of air bubbles were analyzed for each formulation.
Figure 1.
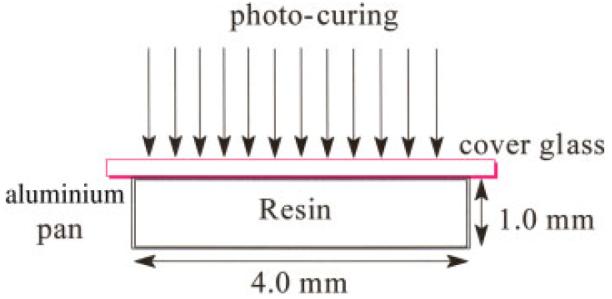
Scheme of sample preparation and photo-polymerization process. [Color figure can be viewed in the online issue, which is available at www.interscience.wiley.com.]
The AFM images were obtained using a Nanoscope IIIa scanning probe microscope (Digital Instruments, Santa Barbara, CA) operated in tapping mode under ambient conditions (24°C ± 2°C, 40% ± 5% RH). Tapping mode etched silicon probes (Prod No.: TESPW, Veeco, Santa Barbara, CA) were used, having a resonant frequency of about 255 KHz. The length and thickness of the probes were 130–140 μm and 3.5–4.5 μm, respectively. Images were recorded in the topographic (height) mode and in the phase mode simultaneously. The set-point amplitude (Asp) used in feedback control was adjusted to 90% of the tip's free amplitude of oscillation (A0). Images of each sample were recorded and analyzed with the Nanoscope 5.30r2 software version. In this study, the roughness values (Ra) of height images and phase-contrast images were analyzed with Nanoscope image processing software and based on a 1 μm × 1 μm scan area. Ra is defined as the mean of the absolute values of the surface deviations measured from the mean plane at z0:
where , Mis the number of height values (nm) obtained from the height image or the number of phase values (degree) obtained from the phase image, zi is the height or phase of the point i. Evaluation of Ra for surfaces under different conditions was used to compare the apparent topography or phase contrast. For all experimental groups, the differences between roughness values were evaluated using analysis of variance (ANOVA), together with the Turkey test at α 5 0.05.
RESULTS AND DISCUSSION
When synthesizing a cross-linked polymer for a specific application, it is important to understand the network formation and the resulting material properties as each application has specific material requirements. The material properties, such as the molecular weight between cross-links, swelling, and diffusion of a solute within its mesh, are all determined by the extent of cross-linking in the network.
In this work, the mixture of hydrophilic and hydrophobic co-monomers (HEMA/BisGMA) with different physicochemical properties was used as the model crosslinked methacrylate copolymer. HEMA can dissolve the comonomer BisGMA in a wide variety of concentrations and reacts with BisGMA in free radical fashion because they both are methacrylates. The heterogeneity if existing within the crosslinked network may come from the incompatibility of two domains, e.g. the poly(HEMA)-rich phase and poly (BisGMA)-rich phase. However, results from previous investigations have suggested that these copolymer chains are distributed uniformly at the micron-level.23 There may be differences in material properties between the densely cross-linked and loosely cross-linked domains. Phase imaging was used to study the potential differences in material properties within this model crosslinked methacrylate copolymer. Phase imaging was conducted during tapping mode AFM operation by monitoring the phase lag between the oscillating detection signals from the photodiode detector. This signal indicates differences in viscoelasticity and/or adhesion across the imaged area.14
Nanophase separation in crosslinked methacrylate copolymer networks
In Figure 2, the representative height images (left) along with the corresponding phase images (right) are shown for model methacrylate resin surfaces light-cured under cover glass. The magnification of these images is indicated by the scan dimension, which is 1 μm. Co-continuous structure was seen in the surfaces of copolymer—poly (HEMA-co-BisGMA). The higher parts in the height image show some corresponding features in the phase-contrast images, which look brighter [Fig. 2(a)]. The size of the worm-like features ranges from 10 ∼ 20 nm based on the phase-contrast images. A similar irregular pattern was noted in the phase images of microphase-separated block copolymers or immiscible polymer blend films.24,25 At a larger scale, similar structures are reported for nucleation growth of polymer blends. Based on previous studies of microphase separation, the hydrophobic BisGMA-rich phase is relatively stiff in comparison with the HEMA-rich phase.26 We propose that the bright phases are associated with the stiff phase in the copolymer network, whereas the dark phases correspond to the soft phase; the soft phase is related to a low degree of cross-linking.
Figure 2.
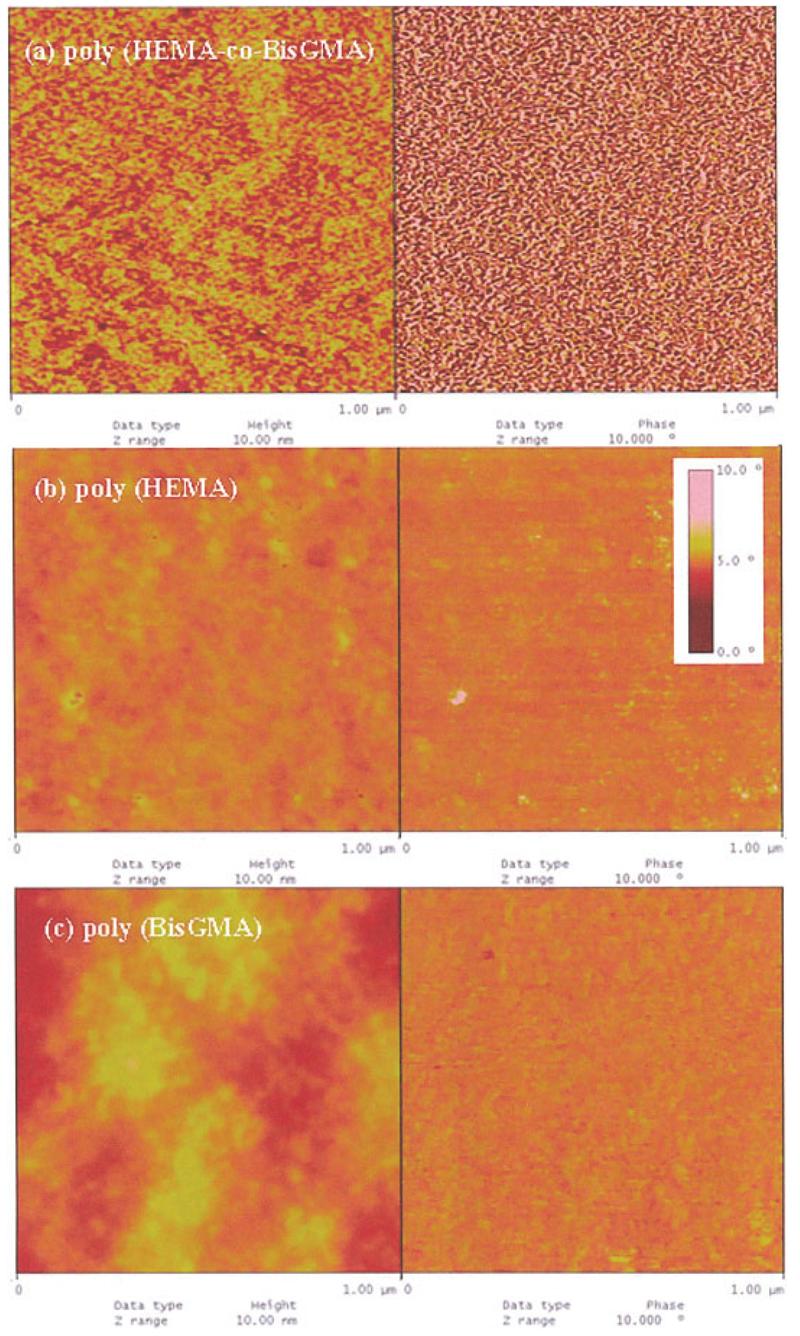
AFM images in height (left-hand side) and phase mode (right-hand side) obtained from different surfaces of model resins (a) poly (HEMA-co-BisGMA); (b) poly (HEMA); and (c) poly (BisGMA). The vertical ranges are 10 nm and 10° for height and phase images, respectively. For ease of comparison, the same vertical scale was used for all images. [Color figure can be viewed in the online issue, which is available at www.interscience.wiley.com.]
With the change of resin formulation from copolymer to homopolymer, the phase-contrast in the two resin surfaces—poly(HEMA) or poly(BisGMA) [Fig. 2(b,c)] was barely discernible. The phase roughness values (Ra) were calculated for the degree of heterogeneity of the two contrasted phases [Fig. 3(a)]. One example of how to calculate the phase-contrast with the image software is shown in Figure 3b. The results indicated that the phase contrast increased dramatically for poly (HEMA-co-BisGMA) resin.
Figure 3.
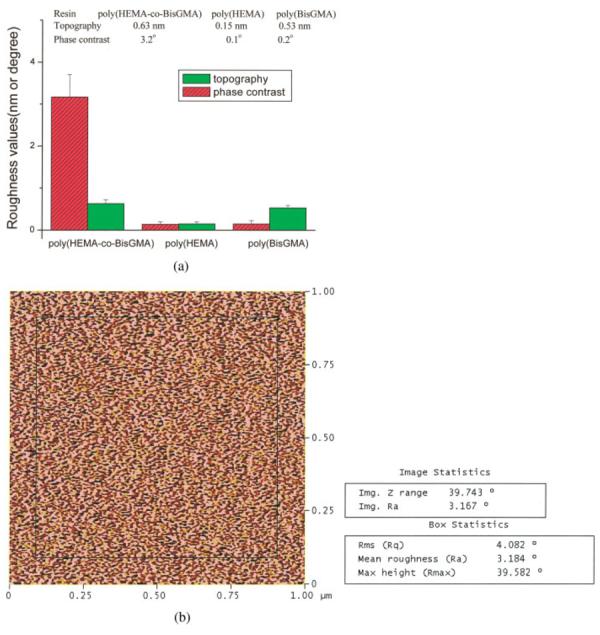
The calculated roughness values from the height and phase contrast images of model resins cured under cover glass (a). One example was shown for the calculation of phase-contrast using the image software (b). The values of mean roughness were used for analysis. [Color figure can be viewed in the online issue, which is available at www.interscience.wiley.com.]
As we know, phases of small dimensions for macromolecules have been known for more than 50 years. But only recently has the term nanophase become more common. There are two basic reasons for nanophase separation in macromolecules23: (1) driven by the thermodynamic tendency of ordering on cooling which is limited kinetically by high viscosity, enhanced by entanglements, such as semicrystalline; (2) consisting of two or more chemically bonded, incompatible segments which have tendencies to phase separate. Usually random amorphous (co)polymers would not show nano-sized heterogeneity, except for two cases: side chain polymers with long alkyl groups could form self-assembled alkyl nanodomains,27,28 or amphilphilic co-networks containing polymer chains with opposite philicity possess nanophase separated morphology.29 To the best of our knowledge, the morphological/phase study of domains within the cross-linked methacrylate copolymer network has not been reported previously. In this investigation, the formation of phase separation may come from the cross-linking polymerization of two co-monomers with different hydrophobicity/hydrophilicity. Interestingly, heterogeneity was not observed in the homopolymer surfaces. There could be compatibility differences between the domains at the nano-level; these compatibility differences may be caused by the heterogeneous distribution of initiation reaction, the difference in photoinitiator solubility, diffusion rate, and monomer viscosity, etc.
Effects of contact material on surface nanophase separation of crosslinked methacrylate copolymer networks
Sample preparation was found to be critical for the AFM observations. It was suspected that the phases of the copolymer might selectively separate depending on the chemical nature of the surface that it contacted. To study this effect on the poly (HEMA-co-BisGMA), cover glass, mica, and PVC films were used as cover materials. (It should be noted that due to oxygen inhibition the specimens would not polymerize adequately if exposed to air.) In Figure 4, three-dimensional height images (left) along with the corresponding phase images (right) are shown for the crosslinked co-polymer surfaces cured under these three different cover materials.
Figure 4.
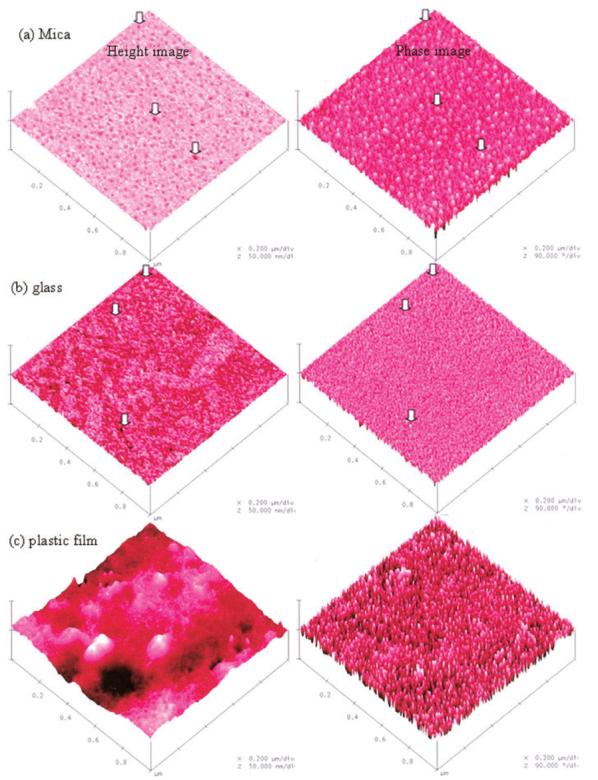
TMAFM images of crosslinked poly (HEMA-co-BisGMA) resin surfaces cured under different surface-contact covers: (a) mica, (b) cover glass, and (c) PVC plastic film. For ease of comparison, the same vertical scale was used, thus making the differences in height and contrast more apparent. [Color figure can be viewed in the online issue, which is available at www.interscience.wiley.com.]
Based on the reported contact angle values30 these cover materials differ in terms of relative hydrophilicity or hydrophobicity. The hydrophilic or hydrophobic properties of a surface are characterized by the static contact angle, measured between a water droplet and a surface. For example, mica has a hydrophilic flat surface with contact angles of 1 ∼ 10°, while the surface of hydrophobic plastic film (PVC) is quite rough with contact angles of 80 ∼ 90°.30 The hydrophobicity order of these three materials is: mica < cover glass < PVC film.
It is interesting to notice that the phase contrast of the copolymer surfaces showed inversion when changing from the hydrophilic to the hydrophobic cover material. The representative height image showed circular pits (marked with arrows in the height image) in isolated regions of the surface of specimens light-cured under mica, and the corresponding circular domains in the phase-contrast image looked brighter [Fig. 4(a)]. On the contrary, bi-continuous structure was shown in the specimens cured under cover glass, and the higher domains are of bright contrast with respect to their surroundings [arrows in Fig. 4(b)]. In the case of PVC films used as the cover material, the height images looked very rough (Ra, ∼4.5 nm), but the phase-contrast images showed the similar pattern as those of the specimens cured under cover glass [Fig. 4(c)]. The above results indicated that the contrast in phase images was due to variations in local mechanical properties, not variations in topography. The phase roughness values (Ra) of phase-contrast images were calculated for the degree of heterogeneity of the two contrasted phases. As shown in Figure 5, the calculated phase-contrast changed from −1.9° to 3.2° and 7.4° with the increase in the hydrophobicity of the cover material.
Figure 5.
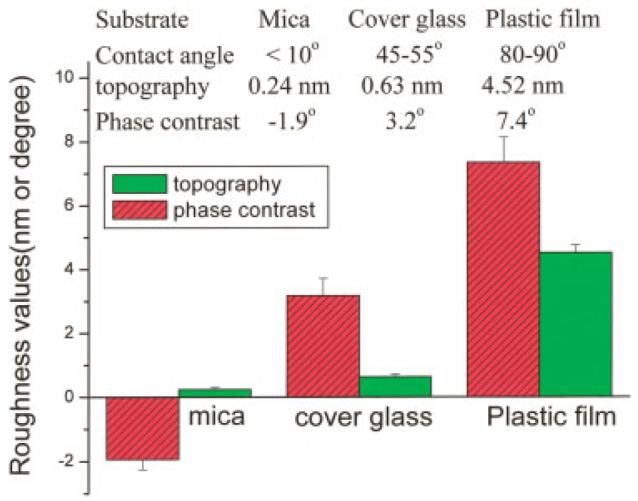
The calculated roughness values obtained from the height and phase contrast images shown in Figure 4. [Color figure can be viewed in the online issue, which is available at www.interscience.wiley.com.]
It should be kept in mind that the surface topography/phase features do not necessarily represent the bulk properties. However, in this investigation, the phase features of smooth sample surface cured under cover glass were supposed to be similar with the bulk samples. It was previously reported that the contact angles of the HEMA and BisGMA based resins were between 37 and 67°.31-33 Thus, the contact angles of cover glass (45 ∼ 55°) are very close to the overall values of the poly (HEMA-co-BisGMA) used in this work. This unique sample preparation technique was based on the selection of a cover material that was neither too hydrophilic nor too hydrophobic. This selection reduced the potential for interference from the cover material on phase formation in the copolymer during the crosslinking reaction.
Certainly, the physical properties of the cover material will influence the morphology and also the phase-contrast images, which could provide useful information on understanding the heterogeneity pattern caused by photo-polymerization. The contrast inversion in the TMAFM images collected from the surfaces contacted with different cover materials could be explained based on the proposed mechanism shown in Figure 6. The contrast reversal of the height and phase images was caused by differences between the interaction of specimens and contact materials. The proposed mechanism suggested that the hydrophilic mica and hydrophobic PVC plastic slip would cause much attraction to the phases with different hydrophobicity/hydrophilicity. The schematic modes of the formation of separated phase domains of the copolymer cured under different materials were developed (Fig. 6). Two different kinds of particles (white and gray) represent the hydrophobic phase and hydrophilic phase, respectively. It should be mentioned that the particles plotted in this scheme do not mean the real shape of contrasted phases. The pictures portrayed that the attraction of the hydrophilic phase to the hydrophilic surface-contact cover caused higher, but soft domains [Fig. 6(a)], however, the attraction of the hydrophobic phase to the hydrophobic cover caused higher and hard domains [Fig. 6(b)]. The hydrophobicity of cover glass is between that of mica and PVC plastic films, the influence of attraction could be much less. Thus cover glass was selected as an optimal cover material for this system due to its smooth surface and appropriate hydrophobicity/hydrophilicity.
Figure 6.
The schematic modes of the formation of separated phase domains of the copolymer cured under different surface-contact covers have been developed. Two different kinds of particles (white and gray) represent the hydrophilic phase and hydrophobic phase, respectively. It should be mentioned that the particles plotted in this scheme do not represent the real shape of contrasted phases. The pictures portrayed that the attraction of the hydrophilic phase to the hydrophilic surface-contact cover caused higher, but soft domains (a), however, the attraction of the hydrophobic phase to the hydrophobic surface-contact cover caused higher and hard domains (b). Thus cover glass was preferred as a suitable cover material because the copolymer surface phases would not be attracted in a very limited manner and thus, would maintain their original state (c).
To understand the properties of materials, their phase structure must be established. Recognizing the existence of phases and their multitude of phase types allows a systematic exploration of a large number of new materials. The morphological/phase observations of the heterogeneity with worm-like features would provide complementary knowledge of the heterogeneous structure of crosslinked methacrylate networks. In addition, this finding could initialize the structure/properties relationship of photopolymerized, crosslinked resins at the nanometer scale. As we know, highly cross-linked copolymer networks are very heterogeneous. It is likely that stress concentration at the boundary of the two contrasted phases is one of the factors contributing to material failure. This means that the more heterogeneous a material is, the more likely it will have a significantly weaker structure in some regions, which could potentially cause premature failure when the material is stressed mechanically and/or chemically. When solvent/water is present during crosslinking polymerization, it is even more crucial to investigate the phase properties of a polymerized resin that exhibits nano- or micro-phase separation.34 It is thought that solvent/water may cause the plasticization of the hydrophilic domains and lower the degree of double-bond conversion and cross-linking. In addition, the photoinitiators might segregate in the presence of water/solvent and could be available primarily to one phase. Further work should be carried out to characterize the nano structure and phases of these resins formed in the presence of water/solvent. Although this study was only focused on the photopolymerized methacrylate networks, the nano-heterogeneity phenomenon should be considered for all the crosslinked resins used in a wide variety of applications. We expect that phase separation effects are of general importance for understanding the properties of crosslinked copolymers.
CONCLUSIONS
In summary, the TMAFM studies have allowed the direct observation of the phase separated worm-like features in the crosslinked methacrylate copolymer resin containing hydrophobic/hydrophilic co-monomers. The brighter features in the phase-contrast images may be associated with the densely cross-linked domains, and the darker features may present loosely cross-linked domains. The hydrophobicity/hydrophilicity of surface contact covers were shown to affect the morphology and the phase images. The phase contrast was found to show inversion when changing the surface contact covers from mica to cover glass and PVC plastic films. Cover glass was found to be an optimal surface contact cover due to its smooth surface and appropriate hydrophobicity. The results from the phase imaging technique strengthen our opinion that the nanophase separation effects are important for understanding the properties of complex, heterogeneous copolymers.
Acknowledgments
This work is a contribution from the UMKC Center for Research on Interfacial Structure & Properties (UMKC-CRISP).
Contract grant sponsor: National Institute of Dental and Craniofacial Research; contract grant number: R01DE14392.
Contract grant sponsor: National Institutes of Health; contract grant number: K25DE015281.
References
- 1.Fouassier JP, Rabek JF. In: Radiation Curing in Polymer Science and Technology. Fouassier JP, Rabek JF, editors. IIV. Elsevier Applied Science; New York: 1993. [Google Scholar]
- 2.Anseth KS, Newman SM, Bowman CN. Adv Polym Sci. 1995;122:177. [Google Scholar]
- 3.Goodner MD, Bowman CN. Chem Eng Sci. 2002;57:887. [Google Scholar]
- 4.Baroli B. J Chem Technol Biotechnol. 2006;81:491. [Google Scholar]
- 5.Litvinov VM, Dias AA. Macromol Symp. 2005;230:20. [Google Scholar]
- 6.Guo Z, Sautereau H, Kranbuehl E. Polymer. 2005;46:12452. [Google Scholar]
- 7.Guo Z, Sautereau H, Kranbuehl E. Macromolecules. 2005;38:7992. [Google Scholar]
- 8.Young JS, Kannurpatti AR, Bowman CN. Macromol Chem Phys. 1998;199:1043. [Google Scholar]
- 9.Cook WD, Forsythe JS, Irawati N, Scott TF, Xia WZ. J Appl Polym Sci. 2003;90:3753. [Google Scholar]
- 10.Kloosterboer JG, Van de Hei GMM, Boots HMJ. Polym Commun. 1984;25:354. [Google Scholar]
- 11.Allen PEM, Bennett DJ, Haglias S, Hounslow AM, Ross GS, Simon GP, Williams DRG, Williams EH. Eur Polym J. 1989;25:785. [Google Scholar]
- 12.McEvoy RL, Krause S, Wu P. Polymer. 1998;39:5223. [Google Scholar]
- 13.Hasegawa H, Hashimoto T. Polymer. 1992;33:475. [Google Scholar]
- 14.Wang Y, Song R, Li YS, Shen JS. Surf Sci. 2003;530:136. [Google Scholar]
- 15.Wang Y, Chan CM, Ng KM, Jiang Y, Li L. Langmuir. 2004;20:8220. doi: 10.1021/la035293z. [DOI] [PubMed] [Google Scholar]
- 16.Leclere P, Lazzaroni R, Bredas JL, Yu JM, Dubois P, Jerome R. Langmuir. 1996;12:4317. [Google Scholar]
- 17.Leclere P, Moineau G, Minet M, Dubois P, Jerome R, Bredas JL, Lazzaroni R. Langmuir. 1999;15:3915. [Google Scholar]
- 18.Leclere P, Rasmont A, Bredas JL, Jerome R, Aime JP, Lazzaroni R. Macromol Symp. 2001;167:117. [Google Scholar]
- 19.Anandhan S, De PP, De SK, Bandyopadhyay S, Bhowmick AK. J Mater Sci. 2003;38:2793. [Google Scholar]
- 20.Surin M, Marsitzky D, Grimsdale AC, Mullen K, Lazzaroni R, Leclere P. Adv Funct Mater. 2004;14:708. [Google Scholar]
- 21.Ye Q, Spencer P, Wang Y, Misra A. J Biomed Mater Res A. 2007;80:342. doi: 10.1002/jbm.a.30890. [DOI] [PMC free article] [PubMed] [Google Scholar]
- 22.Spencer P, Ye Q, Wang Y, Walker Y, Walker MP, Misra A, Marangos O, Kostoryz EL, Melander JR, Gorman N. J Dent Res. 2007;86(special issue):0117. [Google Scholar]
- 23.Chen W, Wunderlich B. Macromol Chem Phys. 1999;200:283. [Google Scholar]
- 24.Rasmont A, Leclere P, Doneux C, Lambin G, Tong JD, Jerome R, Bredas JL, Lazzaroni R. Colloids Surf B: Biointerfaces. 2000;19:381. doi: 10.1016/s0927-7765(00)00146-6. [DOI] [PubMed] [Google Scholar]
- 25.Johnson WC, Wang J, Chen Z. J Phys Chem B. 2005;109:6280. doi: 10.1021/jp045647a. [DOI] [PubMed] [Google Scholar]
- 26.Katz JL, Bumrerraj S, Dreyfuss J, Wang Y, Spencer P. J Biomed Mater Res. 2001;58:366. doi: 10.1002/jbm.1030. [DOI] [PubMed] [Google Scholar]
- 27.Hiller S, Pascui O, Budde H, Kabisch O, Reichert D, Beiner M. New J Phys. 2004;6:1. [Google Scholar]
- 28.Beiner M, Huth H. Nature Mater. 2003;2:595. doi: 10.1038/nmat966. [DOI] [PubMed] [Google Scholar]
- 29.Ivan B, Haraszti M, Erdodi G, Scherble J, Thomann R, Mulhaupt R. Macromol Symp. 2004;6:1. [Google Scholar]
- 30.Mittal KL. Contact Angle, Wettability and Adhesion. Utrecht; The Netherlands: 1993. [Google Scholar]
- 31.Morra M. Dent Mater. 1993;9:375. doi: 10.1016/0109-5641(93)90060-4. [DOI] [PubMed] [Google Scholar]
- 32.Chan K, Gleason KK. Langmuir. 2005;21:8930. doi: 10.1021/la051004q. [DOI] [PubMed] [Google Scholar]
- 33.Matsumae I, Wakasa K, Satou N, Urabe H, Shintani H, Yamaki M. J Mater Sci Mater Med. 1995;11:620. doi: 10.1023/a:1008807300825. [DOI] [PubMed] [Google Scholar]
- 34.Spencer P, Wang Y. J Biomed Mater Res. 2002;62:447. doi: 10.1002/jbm.10364. [DOI] [PubMed] [Google Scholar]


