

Abstract
Comb copolymers comprising a poly(methyl methacrylate) (PMMA) backbone and short, polyethylene oxide (PEO) side chains, PMMA-g-PEO, have been proposed to self-organize at the polymer/water interface, resulting in the quasi-2D confinement of the backbone for chains at the immediate surface of PMMA-g-PEO films (D.J. Irvine et al., Biomacromolecules 2001, 2, 85-94). To directly probe such 2D conformations, combs modified with maleimide groups on the PEO chain ends were blended at 0.5-10 wt% into unmodified PMMA-g-PEO (Mn 142 kg/mol, PDI 3.2, 32 wt% PEO) and cast into films ∼35 nm thick. Films were immersed in aqueous solution to induce orientation of surface molecules, and maleimide-functionalized chains at the film/water interface were labeled with 1.4 nm dia. Au nanoparticles. Transmission electron microscopy (TEM) was then used to trace the 2D trajectories of nanoparticle-decorated chains. The distribution of observed chain lengths was in good agreement with that from gel permeation chromatography. The 2D radius of gyration (Rg) calculated from the observed conformations scaled with number of backbone segments (N) as Rg∼N0.69±0.02. Monte Carlo simulations of a 2D melt of comparable chain length distribution yielded a scaling exponent ν=0.67±0.03, suggesting that the deviation from 2D melt behavior arose from polydispersity.
The confinement of polymer chains to spaces smaller than their bulk dimensions is realized in a variety of systems of scientific and commercial interest1-8. Under these circumstances, the conformations9 and dynamics10 of individual polymer chains may differ greatly from their bulk state. Strategies exploiting such confinement effects have been proposed for creating nanolithographic templates1, separating polyelectrolytes by molecular weight2, and controlling the spatial distribution of surface-bound peptides in order to enhance their bioactivity3-5.
Conformations of polymer chains confined to two dimensions are predicted to depend strongly on polymer chain concentration. Swollen polymer coils in two dimensions have been modeled as self-avoiding random walks, for which the radius of gyration (Rg) scales with the number of segments (N) as Rg∼Nv where ν=0.75.11 With increasing chain concentration, screening effects cause a reduction in chain dimensions such that for a 2D monodisperse melt, chains exhibit ideal behavior with ν=0.5.9,12-14 These scaling predictions have been verified through Monte Carlo (MC) simulations.14,15 Three-dimensional chains exhibit identical scaling in the melt (ν=0.5), while ν=0.6 in dilute solution.9
There have been few experimental reports of the determination of ν for polymers in 2D confinement.16-23 Jones et al.16,17 performed small-angle neutron scattering studies on thin polystyrene films incorporating a deuterated polystyrene fraction and found that the scattering intensity scaled with wavevector as I(k)∼k−2 for films of sub-Rg thickness, consistent with ideal chain statistics (ν=0.5). Maier and Rädler investigated the conformations of micron-length strands of fluorescently labeled DNA confined in 2D via adsorption to mobile cationic lipid bilayers. For isolated chains they found that Rg scaled with number of DNA base pairs as Rg∼N0.79, while for concentrated systems chain collapse was observed, consistent with theoretical predictions, though no scaling exponent was reported.18,19 Wang and Foltz20 conducted atomic force microscopy (AFM) studies on dense 2D films of nanoropes (worm-like micelles) formed from polystyrene-block-polybutadiene copolymers and found that the lateral dimension scaled with contour length as R∼L0.63. For dilute surface concentrations, however, surface tension effects resulted in more collapsed configurations with R∼L0.51. Sukhishvili et al.21 performed fluctuation correlation spectroscopy on isolated fluorescently-labeled polyethylene oxide (PEO) chains adsorbed onto a self-assembled monolayer on silica and obtained a diffusion coefficient scaling of D∼N−3/2, implying Rg∼N−3/4. From Langmuir trough experiments on polymers confined at the air/water interface, Vilanove and Rondelez22 extracted ν values of 0.56 and 0.79 for poly(methyl methacrylate) and poly(vinyl acetate), respectively, using the semidilute scaling relation Π∼c2ν/(2ν–1), where Π and c denote the surface pressure and concentration, respectively. More recently, a similar analysis by Gavranovic et al.23 on poly(tert-butyl methacrylate) yielded ν=0.53.
Akin to the surface-confined DNA and PEO systems described above, amphiphilic comb copolymers composed of a hydrophobic poly(methyl methacrylate) (PMMA) backbone and short, hydrophilic PEO side chains, PMMA-g-PEO, have been proposed to self-organize at the polymer/water interface, resulting in the effective confinement of the backbone to two dimensions3,24,25 for chains at the immediate surface of a PMMA-g-PEO film (Figure 1). To directly probe such 2D conformations, in this study combs modified with maleimide groups on the PEO chain ends were blended at 0.5-10 wt% with unmodified PMMA-g-PEO and cast into films of thickness ∼3Rg. Films were immersed in aqueous solution to induce orientation of surface molecules, and maleimide-functionalized chains at the film/water interface were labeled with 1.4 nm dia. Au nanoparticles. Transmission electron microscopy (TEM) was then used to trace the trajectories of individual nanoparticle-decorated chains. The distribution of observed 2D chain lengths was compared to the molecular weight distribution obtained by gel permeation chromatography. The scaling exponent ν for the 2D radius of gyration was calculated, and compared to that obtained from Monte Carlo simulation of a 2D melt having a chain length distribution fitted to that of our experimental system. The results suggest that polydispersity significantly influences 2D melt conformations.
Figure 1.

(a) Schematic illustration of amphiphilic comb copolymers confined in two dimensions at the polymer film/water interface. Nanoparticles attached to side chains of maleimide-modified comb polymers create nanoparticle clusters at the surface. By contrast, nanoparticles attached to surface maleimide groups on 3D comb polymer chains (b) will be scattered uniformly across the surface.
Experimental Section
Materials
Methyl methacrylate, poly(ethylene oxide) methacrylate, azobis(2-methylpropionitrile) and tris(2-carboxyethyl)phosphine were purchased from Aldrich Chemical Co. Toluene, hexane, (p-maleimidophenyl) isocyanate (PMPI), ethyl ether, 1,2 ethane dithiol, dimethyl sulfoxide (DMSO), Chromerge and phosphate buffer saline (PBS) were purchased from VWR Scientific. Siliclad was purchased from Gelest. Deionized (DI) water was produced using a Millipore Milli-Q unit. All materials were reagent grade, and used without further purification.
Synthesis and Characterization
PMMA-g-PEO amphiphilic comb copolymers were synthesized by free radical methods using a macromonomer route as described previously.3 The number-average molecular weight of the resulting polymer was 142 kg/mol with a broad molecular weight distribution (PDI=3.2) as determined by gel permeation chromatography with in-line light scattering (GPC-LS, Wyatt MiniDawn). Composition was determined by proton NMR (Bruker DPX 400) as 32% PEO by weight, corresponding to approximately one PEO side chain per eleven backbone MMA units, where each side chain consists of ten EO units terminated by a hydroxyl group. For this composition the copolymer remains water insoluble. The weight and number average N values for the MMA backbone were 3,070 and 960, respectively.
A portion of the comb copolymers was harvested and functionalized with maleimide groups through reaction with two molar equivalents of PMPI in anhydrous DMSO.26 PMPI-modified polymer was purified through reprecipitation in ethyl ether. Proton NMR showed that 60% of the PEO chain ends were functionalized, translating to one maleimide per every 19 MMA backbone segments. Using this composition and the model by Irvine, et al.,3 a theoretical density of ρM ≈ 88,000 maleimides/μm2 at the film/water interface can be estimated for a film of 100% malemide-modified comb:
| (1) |
where ϕM is the mass fraction of maleimide-modified polymer in the blend, sM is the average number of malimide-modified side chains per comb molecule (sM = 64), and Rg,2D is the average in-plane Rg for chains confined at the comb/water interface, calculated according to ref. 3 (Rg,2D = 18.6 nm for N = 960).
Surface Preparation
2.5 cm square pieces of silicon wafer (University Wafers) were cleaned overnight in Chromerge, thoroughly rinsed in DI water, treated with a 1% aqueous solution of Gelest Siliclad for 30 seconds and cured at 100°C for 5 minutes. Blends of PMPI-modified and unmodified comb polymers were spin cast from 1 wt% solution in toluene onto Siliclad-treated wafers. To enable detection of individual maleimide-bearing chains, blends used in this study contained 0.5-10% PMPI-modified comb. After spin casting, films were annealed under vacuum at 65°C (20 degrees above the glass transition) overnight. Dry film thickness was determined by ellipsometry (Gartner L125A) to be ∼35 nm (∼3Rg). This thickness was chosen so as to be thin enough for TEM observation, but thicker than the coil diameter, to avoid film thickness effects on chain conformation.17
Nanoparticle Coupling
Nanoparticle coupling was performed with films immersed in aqueous solution. In a water-based environment, PMMA-g-PEO molecules at the film surface are expected to exhibit quasi-2D conformations, with the insoluble PMMA backbone pinned at the interface and PEO side chains extending into solution,3,24,25 thus becoming fully accessible to react with nanoparticles. Maleimide end groups of PMPI-modified chains will be present both at the surface and within the film; however, only those at the surface appear accessible for nanoparticle coupling, as described below. PMPI-modified chain ends were first reacted with 1,2 ethane dithiol (10 μM in buffer solution) for two hours at ambient temperature to produce thiol end groups. Monomaleimido gold nanoparticles (1.4 nm diameter, Nanoprobes) were subsequently coupled to thiol chain ends in a 10 μM aqueous buffer solution for 4 hours (Figure 2). A 10-fold excess of tris(2-carboxyethyl)phosphine was added to minimize formation of disulfide bonds. Because each Au nanoparticle is stabilized by a shell of tris (aryl) phosphine ligands, it can react with thiols only through its single maleimide. Consequently, each gold nanoparticle covalently binds to only one thiol-terminated PEO side chain, tracing the backbone contours of the surface-confined PMMA-g-PEO chains modified with PMPI. While changes to backbone conformations due to nanoparticle coupling cannot be ruled out, similar methods to label proteins for TEM imaging did not affect their biological function,27,28 suggesting minimal disturbance of native chain conformations for the small nanoparticle sizes and mild reaction conditions employed here.
Figure 2.

Schematic illustration of coupling chemistry employed to covalently link PMPI-modified comb copolymers to maleimide-bearing nanoparticles using 1,2 ethane dithiol as a linker.
Nanoparticle-coupled surfaces were dried under vacuum, coated with a thin layer of carbon, removed from the silicon using polyacrylic acid29 and mounted on TEM grids.
TEM Imaging of Polymer Chains
All imaging was performed on a JEOL 2010 TEM at 200 kV and 400kx magnification. TEM images were recorded on Kodak film, and then scanned at high resolution. Particles on the scanned images were identified using Scion Image software and their positions converted to x,y coordinate pairs.
Monte Carlo Simulation
The simulation employed a 100×100 2D square lattice, filled entirely with polymer chains. One simulated segment was taken to be 23 backbone segments, in keeping with the estimated number of segments between successive gold nanoparticles, as described below. At each time step, a chain end was chosen at random and joined with a neighboring chain. The superchain thus formed was then broken in two at a randomly chosen segment, subject to the constraint that two linear chains were created. Because the number of chain ends is preserved, the probability of rearrangement for any given chain end is approximately constant.
Following each attempted chain rearrangement, the distribution of chain lengths was calculated and compared with that determined for our polymer by GPC-LS. A metropolis-like procedure was then used to direct the simulated distribution towards the measured distribution. If rearrangement brought the two distributions into closer agreement, it was accepted. Otherwise, it was accepted with a probability determined by their difference:
| (2) |
where is the observed fraction of chains of length N and ϕN is the simulated fraction of chains of the same length. For each simulation, β was initially set small enough that all rearrangements were accepted. The system was allowed to equilibrate until <Rg2> reached a steady value, β was then doubled and the system was again allowed to equilibrate. This procedure was repeated until suitable agreement between distributions was achieved. Results of several simulations were pooled to compute the value of ν from the Rg2 values of individual chains.
Results and Discussion
Figure 3a shows a characteristic TEM image of gold nanoparticles coupled to a 10 wt% blend film of PMPI-modified comb with unmodified comb. Individual nanoparticles are clearly observed at this magnification and appear to be arranged into clusters. No close-packed or overlapping particle formations are present. Moreover, the number of coupled particles scales monotonically with the fraction of PMPI-modified comb copolymer in the blend film (Figure 4), indicating that clustering of particles is caused by attachment to individual polymer chains, rather than by aggregation of adsorbed nanoparticles.
Figure 3.

Observed and simulated images of 2D confined polymers. (a) TEM image of gold nanoparticles attached to a PMMA-g-PEO film made from a blend of 10% PMPI-modified comb in unmodified comb; (b) individual polymer chains determined from this image; (c) lattice Monte Carlo simulation of a 2D polymer melt with a chain length distribution fitted to the experimental distribution determined by GPC-LS (10% of chains highlighted).
Figure 4.

Number of gold nanoparticles observed per field as a function of weight percent PMPI-modified comb in blend film. The dashed line indicates the theoretical number of particles based on the polymer composition from equation 1. Error bars represent one standard deviation.
Several findings support the premise that nanoparticle coupling is confined to surface-localized molecules. First, the observed nanoparticle densities are consistent with theoretical predictions for surface densities from equation 1 based on film composition (dashed line in Figure 4).3 Particle densities on the order of ∼104/μm2 are obtained for a 10% blend film. By comparison, the total number of reactive groups for a 35 nm thick, 10% blend is ∼106/μm2, two orders of magnitude larger than the observed number, suggesting that little nanoparticle coupling occurred in the film interior. Secondly, the absence of overlapping particles in the TEM images (> 100 images taken) is consistent with nanoparticles binding only at the surface. Finally, stereoimaging of a representative blend film showed particles to lie in the same plane to within ±0.2 nm.
Polymer chain trajectories were formed from coordinate pair data by linking successive nearest neighbor (n.n.) particles, subject to the constraint that no particle-particle bond could be longer than a cut-off distance chosen to be 5 nm. The average n.n. distance between particles was found to be 1.6 nm, slightly larger than the Kuhn length of PMMA (1.53 nm).30 In cases where more than one n.n. particle was found, the particle that ultimately produced the shortest overall contour length was used to complete the chain trajectory. Variation of the cut-off distance and the contour length restriction produced little effect on the resulting distribution of chain lengths.
Example chain trajectories obtained from Figure 3a are shown in Figure 3b. Statistical analysis following the quadrant method31 found no spatial correlations on a length scale larger than the average chain dimensions, suggesting that nanoparticle-decorated chains are randomly distributed (i.e., no in-plane segregation of labeled chains is observed).
Figure 5 compares the normalized distribution of chain lengths measured by gel permeation chromatography with in-line light scattering (GPC-LS) to that determined from the TEM images. The normalized GPC distribution was computed from the refractive index signal divided by the number of backbone segments. The number of backbone segments in the GPC-LS curve was taken to be the absolute molecular weight determined by light scattering, multiplied by the weight fraction of MMA backbone segments (0.68) obtained by NMR, divided by the molecular weight of MMA (100 g/mol). The number of backbone segments for chains observed in the TEM was calculated by multiplying the number of gold particles in the chain by the factor 23, derived from the number of backbone segments per activated side chain (∼19), adjusted by the approximate coupling efficiency (80%) determined from Figure 4. Figure 5 shows generally good agreement between the two distributions, with greater discrepancy observed for smaller chains (<50 segments or 2 nanoparticles) due to the increased uncertainty in chain length. The results provide additional evidence of the quasi-2D confined nature of chains at the surface, and interestingly suggest that no preferential surface localization of lower molecular weight chains occurred in this polydisperse system.32-34
Figure 5.
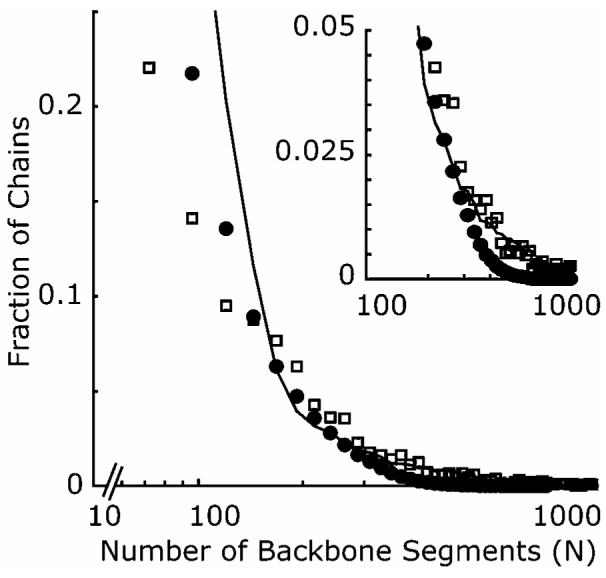
Comparison between the distributions of chain lengths determined from GPC-LS (□) and TEM (●) images. Solid line shows fitted distribution from MC simulation.
The broad molecular weight distribution of our comb polymer provided a wide range of polymer chain lengths, allowing determination of the scaling of radius of gyration with chain length by calculating values from the positions of the tethered nanoparticles:
| (2) |
In this expression, is the position vector of the ith particle and Np is the total number of gold nanoparticles in chain n. These data gave a value for Rg=<Rg2>½ of 9.2 nm for the system. Figure 6 shows a plot of <Rg2(N)> versus number of backbone segments N = 23Np. Each data point represents at least 100 chains. An exponential fit to the data finds ν=0.69±0.02. This observed value falls between the values predicted for 2D swollen chains (ν=0.75) and 2D monodisperse polymer melts (ν=0.5).
Figure 6.

Scaling of <Rg2(N)> with number of polymer backbone segments N for observed and simulated 2D polymer chains. Solid line shows best fit.
Deviation from melt-like behavior may reflect the presence of a large fraction of short chains in our polymer (Figure 4), which can act as a good solvent, swelling longer chains.9 Maier and Rädler qualitatively showed a similar effect in blends of long and short DNA chains confined in 2D.18 Reiter and coworkers also observed an increase in ν for polydisperse systems in Monte Carlo simulations on a 2D lattice.14 However, earlier simulations by Mansfield found that ν was independent of polydispersity over a PDI range of 1.2-1.9.32 Deviation from 2D melt scaling might also be observed if labeled chains are not strictly confined to 2D. Where some overlap between chains is allowed in a 2D melt, Semenov and Johner obtained .13 Alternately, our ν value might reflect behavior intermediate between swollen 2D and swollen 3D chains (ν=0.6). However, the observed close agreement between the GPC and TEM molecular weight distributions, lack of overlapping particles and stereoimaging analysis all suggest 2D confinement of labeled chains.
To compare theoretical values with our observed ν, we performed Monte Carlo simulations using the lattice model of Reiter14 and Mansfield,35 modified such that the distribution of chain lengths could be refined to match the experimental distribution determined by GPC. When tested using distributions of lower polydispersity, this approach gave the result ν=0.56±0.04, in agreement with values reported in ref. 14. For a simulated system of chains with a molecular weight distribution fitted to our experimentally observed system, ν=0.67±0.03, in good agreement with the scaling exponent obtained from TEM analysis (Figure 6). Figure 5 shows the fitted MC chain length distribution (solid line). A sample MC configuration is shown in Figure 3c. The MC results support the notion that polydispersity causes the observed deviation from 2D melt behavior.
Conclusions
In this article, we have mapped the backbone conformations of amphiphilic comb copolymers at a polymer film/water interface. Using nanoparticle labeling, chain trajectories were obtained by TEM and found to be consistent with quasi-2D confinement of the comb molecules at the surface and partial swelling in two dimensions due to polydispersity. 2D Monte Carlo calculations on systems of comparable chain length distribution gave good agreement with the observed experimental scaling of Rg with chain length.
To our knowledge, this is the first report of the direct observation of chain conformations at a synthetic polymer film surface. The results further demonstrate that surfaces with a controlled spatial distribution of functional groups can be effectively prepared from mixtures of unmodified and functionalized amphiphilic comb molecules.3 Such findings may be of value in designing bioactive surfaces with nanometer length-scale clusters of peptides or proteins.36-39 Control over ligand distribution on this length scale is of importance in biology, where receptor clustering is often a prerequisite for strong cell signaling.3-5,37,40
Acknowledgements
This work was funded by NIH Grant #1R0GM59870-01. This work made use of the Shared Experimental Facilities supported by the MRSEC Program of the National Science Foundation under award number DMR 02-13282, and facilities supported by NIH grant 1S10RR13886-01. We would like to thank Mr. Mike Frongillo for assistance in obtaining the TEM images, and Mr. Daniel Pregibon, Drs. Maria L Ufret, Ikuo Taniguchi and Metin H. Acar for their assistance with synthesis.
References
- 1.Park M, Harrison C, Chaikin PM, Register RA, Adamson DH. Science. 1997;276:1401–1404. [Google Scholar]
- 2.Turner SWP, Cabodi M, Craighead HG. Physical Review Letters. 2002;88:128103. doi: 10.1103/PhysRevLett.88.128103. [DOI] [PubMed] [Google Scholar]
- 3.Irvine DJ, Mayes AM, Griffith LG. Biomacromolecules. 2001;2:85–94. doi: 10.1021/bm005584b. [DOI] [PubMed] [Google Scholar]
- 4.Hyun JH, Ma HW, Zhang ZP, Beebe TP, Chilkoti A. Advanced Materials. 2003;15:576–579. [Google Scholar]
- 5.Nath N, Hyun J, Ma H, Chilkoti A. Surface Science. 2004;570:98–110. [Google Scholar]
- 6.Efremov MY, Olson EA, Zhang M, Zhang Z, Allen LH. Physical Review Letters. 2003;91:085703. doi: 10.1103/PhysRevLett.91.085703. [DOI] [PubMed] [Google Scholar]
- 7.Jendrejack RM, Dimalanta ET, Schwartz DC, Graham MD, de Pablo JJ. Physical Review Letters. 2003;91:038102. doi: 10.1103/PhysRevLett.91.038102. [DOI] [PubMed] [Google Scholar]
- 8.Monroy F, Hilles HM, Ortega F, Rubio RG. Physical Review Letters. 2003;91:268302. doi: 10.1103/PhysRevLett.91.268302. [DOI] [PubMed] [Google Scholar]
- 9.de Gennes PG. Scaling Concepts in Polymer Physics. Cornell University Press; Ithaca: 1979. [Google Scholar]
- 10.Doi M. The theory of polymer dynamics. Oxford University Press; New York: 1986. [Google Scholar]
- 11.Cloizeaux J, Jannink . G. Polymers in Solution. Clarendon Press; Oxford: 1990. [Google Scholar]
- 12.Yethiraj A, Sung BJ. Journal of Chemical Physics. 2005;122:094910. doi: 10.1063/1.1857520. [DOI] [PubMed] [Google Scholar]
- 13.Semenov AN, Johner A. European Physical Journal E. 2003;12:469–480. doi: 10.1140/epje/e2004-00019-2. [DOI] [PubMed] [Google Scholar]
- 14.Reiter J, Zifferer G, Olaj OF. Macromolecules. 1989;22:3120–3124. [Google Scholar]
- 15.Yethiraj A. Macromolecules. 2003;36:5854–5862. [Google Scholar]
- 16.Jones RL, Kumar SK, Ho DL, Briber RM, Russell TP. Nature. 1999;400:146–149. [Google Scholar]
- 17.Jones RL, Kumar SK, Ho DL, Briber RM, Russell TP. Macromolecules. 2001;34:559–567. [Google Scholar]
- 18.Maier B, Rädler JO. Physical Review Letters. 1999;82:1911–1914. [Google Scholar]
- 19.Maier B, Rädler JO. Macromolecules. 2000;33:7185–7194. [Google Scholar]
- 20.Wang X, Foltz VJ. Journal of Chemical Physics. 2004;121:8158–8162. doi: 10.1063/1.1801331. [DOI] [PubMed] [Google Scholar]
- 21.Sukhishvili SA, Chen Y, Müller JD, Gratton E, Schweizer KS, Granick S. Nature. 2000;406:146. doi: 10.1038/35018166. [DOI] [PubMed] [Google Scholar]
- 22.Vilanove R, Rondelez F. Physical Review Letters. 1980;45:1502–1505. [Google Scholar]
- 23.Gavranovic GT, Deutsch JM, Fuller GG. Macromolecules. 2005;38:6672–6679. [Google Scholar]
- 24.Irvine DJ, Ruzette A-VG, Mayes AM, Griffith LG. Biomacromolecules. 2001;2:545–556. doi: 10.1021/bm015510f. [DOI] [PubMed] [Google Scholar]
- 25.Walton DG, Soo PP, Mayes AM, Allgor SJ, Fujii JT, Griffith LG, Ankner JF, Kaiser H, Barker JG, Satija SK. Macromolecules. 1997;30:6947–6956. [Google Scholar]
- 26.Annunziato M, Patel UMR, Palumbo P. Bioconjugate Chem. 1993;4:212–218. doi: 10.1021/bc00021a005. [DOI] [PubMed] [Google Scholar]
- 27.Hainfeld JF. Science. 1987;236:450–453. doi: 10.1126/science.3563522. [DOI] [PubMed] [Google Scholar]
- 28.Schwartz MP, Matouschek A. Proceedings of the National Academy of Science. 1999;96(23):13086–13090. doi: 10.1073/pnas.96.23.13086. [DOI] [PMC free article] [PubMed] [Google Scholar]
- 29.Robinson DG. Methods of preparation for electron microscopy. Springer-Verlag; New York: 1987. [Google Scholar]
- 30.Mark James E., editor. Physical properties of polymers handbook. AIP Press; Woodbury, N.Y.: 1996. [Google Scholar]
- 31.Cressie NAC. Statistics for Spatial Data. Wiley; New York: 1992. [Google Scholar]
- 32.Hong PP, Boerio FJ, Smith SD. Macromolecules. 1994;27:596–605. [Google Scholar]
- 33.Hopkinson I, Kiff FT, Richards RW, Affrossman S, Hartshorne M, Pethrick RA, Munro H, Webster JRP. Macromolecules. 1995;28:627–635. [Google Scholar]
- 34.Schaub TF, Kellogg GJ, Mayes AM, Kulasekere R, Ankner JF, Kaiser H. Macromolecules. 1996;29:3982–3990. [Google Scholar]
- 35.Mansfield ML. Journal of Chemical Physics. 1982;77:1554–1559. [Google Scholar]
- 36.Miyamoto S, Akiyama SK, Yamada KM. Science. 1995;267:883–885. doi: 10.1126/science.7846531. [DOI] [PubMed] [Google Scholar]
- 37.Maheshwari G, Brown G, Lauffenburger DA, Wells A, Griffith LG. Journal of Cell Science. 2000;113:1677–1686. doi: 10.1242/jcs.113.10.1677. [DOI] [PubMed] [Google Scholar]
- 38.Koo LY, Irvine DJ, Mayes AM, Lauffenburger DA, Griffith LG. Journal of Cell Science. 2002;115:1424–1433. doi: 10.1242/jcs.115.7.1423. [DOI] [PubMed] [Google Scholar]
- 39.Sharma P, Varma R, Sarasij RC, Gousset IK, Krishnamoorthy G, Rao M, Mayor S. Cell. 2004;116:577–589. doi: 10.1016/s0092-8674(04)00167-9. [DOI] [PubMed] [Google Scholar]
- 40.Bray D, Levin MD, Morton-Firth CJ. Nature. 1998;393:85–88. doi: 10.1038/30018. [DOI] [PubMed] [Google Scholar]