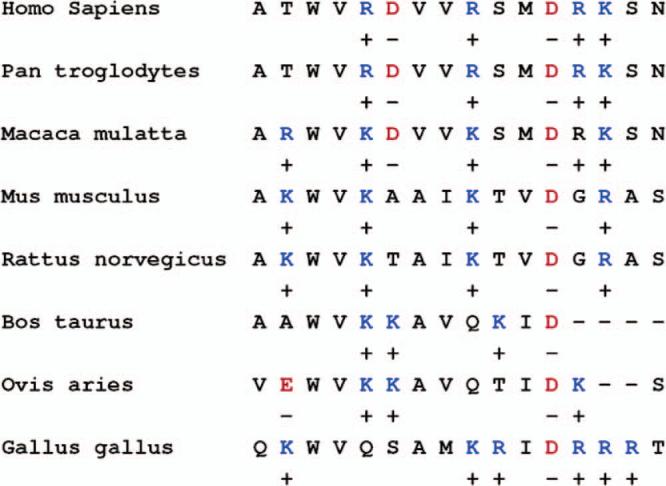
Figure 6.

Multiple Sequence Alignment for several hLtn orthologs in different organisms. Only the C-terminal helix region is shown. Positively charged residues are shown in blue and underscored by “+” and negatively charged residues are shown in red and underscored by “−”.
