

Abstract
Background
Novel therapies targeted to specific tumor pathways are entering the clinic. The need for in vivo monitoring of resulting molecular changes, particularly with respect to the tumor microenvironment, is growing. Molecular imaging is evolving to include a variety of imaging methods to enable in vivo monitoring of cellular and molecular processes.
Objectives
This article reviews the emerging role of molecular imaging in the development of improved therapeutic strategies that provide better patient selection for therapeutic personalization (i.e. determine which therapies have the greatest chance of success given the individual patient’s disease genetic, and phenotypical profile).
Methods
In order to illustrate the utility of integrating molecular imaging into therapy development strategies, current and emerging applications of nuclear molecular imaging strategies will be compared with conventional strategies. Proposed methods of integrating molecular imaging techniques into cancer therapeutic development and limitations of these techniques will be discussed.
Results/Conclusion
Molecular imaging provides a variety of new tools to accelerate the development of cancer therapies. The recent drive to develop molecular imaging probes and standardize molecular imaging techniques is creating the scaffolding for the evolving paradigm shift to personalized cancer therapy.
Keywords: Molecular Imaging, Systems biology, Cancer, Imaging, PET, SPECT, FDG, FLT, Drug development
1. Introduction
Conventional therapeutic strategies for cancer involve relatively non-specific cytotoxic agents which interfere with the metabolism of most tumors (with significant toxicity to normal tissues), and utilize conventional response criteria such as anatomic size change and disease free survival.
This paradigm, which involves an initial biopsy of a suspicious lesions and standard of care treatment based on stage, based on population-based malignant characteristics such as rate of growth, tumor type, and known molecular markers is evolving. While this standard of care is effective in some cases, many patients undergo second and third round therapies for refractory/recurrent disease even while eventually succumbing to their disease.
Molecular imaging is defined by the Society of Nuclear Medicine as “the visualization, characterization, and measurement of biological processes at the molecular and cellular levels in humans and other living systems.”[1] In this post genomic era, numerous molecularly targeted therapies have obtained FDA approval. Some examples are imatinib mesilate (Gleevec®) which directly turns off the signal of a protein known to cause cancer in gastrointestinal stromal tumors (GIST) and some forms of chronic myelogenous leukemia (CML); trastuzimab (Herceptin®) which inhibits the epidermal growth factor receptor-2 (EGFR2) or HER2 receptor (high levels of expression correlate with poor prognosis) and cetuximab (Erbitux®) which inhibits the epidermal growth factor receptor-1 (EGFR1) or HER1, a cell receptor which regulates growth pathways), Many more are under development, which increases the need to identify therapeutically relevant targets, determine whether and to what extent a given tumor expresses the target of interest, and determine whether the drug is effective at modulating the target. All of these can be performed by molecular imaging methods.
1.1 Standard biopsy versus the “virtual” molecular imaging biopsy
The standard diagnostic biopsy entails closely examining a small portion of the tumor(s). From this sample, enormous amounts of genomic data (i.e., from microarrays) can be obtained. While this represents a milestone in our understanding of disease, genomics are not the whole picture, as each gene, even if mutated or over-expressed, does not necessarily code for a protein nor correlate with the amount of protein produced. Moreover, temporal changes in gene expression after tissue removal can degrade the value of gene array data in human specimens. Tumors are notoriously heterogeneous so that a small tissue sample may not adequately represent the most aggressive biology present. Immunohistochemical staining (IHC) can detect the presence of specific protein targets which lead to another level of complexity in the understanding of tumor proteomics. As the presence of a protein does not imply function or rate of function, and the functionality of protein in its microenvironment is variable, both temporally and spatially, it is difficult to know how to use the information we can currently obtain. The expression of some molecular targets is altered during the tissue fixation process, and obtaining the fresh tissue necessary for molecular target analyses is challenging. Biopsies are invasive, carry some inherent risks, can be painful, technically non-diagnostic, may perturb the tumor microenvironment and may miss the most important parts of the tumor. Serial biopsies are typically not practical and the acquisition of a representative sample from the same tumor region is limited by technical factors and variable expression of molecular targets throughout the tumor (tumor heterogeneity).
Molecular imaging can provide a more complete systematic picture of the living tumor. The term “virtual biopsy” has been somewhat freely applied to molecular imaging and is somewhat of a misnomer as in vivo imaging alone is not likely to replace pathology, IHC and genomic analysis. However, molecular imaging methods are certainly complementary to biopsy. They can provide a systems biology framework in which to interpret the biopsy data and a mechanism for determining the optimal biopsy site to obtain the most representative (or most aggressive) tumor region. The primary advantages of molecular imaging (Table 1) are that it is non-destructive, non- or minimally invasive and thus easier on patients, permits the collection of data over time (4D) thus allows for post therapy evaluations, and provides near real-time functional information, and encompasses large volumes of tissue (the whole body in most cases).
Table 1.
Advantages of Nuclear Molecular Imaging
| Whole body coverage |
| Whole tumor sampling |
| Non-destructive, non- or minimally invasive |
| Evaluates Live tissue not dead fixed tissue |
| Evaluates blood flow |
| Provides real time dynamic data/ allows for repeated measures |
| Provides data on how the tumor interacts with microenvironment |
| Tracer (i.e. nano to picomolar) concentrations of imaging agents |
1.2 Discovering new targets and the role of the microenvironment
As more ‘omic information is analyzed, it becomes more apparent that we are “not seeing the forest for the trees”. Successful modulation of key molecular targets identified in tumor cell lines, and in animal models still does not automatically lead to a successful therapy in humans. In fact, only ∼8% of all drugs entering phase 1 clinical studies in 2001 resulted in a marketed drug.[2] While the reasons for this are multi-factorial, molecular imaging may play a role in improving these statistics
Recent research has highlighted the importance of the microenvironment in which the cells reside. While genetic information about the tumor is useful, it is clear that the interplay between environmental cues and the tumor cell form a system that must be considered as a whole. In one study by Kulesa et. al., human metastatic melanoma cells were injected into nude mice and into a developing chick embryo. In the mice, tumors formed, followed by lung metastasis. In the embryos, however, no tumors were found and the cells were optically tracked and shown to migrate and assume characteristics of the native neural crest cells. [3] Gatenby and Gillies propose that there are six “barriers” to carcinogenesis and that invasive cancer results only after all of these barriers have been crossed. These barriers include: apoptosis with loss of basement membrane contact, inadequate growth promotion, senescence, hypoxia, acidosis, and ischemia. Cells must find ways of overcoming each of these microenvironment obstacles in order to become and invasive cancer. As there are multiple ways to cross each barrier, a large number of different genotypic and phenotypic variations exist.[4] These variations can be present within single patient (i.e. the genetic expression profile of the primary tumor is different than that of the distant metastases) as well as within each tumor (tumor heterogeneity).
Pharmaceutical development is moving away from a “single target-single drug” model to a more systems-based approach in which the “target” may be multiple proteins which control key pathways of the tumor cell.[5-7] Pampaloni et al advocates growing cells on 3D scaffolding to bridge the gap between traditional cell cultures, where environmental cues are lacking and physiologic tissues.[8] However, in order to truly understand how the microenvironment affects the genetic and phenotypic variations in tumors, a real-time, in vivo (semi-)quantitative reproducible method of evaluating these interactions, in their native environment, is needed.
Molecular imaging is an obvious choice. Molecular imaging allows multiple cells and physiological processes to be evaluated over a period of time. There are various modalities, each with their inherent strengths and weakness. As numerous previous reviews provide detailed descriptions and comparisons of the major modalities,[9-14] those details will not be discussed here. What follows are several examples of molecular imaging to 1) enable the identification of suitable therapeutic targets, by improving the understanding of tumor biology and its interactions with the surrounding microenvironment, 2) optimize therapeutic doses by visualizing spatial and temporal target and drug distribution to allow for prediction of tumor and normal tissue toxicities, 3) aid in risk stratification; the identification of patients who are likely to benefit from targeted therapies and those at risk for treatment failure, and 4) monitor therapeutic response to targeted therapies.
2. Nuclear Molecular Imaging
Herein we focus primarily on nuclear radiotracer imaging positron emission tomography (PET) and single photon emission computed tomography (SPECT) while acknowledging the contribution of other imaging modalities. In both PET and SPECT, a small amount of a radioactive compound (tracer) is administered to a subject and images are acquired with a highly sensitive camera which can detect the small amount of radioactivity emanating from the body. The resultant images are 3-dimensional spatial reconstructions of the tracer location at the time of imaging. The intensity of the imaging signal is proportional to the amount of tracer and, therefore, semi-quantitative (and in the case of PET, potentially quantitative) analysis is possible. By obtaining multiple images over time, an in vivo dynamic (4D) dataset is obtained. While the clinical spatial resolution is limited (∼4-6mm for PET and 1.5 cm for SPECT) the ability to image physiological and functional processes, such as the rate of glucose metabolism, in a living system provides vital information not available from conventional imaging techniques.
2.1. Targeting non-specific tumor properties
Perhaps the most well known radiotracer in widespread clinical use is 18F-2-fluoro-2-deoxy-D-glucose (FDG) PET imaging. FDG is a glucose analogue and as such can be used as a surrogate for tissue glucose utilization (metabolism). As increased glucose metabolism is a common feature of many malignancies, FDG PET imaging is routinely used to diagnose and stage malignancy, and to differentiate between viable tumor and residual scar or necrotic tissue after therapy. Two examples of emerging radiotracers which target universal tumor properties include 3′-deoxy-3′-18F-fluorothymidine (FLT), a marker for proliferation and 11C acetate (AC) a marker of membrane turnover.
2.1.1 FDG
The basic principle of 18F-FDG imaging is based on Warburg’s observation that the increased metabolic demands of rapidly dividing tumor cells required adenosine triphosphate (ATP) generated by glycolysis.[15] FDG is actively transported into cells and converted into FDG-6-phosphate by hexokinase. FDG-6-phosphate, because it is not a substrate for the enzyme responsible for the next step in glycolysis, is then trapped in the cell. The 18F label allows the location of FDG to be tracked in space and time by PET imaging; resulting in an approximation of tissue glucose utilization.[16, 17] Numerous studies have shown FDG PET to be accurate in the diagnosis and staging of various malignancies, and in the United States, the Center for Medicare and Medicaid Services has approved reimbursement for FDG PET imaging for those indications listed in Table 2.
Table 2.
Indications currently approved for reimbursement for FDG PET by the U.S. Center for Medicare and Medicaid Services
| Cancer Type | Indication |
|---|---|
| Breast | Staging of distant metastasis, restaging monitoring |
| Cervical | Staging as adjunct to conventional imaging |
| Colorectal | Diagnosis, staging and restaging |
| Esophagus | Diagnosis, staging and restaging |
| Head and Neck | Diagnosis, staging and restaging |
| Lymphoma | Diagnosis, staging and restaging |
| Melanoma | Diagnosis, staging and restaging |
| Non-small cell lung cancer | Diagnosis, staging and restaging |
| Solitary Pulmonary Nodule | Characterization |
Recently, FDG PET has been shown to be useful in evaluating tumor response early in the course of therapy [18] and to provide some prognostic information.[19, 20] FDG was shown to be an excellent predictor of response of GIST to imatinib mesylate. Choi et. al. reported a comparison between the conventional CT-based Response Evaluation Criteria in Solid Tumors (RECIST) guidelines and the FDG PET response measurement in 29 patients who underwent both tests. They showed no significant association between the change in FDG uptake and CT parameters. (p= 0.3088, chi-square test). They concluded that FDG PET is sensitive and specific for evaluating GIST response to imatinib mesylate, but only if the tumor was FDG avid on pre-treatment PET. [21] In a study by Goerres et. al., FDG PET changes (pre- and post-treatment) were predictive of overall survival in responders (log rank test p=0.009) while contrast enhanced CT changes were not (log rank test p=0.706).[22] In a case report by Zincirkeser et. al., near complete inhibition of metabolic activity was noted in a patient with GIST following only 1 month of imatinib mesylate treatments. CT showed no appreciable changes.[23]
These and other promising FDG PET results have caused cooperative groups to begin to re-evaluate the conventional imaging response criteria, such as RECIST and other size criteria. In turn, the nuclear medicine community is working towards establishing reliable and reproducible parameters from PET imaging.[24-27] Moreover, the FDA is currently reviewing its guidelines to allow FDG PET to be used as a surrogate marker of response in Phase I-III clinical trials.
Despite the success of initial clinical molecular imaging with FDG PET, more work is needed in order to reliably obtain reproducible quantitative data on tumor metabolism. The challenges of compensating for the spatial and temporal resolution limits need to be addressed. For example, the routinely quoted spatial resolution of PET is 4-6mm; however it is well known that estimated tracer uptake in a region is dependent on the size of the lesion and the activity in the surrounding background and that only a fraction of the total activity within lesions <1cm is actually measured (this is referred to as the partial volume effect).[28] It is also known that the tumor uptake of a tracer changes over time. Numerous studies have shown that the FDG uptake in tumors increases with time. [29-31] Studies have also reported that imaging at two discrete time points (i.e. 1 hour and 2 hours post tracer injection) can help differentiate between benign and malignant lesions and have suggested that imaging at one additional time point may provide increased ability to determine tumor aggressiveness. [32]
It is also important to realize that the functional parameters being measured are also changing, particularly following therapy. For instance, in mice undergoing photodynamic therapy, Lapointe et al demonstrated the rapid variation in temporal changes of in FDG uptake at 30 minutes and 2 hours post-therapy. These measurements were made continuiously between 20 seconds and 40 minutes post FDG injection, demonstrating the density of data which dynamic FDG PET imaging provides. [33]
As it targets a universal property (glucose metabolism), the specificity of FDG PET is limited. Some tissues have high physiologic rates of glucose metabolism (ie. brain, muscles in use during the uptake period) and some non-malignant processes can also show high FDG uptake (i.e. infections, inflammation, granulomatous disease). [34, 35] High accumulations of tracer are also found in the collecting systems of the kidneys and urinary bladder as this is the excretory route for FDG.
2.1.2 3′-deoxy-3′-18F fluorothymidine (FLT)
Another non-specific property of tumors is increased proliferative rate. FLT, is a structural analog of the DNA constituent, thymidine. Thymidine has been labeled with 14C and 11C for studies in cell culture and in animals. These results have shown that it is rapidly incorporated into newly synthesized DNA. [36] Radiolabeled 11C thymidine has been used for noninvasive evaluation of tumor proliferation in humans. Shields et al determined that 11C thymidine demonstrated a response to chemotherapy before 18F-FDG in 6 patients with malignancy. [36] However, because 11C has a half-life of only 20 minutes, and 11C thymidine is rapidly metabolized, it is not practical for routine clinical use. FLT is a structural analog of the DNA constituent, thymidine. The pharmacology of FLT is based on its action as an inhibitor of DNA synthesis.[37] Unlabeled FLT was initially investigated as an anti-AIDS drug in humans.[38] Intracellular metabolism of FLT produces nucleotides that inhibit endogenous DNA polymerases because they lack a 3′-hydroxyl substituent. This results in premature chain termination of DNA synthesis. [37] Hematological, hepatic and peripheral nerve toxicities were observed after administration of therapeutic doses (≥ 10 mg) of FLT for several weeks, limiting its potential use as a therapeutic. This does not limit its use as a radiotracer as very small amounts are required. In comparison, the use of FLT as a radiolabeled imaging agent, as synthesized today, requires the use of a maximum injection of 10μg, a dose 1,000 times lower than toxic doses of the therapeutic agent. [39] FLT is not incorporated into DNA, but is trapped in the cell due to phosphorylation by thymidine kinase, a part of the proliferation pathway. In this sense it is similar to FDG PET tracer: the tracer accumulates in the cell via the same mechanism as the physiological analog, but cannot be further metabolized and is hence “trapped” and continues to accumulate intracellularly. Analogous to FDG which is a marker of glucose utilization, FLT is a marker of tumor proliferation and its uptake has been shown to be proportional to the DNA synthesis rate and proliferative indices. [40]
The ability of FLT to provide an in vivo assessment of cellular proliferation in malignant tumors adds another tool to permit the non-invasive assessment of the tumor environment. The information from FLT PET is different and complimentary to that provided by FDG PET. Small studies suggest that that FDG is more sensitive for lesion detection; however FLT may be more specific. [36, 41] Other small studies suggest that FLT may be a more sensitive and specific predictor of early response to therapy, [42] as the imaging results are not complicated by the inflammation caused by therapy.
Numerous preliminary studies using FLT imaging in human subjects have been performed [43-47]. including human radiation dosimetry [45] and kinetic analyses. [48, 49]. Overall, the findings demonstrate the feasibility and merit of tumor imaging with FLT. FLT PET demonstrated increased uptake in tumor lesions outside the liver or bone marrow, using the standardized uptake value or SUV, which is a normalized semi-quantitative measure of the amount of tracer accumulated. SUV values in tumors ranged from 4 to7 while normal tissue SUV values varied between 0.5-2. In general the magnitude of FLT uptake is less than that seen with FDG.
Unlike FDG, FLT does not cross the intact blood brain barrier and thus, may prove useful in imaging brain malignancies both primary and metastatic.[48, 50] The normal distribution of FLT shows high accumulation in the bone marrow, therefore, evaluation of bone and bone marrow lesions is limited. The normal liver shows moderate uptake and FLT is excreted through the urinary system and hence has limitations similar to FDG for disease detection in these areas.
2.1.3 11C Acetate
Some tumors, notably renal and prostate cancers,[51, 52] are difficult to image with FDG due to intrinsic lower levels of uptake and/or adjacent physiological uptake. Like 18F, 11C is a positron emitter albeit with a shorter half life, so 11C compounds can be imaged with PET. 11C acetate (AC) is one such compound. AC has been used as a PET agent in the evaluation of oxidative metabolism of the heart. More recently, studies have shown it to be potentially useful as a tumor imaging agent for prostate [53, 54], liver [55], and renal cell [56] cancers. Acetate is a naturally occurring compound that is converted to acetyl-CoA, a substrate for the TCA cycle, and is incorporated into cholesterol and fatty acids.[57] Because acetate is an anion, the chemical form that is administered is sodium acetate. Although the exact mechanism of acetate accumulation in tumors is unknown, it is probably related to the rate of membrane turnover. It is hypothesized that 11C becomes incorporated in the membrane lipids of tumor cells. [57] AC is metabolized in various organs and is excreted by the pancreas, enabling imaging of the pelvis without confounding bladder activity.
11C AC has been shown to outperform FDG in small studies in several abdominal and pelvic tumor types[52, 58] and therefore may become a useful imaging agent. By targeting membrane turnover and having a favorable physiologic distribution (i.e. no significant urinary excretion), AC PET is able to detect and potentially monitor treatment in tumors that are difficult to identify with conventional means or with FDG PET. In prostate cancer, which is often a multi-focal disease, it is hoped that it can be used to differentiate between low and high risk tumor foci and guide organ sparing therapy. While overlap of AC uptake between malignant and hyperplastic prostate tissue has been reported,[59] correlation with MR and MRS should increase the specificity. The short half life of 11C (∼20 minutes) requires that scan be performed in close proximity to a PET cyclotron, which will limit widespread clinical utility.
2.2 Targeting cell specific cell processes
2.2.1 Sodium iodide
Imaging and treatment of differentiated thyroid carcinomas with radioiodine has been widely utilized for more than 50 years[60]. In fact, it was one of the first procedures where imaging and therapy rely on a specific molecular target, the sodium-iodide symporter (NIS). Dietary iodine is essential for thyroid hormone production. Ingested iodine is converted to iodide and absorbed systemically. Subsequently, iodide is taken up by the NIS for organification in the thyroid follicle. NIS is an integral plasma membrane glycoprotein that mediates the active transport of iodide. 123I, 124I, and 131I are radioactive isotopes of iodine and are handled by the NIS in the same manner as stable iodide and can be easily administered orally as sodium iodide. Since well differentiated thyroid carcinomas frequently have functioning NIS, radioiodine can be used in the management of this disease. [61] Conversely, the inability of a thyroid malignancy to be visualized with radioiodine indicates that the tumor has become de-differentiated and is a poor prognostic factor.
123I decays by electron capture with principal γ-photon emission of 159 keV and a physical half-life of 13.2 h. Despite favorable characteristics for single photon camera imaging, 123I is cyclotron produced, and therefore expensive and not universally available in all nuclear medicine laboratories. 131I has a principal γ-photon emission of 364 keV and physical half-life of 8.02 days. The relatively high energy photon emissions are not ideal for γ-camera imaging but permit adequate whole-body localization of radioiodine avid malignancy. Since 131I exhibits β minus decay, high energy β particles with an average path length of 0.8 mm are deposited in radioiodine avid tissues, providing an efficient targeted therapy [62]. 124I has a half-life of 4.18 days and decays by electron capture (76%) and positron emission (∼23%) and therefore is now under investigation for PET imaging. PET imaging with 124I is somewhat limited by the relatively low positron decay fraction and relatively high positron emission energy.[63]
Unfortunately, specific radiolabeled analogs with such fortuitous physiologic distributions as sodium iodide are not clinically available for many other tumor types. However, there are a vast number of other molecularly targeted PET and SPECT agents under development. Only a few examples will be discussed here.
2.2.2 Radiolabeled Peptide Imaging
Radiolabeled peptides are one of the most successful examples of highly specific molecular targeting in clinical use today. Peptides are short chains of amino acids linked together by covalent bonds that can be chelated to radiometals such as 111In, 68Ga, 86Y and 64Cu for single photon and PET imaging and 90Y or 177Lu for targeted radiotherapy [64, 65]. There are several advantages in using of radiolabeled peptides as radiopharmaceuticals. First, peptides are small in size and diffuse rapidly into target tissues. They have fast blood clearance mainly due to rapid renal excretion (98%) allowing high tumor-to-background ratios. Lastly, radiolabeled peptides have high in vivo stability, low toxicity and low immunogenicity [66, 67].
111In pentetreotide (111In-DTPA-D-Phe1-octreotide) is the most widely available radiolabeled peptide in the United States (OctreoScan®). 111In pentetreotide is a conjugate of octreotide, a long acting somatostatin analog consisting of eight amino acids which primarily targets somastostatin receptors (SSTR) 2 and 5. Affinity to SSTR 3 is low. Over-expression of these receptors is seen in the cell membranes of a variety of neuroendocrine tumors, including adrenal medullary tumors (pheochromocytoma, neuroblastoma, ganglioneuroma), gastroenteropancreatic tumors (gastrinoma, insulinoma, glucagonoma, VIPoma), carcinoid tumors, medullary thyroid carcinomas, melanomas, Merkel cell tumors of the skin, paragangliomas, pituitary adenomas, and small-cell lung cancers[68]. However, some non-neuroendocrine tumors, such as astrocytomas, breast carcinomas and meningiomas, may also be detected by 111In-pentetreotide imaging [69].
111In pentreotide imaging was demonstrated to be superior to initial attempts to image using 123I and 99mTc radiolabels due to its longer half-life (2.83 days compared with 13.2 and 6.02 hours respectively). Better tumor-to-background ratios are obtained when imaging 24 hours after tracer injection (Figure 1). 111In pentreotide imaging is now the clinical gold standard for detection and localization of several neuroendocrine tumors. It permits accurate staging, follow-up, determination of somatostatin receptor status as a predictor of response to unlabeled pentreotide treatment, and selection of patients in whom peptide receptor-targeted radiotherapy (PRRT) will be most beneficial.[70] High dose 111In pentreotide and 90Y labeled pentreotide are also being investigated for use as therapeutic agents.[71] Initial work with 68Ga-DOTA-Try3-Octreotide (68Ga DOTA-TOC), a PET agent for mapping the distribution of somatostatin receptors, showed a higher detection rate than 111In pentreotide SPECT, despite its shorter half life (67.6 minutes), probably due to the higher resolution of PET and favorable pharmacokinetics of 68Ga DOTA-TOC.[72]
Figure 1.
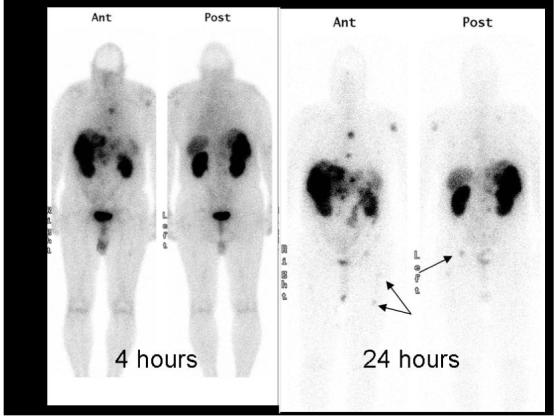
Planar 111In pentreotide single photon scintigraphy of a patient with metastatic carcinoid. Note the metastases in the right pelvis and femur on the 24-hour images that were not well visualized on the 4-hour image. The additional delay allows for improved blood pool clearance and tumor uptake.
Other promising peptide-based radiopharmaceuticals currently under development include bombesin, substance P, neurotensin, glucagon-like peptide-1, and RGD-peptides targeting αvβ3/5 integrins expression in angiogenic vessels and in tumors [66].
2.2.3 Radiolabeled Antibodies
Numerous efforts are underway to radiolabel clinically relevant antibodies in order to take advantage of the specificity of the antibody-receptor binding mechanism and determine the biodistribution of commonly used therapeutic monoclonal antibodies. While there are many challenges involved (ie. maintaining immunoreactivity, limiting non-target cross reactivity, ensuring clearance of these large molecules from the bloodstream to reduce background activity, etc.) the potential benefits are large. There are 2 therapeutic radiolabeled antibodies approved by the FDA for clinical uses: 90Y ibritumomab tiuxetan (Zevalin®) and 131I tositumomab (Bexxar®). Both of these agents target the CD20 antigen expressed in 90% of B-cell lymphomas. Both have shown high response rates in patients refractory to other therapies. While 131I tositumomab can be imaged directly, as a pure β emitter, the biodistribution of 90Y ibritumomab tiuxetan is imaged using 111In ibritumomab tiuxetan as a surrogate marker.[73, 74] Numerous other radiolabeled antibodies are under development. Two related examples targeting the epidermal growth factor (EGF) family of receptors, 111In trastuzumab (targeting EGFR2/HER2) and 111In cetuximab (targeting EGFR1/HER1), are discussed here. (Figure 2)
Figure 2.
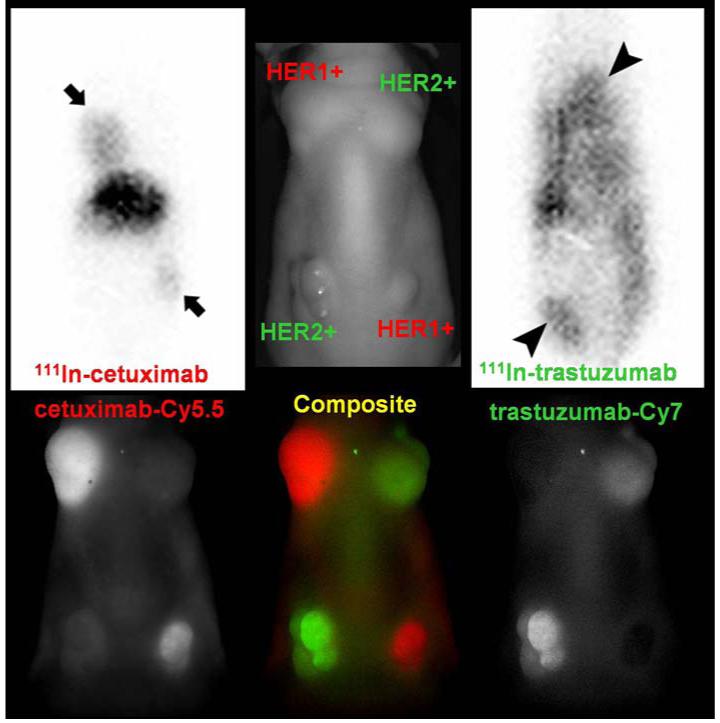
This image shows concordance between fluorescent optical and 111In gamma scintigraphy of HER2 and HER1 labeled antibodies. Optical imaging is a powerful pre-clinical tool; however it is difficult to image deep tissues. Gamma scintigraphy will be more suitable for clinical translation. Top row: (left and right) 50 μg of 111In cetuximab (HER1 avid) or 111In trastuzumab (HER2 avid) planar scintigraphy in a mouse implanted with tumors over-expressing HER2 (3T3/HER2) and HER1 (A431) 2days after injection (peak accumulation time of antibodies in the tumor). The middle image is a labeled photograph for anatomical reference. Bottom row: Multiple-color near infrared optical (Cy5.5 and Cy7) imaging was obtained with a cocktail of 25 μg of Cy5.5-cetuximab and 25 μg of Cy7-trastuzumab 1 day after injection. The results performed in the same animal model with similar sizes of tumors.
111In trastuzumab
HER2 (aka: neu, ErbB2, cErb-B2) is a 185 kD membrane-bound receptor with tyrosine kinase activity (epidermal growth factor receptor-2) which interacts with members of the EGFR family and other ligands[75]. These receptors stimulate intracellular signal transduction pathways involved in the control of cell growth. HER2 is over-expressed in a variety of epithelial tumors; approximately 25-30% breast and ovarian cancers, 35-45% of all pancreatic adenocarcinomas, and up to 80% of colorectal carcinomas.[75, 76] In a study of >100 human tumor xenografts, overexpression of HER2 was also shown to be common in uterine cervix (67%), gastric (75%), prostate (50%) cancers and adenocarcinoma of the lung (67%). Over-expression of this oncogene is associated with a poor prognosis and aggressive tumor attributes, especially when the gene is not only overexpressed but amplified by multiple gene copies[77]. Trastuzumab has been particularly effective in patients who have amplified expression of HER2 which mainly occurs in about 20% of breast cancers where it gained FDA approval in 1998 for the treatment of advanced stage HER2 over-expressing tumors. Trastuzumab is a humanized monoclonal antibody that targets HER2 and has been shown to have anti-tumor activity in a dose-dependent manner.
Theoretically, this radiolabeling of trastuzumab can be used to 1)identify tumors expressing HER2 (risk stratification), stage and monitor therapy, 2) identify patients who may have undue toxicity due to excessive uptake in normal tissue (e.g. heart muscle), 3) develop a strategy for future targeting of therapeutic isotopes. Such an agent could not only define the extent of HER2 expression in the primary lesion but could also locate secondary lesions and thus be useful for staging and monitoring therapy. A recent publication by Perik el. al. showed successful imaging of HER2 positive breast cancers using 111In-DTPA-trastuzumab,[78] and a image from an open clinical trial at the NIH Clinical Center (www.clinicaltrials.gov) is provided in Figure 3. Importantly, cell lines that express only moderate or low copy numbers of HER2 on their cell surfaces have shown uptake on gamma imaging in mice indicating that it may be possible to image tumors even with lower levels of expression than are currently recommended for trastuzumab treatment.[79, 80] Specifically, it is probable that imaging will be possible in patients whose tumors express HER2 at 2+, 1+ and even 0 levels since fluorescent in situ hybridization (FISH) studies have shown up to 5% of HER2 0 tumors on IHC actually express HER2.[81]
Figure 3.
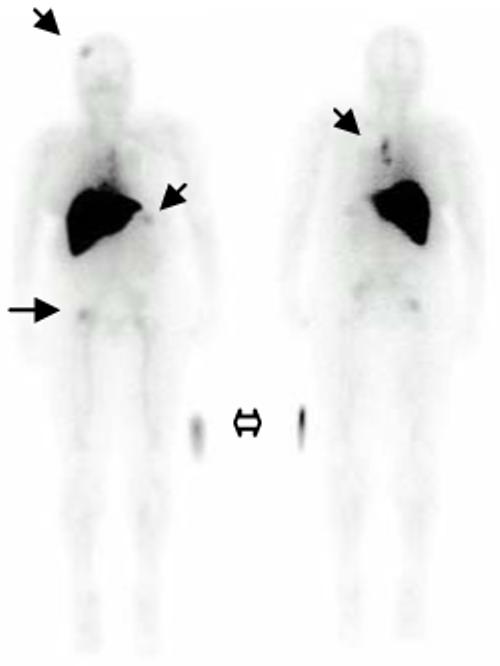
Whole body planar images of a trastuzumab naive patient with HER2+ metastatic breast cancer 4 hours following 5mCi IV injection of 111In trastuzumab. The solid arrows demonstrate uptake in patients known bony metastases. Intense uptake in the liver is physiologic (primary route of excretion). The hollow arrow indicates the location of 5 microCi source external to the patients, placed for calibration.
There is growing interest in the use of imaging as a biomarker to monitor responses to therapy. Ideally, the imaging technique should be closely linked to the therapeutic agent. To date, this has been difficult to achieve as the imaging agent is often quite different in chemical structure and thus, the biodistribution of the imaging agent can diverge from the therapeutic agent it seeks to model. Therapeutic antibodies, such as trastuzumab, however, provide an opportunity for the development of imaging agents that are very nearly identical to the analogous treatment antibody. By chelating the antibody and attaching a radionuclide to the chelate, an imaging agent can be created which is essentially the same biologically as the antibody from which it is derived. The major difference is that the imaging agent can be effective for imaging at substantially lower protein doses (up to 200mcg) than the therapeutic antibody protein dose (100-300mg) and also can be highly effective in tumors expressing a lower level of target antigen. Moreover, the same chelate-antibody combination can be used to attach a radio-therapeutic isotope so the antibody acts as a delivery platform for radioimmunotherapy (i.e. attach a beta emitter such as 90Y).
111In cetuximab
The epidermal growth factor receptor (EGFR, HER1, c-ErbB-1) is a transmembrane glycoprotein that is a member of a subfamily of type I receptor tyrosine kinases. [82] The EGFR is constitutively expressed in many normal epithelial tissues, including the skin and hair follicle. Increased expression of HER1/c-ErbB-1 has been observed in many solid tumors with rates varying from 30 to 100%.[83, 84] This HER1/c-ErbB-1 overexpression usually correlates with a more advanced stage of the disease, a poorer prognosis and response to chemotherapy.[85] Cetuximab is a recombinant chimeric human-murine monoclonal antibody which binds specifically to HER1/c-ErbB-1 on both normal and tumor cells. [86] Cetuximab is FDA approved for use in EGFR expressing colon cancer and squamous cell carcinoma of the head and neck. It comPETitively inhibits the binding of EGF and other ligands, such as transforming growth factor-alpha. In vitro assays and in vivo animal studies have shown that binding of cetuximab to HER1/c-ErbB-1 blocks phosphorylation and activation of receptor-associated kinases, resulting in inhibition of cell growth, induction of apoptosis, and decreased matrix metalloproteinase and vascular endothelial growth factor production.[84] In vitro, cetuximab can mediate antibody-dependent cellular cytotoxicity (ADCC) against certain human tumor types.[87] In vitro assays and in vivo animal studies have shown that cetuximab inhibits the growth and survival of tumor cells that express HER1/c-ErbB-1. No anti-tumor effects of cetuximab were observed in human tumor xenografts lacking HER1/c-ErbB-1 expression.
Although cetuximab is approved by the FDA, there is no clear biomarker to predict its efficacy in individual patients, since response rates and overall survival do not correlate with HER1/c-ErbB-1 immunohistochemistry.[88] For example, in a study reported in 2004,[89] nine patients with undetectable HER1/c-ErbB-1 by immunohistochemistry who were refractory to oxaliplatin and irinotecan were treated with cetuximab alone, and an 11% response rate was observed, which was not different from that observed in patients with HER1/c-ErbB-1 positive tumors. A similar conclusion was drawn from a study at the Memorial Sloan Kettering Cancer Center[90], which analyzed responses to cetuximab in 16 irinotecan-refractory patients who had EGFR-negative tumors (14 received cetuximab-irinotecan and two received cetuximab monotherapy), and found a response rate of 25%. One of the possible explanations for the lack of predictive value of tissue IHC expression could be tumor heterogenicity in which smaller islands of HER1 expressing tumors dominate the overall tumor behavior. [91]
Despite the growing accumulated knowledge of cetuximab as a therapeutic agent, very little has been reported about the human biodistribution, tumor targeting, and normal tissue targeting (i.e., detailed pharmacokinetic and dynamics data). In a phase 0 imaging trial under development, we propose to address several of these issues. Using 111Indium cetuximab SPECT imaging, we will evaluate tumor targeting (risk stratification), define pharmacokinetics, and performing predictive dosimetry calculations. These data can be used to estimate the pharmacologic dose of cetuximab that each organ is receiving from this study, but, most importantly, it will provide radioisotopic dosimetry for future trials using alpha and beta emitting radionuclides. Once validated, 111Indium cetuximab SPECT imaging could then be used to direct and monitor therapy with cetuximab.
2.2.4 Radiolabeled chemotherapeutics
4-[F-18] fluoropaclitaxel
Paclitaxel, a natural chemotherapeutic agent (a taxane) derived from the yew tree, Taxus brevifolia, first introduced 1971[92], is a neutral tubulin-binding and widely used chemotherapeutic agent. Its retention is dependent on tumor mitotic rate. 18F fluoropaclitaxel (FPAC) is a radiolabeled analog of paclitaxel developed at the NIH.[93] While it can be used to study the biodistribution of paclitaxel, the primary focus of its development is to enable the in vivo pre-treatment detection of tumors expressing a phenotype referred to as “multi-drug resistance” or MDR. Many tumors which fail to respond to a wide variety of chemically unrelated chemotherapeutic agents over-express a membrane pump called P-glycoprotein (Pgp) or other proteins which function similarly (i.e. MRP, LRP, BCRP).[94] While genetic analysis of biopsied tumors can reveal the presence or absence of gene over-expression and IHC can determine the amount of protein present, this does not always correlate with protein functionality. Like any one-time image, these analyses are representative only of the expression at the time of biopsy and from the specific region from which the biopsy was obtained. It is well known that over expression of gene coding for Pgp (mdr1) can be induced by exposure to chemotherapy and that the distribution of the protein within a tumor is heterogeneous. FPAC PET imaging permits a real-time dynamic analysis of the function of Pgp and similar membrane pumps, which can be repeated at various time points during therapy. Kinetic analysis of the 4D image datasets yields organ/tumor specific parameters. Pre-clinical[95-98] and preliminary clinical results are promising,[99] suggesting that tumor uptake and retention of FPAC correlates with subsequent response to chemotherapy (Figure 4).
Figure 4.
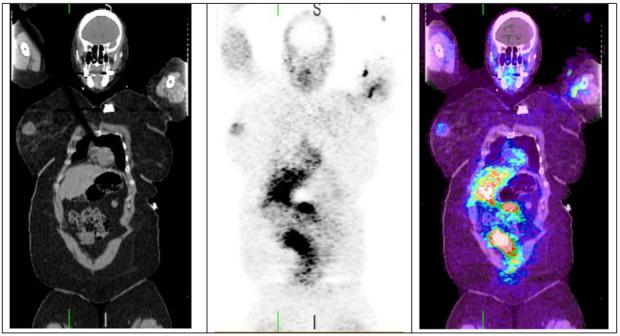
Coronal FPAC PET/CT images, from a patient with a 2 cm right breast mass which showed a complete clinical response to chemotherapy. Significant FPAC uptake is seen in the right breast mass. Due to the hepatic metabolism, there is intense physiologic accumulation of activity in the liver and bowel. Images were acquired ∼3 hours after injection of 5.25 mCi FPAC.
Once validated, it is expected that FPAC can be used to identify patients with tumors expressing the MDR phenotype (risk stratification), quantify the degree of resistance (image molecular target distribution), and monitor response to MDR modulating therapies (there are several in clinical trials at this time.[100, 101] Additionally, as a radiolabeled analog of a chemotherapeutic drug, it can be used to estimate the concentration of paclitaxel within the tumor and the surrounding normal tissues and perhaps optimize the paclitaxel dosing strategy, particularly in patients with potentially altered biodistribution (i.e. liver disease, concomitant drugs metabolized by the p450 system).
2.2.5 Other Radiotracers
The sections above are provided as examples of radiotracers in clinical use or under investigation for future clinical applications and are in no way meant to be an exhaustive listing. Table 3 contains a listing of some other promising cancer radiotracers and the reader is encouraged to visit (and contribute to) the NCI Molecular Imaging Database (MICAD) http://www.ncbi.nlm.nih.gov/books/bookres.fcgi/micad/home.html. This database currently contains 42 SPECT and 79 PET imaging agents (as of 05/07/08) which have been used in humans.
Table 3.
Selected other radiotracers used in humans
| Angiogenesis | 99mTc and 18F galacto-RGD |
| Apoptosis | 99mTc and 18F annexin |
| Blood Flow/Perfusion | 15O water,13N ammonia, 64Cu PTSM, 201Tl Chloride |
| Blood Volume | 11CO |
| Hypoxia | 18F fluoromisonidazole ( MISO), 64Cu diacetyl-bis(N4-methylthiosemicarbazone) (ATSM) |
| Membrane turnover | 18F choline (FCH), 11C choline |
| Protein synthesis/amino acid transport | 11C methionine,11C tyrosine, O-(2-18F fluoroethyl)-l-tyrosine (FET) |
| Chemotherapuetics | 11C temozolomide, 13N Cisplatin, 18F Fluorouracil, 11C paclitaxel |
| Others | 18F dihydroxy-phenyl-alanine (DOPA), 18F 5alpha-dihydrotestosterone (FDHT), 18F Fluoro-17beta-estradiol (FES) |
Conclusion
The role of molecular imaging in cancer therapy is continually evolving. Imaging agents, such as FDG, FLT and AC, which target non-specific tumor properties, such as metabolism, cellular proliferation..), can be used to evaluate response to therapeutic interventions, stage disease and guide biopsies, and, potentially, risk stratify (in so far as the uptake correlates with prognosis e.g. high FDG uptake generally correlating with higher tumor grade). The role of molecular imaging as adjuncts to targeted therapies is very promising since the in vivo target identification and imaging capability can in turn increase the promise of targeted therapies, allowing for more effective risk stratification, more directed treatment, lower normal tissue toxicity, and more rapid detection of response to therapy.
Expert opinion
Molecular imaging does not promise a “magic bullet”, but a new set of tools to understand in vivo cancer biology and to aid in the development of new therapies. It will not replace conventional methods but work synergistically. The challenge is to maximize the potential of each method employed.
The drug development paradigm is changing to a “systems based” frame of reference. [6, 7, 102-104] While numerous molecular targets have been identified, the interaction among targets and control pathways needs to be understood in order to successfully treat tumors. It is likely that a selective combination of specifically targeted drugs will be needed; however, in order to determine what combination will be most effective, the underlying control mechanisms must be better understood. In vivo imaging is by its nature a systems-based approach. Nuclear molecular imaging will not be able to visualize the independent functioning of a given molecular target in an individual cell. It will, however, image the complex system of multiple targets interacting amongst themselves and with their environment. This may be exactly what is needed in the new therapy development paradigm.
The future: Image deconvolution
The reductionist approach to understanding biology involves breaking complex systems into individual simpler components. Once the pieces are characterized and the root cause of a behavior or disease is identified, the problem can be eliminated. While it is often helpful to break a problem down into manageable components, in a living system it must be remembered that these parts are interdependent. The vast amounts of ‘omic (genomic, proteomic, metabolomic) data that have been obtained are the building blocks of a multidimensional, multivariate puzzle comprising the science of systems biology. It may be that a given tumor’s imageable properties: glucose utilization, cellular proliferation, cell membrane turnover and specific molecular targets may vary during phases of disease progression and during treatment. An appropriately timed and designed interrogation of these properties may reveal a characteristic or predictive signal that provides insight into the development of successful therapies.
The complementary nature of the data obtained from standard biopsy and molecular imaging does not imply that the deconvolution of disease control mechanisms will be simple. This reverse engineering process will remain complex, but by integrating the genomic, proteomic building blocks with the end product imaging data in an iterative process, the primary cellular control mechanisms may become less elusive. The ability to correlate perturbations of the system (i.e. with one or more specific inhibitors) and image molecular effect over time is a power combination of tools. Each result, whether supportive or contrary to the current control system model can be used to create an improved model. The ultimate goal is to use molecular imaging as a tool to arrive at a complete understanding of the multidimensional interrelationships of the critical homeostatic pathways and the aberrations which lead to malignancy.
References
- 1.Society of Nuclear Medicine, Molecular Imaging Center of Excellence 2008 cited 2008 March 26. Available from: http://interactive.snm.org/index.cfm?PageID=6431&RPID=969.
- 2··.FDA . Innovation or stagnation? Challenge and opportunity on the critical path to new medical products. U.S. Department of Health and Human Services; 2004. [Google Scholar]
- This document outlines the current barriers to drug approval and proposes methods to
- 3··.Kulesa PM, et al. The embryonic neural crest microenvironment as a model system to explore tumor cell reprogramming and metastatic ability. Dev. Biol. 2007;306(1):369–369. [Google Scholar]
- This paper describes an excellent example of the role of the microenvironment
- 4··.Gatenby R, Gillies R. A microenvironmental model of cacinogenesis. Nat. Rev. Cancer. 2008;8:56–61. doi: 10.1038/nrc2255. [DOI] [PubMed] [Google Scholar]
- This opinion paper describes the “six distinct microenvironmental proliferation barriers”
- 5.Araujo RP, Petricoin EF, Liotta LA. Mathematical modeling of the cancer cell’s control circuitry: Paving the way to individualized therapeutic strategies. Curr. Signal Transduct. Ther. 2007;2(2):145–155. [Google Scholar]
- 6··.Hood L, Perlmutter RM. The impact of systems approaches on biological problems in drug discovery. Nat. Biotechnol. 2004;22(10):1215–1217. doi: 10.1038/nbt1004-1215. [DOI] [PubMed] [Google Scholar]
- This article discusses the potential role of systems biology approaches in drug
- 7.Hood L, et al. Systems biology and new technologies enable predictive and preventative medicine. Science. 2004;306(5696):640–3. doi: 10.1126/science.1104635. [DOI] [PubMed] [Google Scholar]
- 8.Pampaloni F, Reynaud EG, Stelzer EHK. The third dimension bridges the gap between cell culture and live tissue. Nat. Rev. Mol. Cell Biol. 2007;8(10):839–845. doi: 10.1038/nrm2236. [DOI] [PubMed] [Google Scholar]
- 9.Hargreaves RJ. The role of molecular imaging in drug discovery and development. Clin Pharmacol Ther. 2008;83(2):349–53. doi: 10.1038/sj.clpt.6100467. [DOI] [PubMed] [Google Scholar]
- 10··.Hoffman JM, Gambhir SS. Molecular imaging: The vision and opportunity for radiology in the future. Radiology. 2007;244(1):39–47. doi: 10.1148/radiol.2441060773. [DOI] [PubMed] [Google Scholar]
- An excellent introduction to the role of molecular imaging
- 11.Miller JC, Thrall JH. Clinical molecular imaging. J Am Coll Radiol. 2004;1(1 Suppl):4–23. doi: 10.1016/S1546-1440(03)00025-5. [DOI] [PubMed] [Google Scholar]
- 12.Price P. The role of PET scanning in determining pharmacoselective doses in oncology drug development. Ernst Schering Res Found Workshop. 2007;(59):185–93. doi: 10.1007/978-3-540-49529-1_14. [DOI] [PubMed] [Google Scholar]
- 13.Lucignani G, et al. Molecular imaging of cell-mediated cancer immunotherapy. Trends Biotechnol. 2006;24(9):410–8. doi: 10.1016/j.tibtech.2006.07.003. [DOI] [PubMed] [Google Scholar]
- 14.Weber WA. Positron emission tomography as an imaging biomarker. J Clin Oncol. 2006;24(20):3282–92. doi: 10.1200/JCO.2006.06.6068. [DOI] [PubMed] [Google Scholar]
- 15··.Warburg O. Origin of cancer cells. Science. 1956;123(3191):309–314. doi: 10.1126/science.123.3191.309. [DOI] [PubMed] [Google Scholar]
- This classic work is a “must read” for all cancer researchers
- 16··.Sokoloff L, et al. The 14-C deoxyglucose method for the measurement of local cerebral glucose utilization: Theory, procedure, and normal values in the concious and anesthetized albino rat. Journal of Neurochemistry. 1977;28:897–916. doi: 10.1111/j.1471-4159.1977.tb10649.x. [DOI] [PubMed] [Google Scholar]
- This paper describes the first quantitative use of radiolabel deoxyglucose which set the ground work for todays FDG PET imaging
- 17.Phelps ME, et al. Tomographic measurement of local cerebral glucose metabolic rate in humans with (F-18)2-fluoro-2-deoxy-d-glucose: Validation of method. Ann Neurol. 1979;6(5):371–88. doi: 10.1002/ana.410060502. [DOI] [PubMed] [Google Scholar]
- 18.Kostakoglu L, et al. Fdg-PET after 1 cycle of therapy predicts outcome in diffuse large cell lymphoma and classic hodgkin disease. Cancer. 2006;107(11):2678–87. doi: 10.1002/cncr.22276. [DOI] [PubMed] [Google Scholar]
- 19.de Geus-Oei LF, et al. Chemotherapy response evaluation with F-18-FDG PET in patients with non-small cell lung cancer. J. Nucl. Med. 2007;48(10):1592–1598. doi: 10.2967/jnumed.107.043414. [DOI] [PubMed] [Google Scholar]
- 20.Hutchings M, et al. Prognostic value of interim FDG-PET after two or three cycles of chemotherapy in hodgkin lymphoma. Ann. Oncol. 2005;16(7):1160–1168. doi: 10.1093/annonc/mdi200. [DOI] [PubMed] [Google Scholar]
- 21·.Choi H, et al. Ct evaluation of the response of gastrointestinal stromal tumors after imatinib mesylate treatment: A quantitative analysis correlated with FDG PET findings. Am. J. Roentgenol. 2004;183(6):1619–1628. doi: 10.2214/ajr.183.6.01831619. [DOI] [PubMed] [Google Scholar]
- Comparision of FDG PET and CT imaging for the evaluation of GIST tumor response
- 22.Goerres GW, et al. The value of PET, CT and in-line PET/CT in patients with gastrointestinal stromal tumours: Long-term outcome of treatment with imatinib mesylate. Eur. J. Nucl. Med. Mol. Imaging. 2005;32(2):153–162. doi: 10.1007/s00259-004-1633-7. [DOI] [PMC free article] [PubMed] [Google Scholar]
- 23.Zincirkeser S, et al. Early detection of response to imatinib therapy for gastrointestinal stromal tumor by using 18F-FDG-positron emission tomography and computed tomography imaging. World J. Gastroenterol. 2007;13(15):2261–2262. doi: 10.3748/wjg.v13.i15.2261. [DOI] [PMC free article] [PubMed] [Google Scholar]
- 24.Benjamin RS, et al. We should desist using recist, at least in GIST. Journal of Clinical Oncology. 2007;25(13):1760–1764. doi: 10.1200/JCO.2006.07.3411. [DOI] [PubMed] [Google Scholar]
- 25·.Juweid ME, et al. Use of positron emission tomography for response assessment of lymphoma: Consensus of the imaging subcommittee of international harmonization project in lymphoma. Journal of Clinical Oncology. 2007;25(5):571–578. doi: 10.1200/JCO.2006.08.2305. [DOI] [PubMed] [Google Scholar]
- This consensus paper describes a new response criteria for lymphoma, integrating FDG PET results
- 26·.Shankar LK, et al. Consensus recommendations for the use of F-18-FDG PET as an indicator of therapeutic response in patients in national cancer institute trials. J. Nucl. Med. 2006;47(6):1059–1066. [PubMed] [Google Scholar]
- The paper outlines the current NCI recommendations for using FDG PET as a therapeutic response indicator
- 27·.Young H, et al. Measurement of clinical and subclinical tumour response using [F-18]-fluorodeoxyglucose and positron emission tomography: Review and 1999 EORTC recommendations. Eur J Cancer. 1999;35(13):1773–1782. doi: 10.1016/s0959-8049(99)00229-4. [DOI] [PubMed] [Google Scholar]
- This paper outlines the European guidelines for using FDG PET a a marker of therapuetic response
- 28.Iida H, et al. Quantitation of regional cerebral blood flow corrected for partial volume effect using o-15 water and PET: I. Theory, error analysis, and stereologic comparison. J Cereb Blood Flow Metab. 2000;20(8):1237–1251. doi: 10.1097/00004647-200008000-00009. [DOI] [PubMed] [Google Scholar]
- 29·.Keyes J. SUV:Standard uptake or silly useless value? J Nucl Med. 1995;36:1836–1839. [PubMed] [Google Scholar]
- This editorial points out the limitations of using SUV values
- 30·.Lowe V, et al. Optimum scanning protocol for FDG-PET evaluation of pulmonary malignancy. J Nucl Med. 1995;36:883–887. [PubMed] [Google Scholar]
- This paper suggests an SUV cut-off point for differentiating benign form malignant lung lesions
- 31··.Weber W, et al. Reproducibility of metabolic measurements in malignant tumors using FDG PET. J Nucl Med. 1999;40:1771–1777. [PubMed] [Google Scholar]
- This paper demonstrates that the overall reproducibility of FDG PET measurements is ∼10%, AND shows that there was a 16% difference in SUV measurements taken at 40 and 60 minutes
- 32.Conrad GR, Sinha P. Narrow time-window dual-point F-18-FDG PET for the diagnosis of thoracic malignancy. Nucl. Med. Commun. 2003;24(11):1129–1137. doi: 10.1097/00006231-200311000-00002. [DOI] [PubMed] [Google Scholar]
- 33·.Lapointe D, et al. High-resolution PET imaging for in vivo monitoring of tumor response after photodynamic therapy in mice. J. Nucl. Med. 1999;40(5):876–882. [PubMed] [Google Scholar]
- This paper describes the use of dynamic FDG PET imaging during the course of therapy and correlates resultant parameters with the physiologic processes
- 34.Love C, et al. FDG PET of infection and inflammation. Radiographics. 2005;25(5):1357–1368. doi: 10.1148/rg.255045122. [DOI] [PubMed] [Google Scholar]
- 35.Goo JM, et al. Pulmonary tuberculoma evaluated by means of FDG PET: Findings in 10 cases. Radiology. 2000;216(1):117–121. doi: 10.1148/radiology.216.1.r00jl19117. [DOI] [PubMed] [Google Scholar]
- 36.Shields AF, et al. Imaging proliferation in vivo with [F-18]FLT and positron emission tomography. Nat Med. 1998;4(11):1334–6. doi: 10.1038/3337. [DOI] [PubMed] [Google Scholar]
- 37.Matthes E, et al. Phosphorylation, anti-hiv activity and cyto-toxicity of 3′-fluorothymidine. Biochem. Biophys. Res. Commun. 1988;153(2):825–831. doi: 10.1016/s0006-291x(88)81170-7. [DOI] [PubMed] [Google Scholar]
- 38.Flexner C, et al. Relationship between plasma concentrations of 3′-deoxy-3′-fluorothymidine (alovudine) and antiretroviral activity in two concentration-controlled trials. J Infect Dis. 1994;170(6):1394–403. doi: 10.1093/infdis/170.6.1394. [DOI] [PubMed] [Google Scholar]
- 39.Been LB, et al. [18F]FLT-PET in oncology: Current status and opportunities. Eur J Nucl Med Mol Imaging. 2004;31(12):1659–72. doi: 10.1007/s00259-004-1687-6. [DOI] [PubMed] [Google Scholar]
- 40.Buck AK, et al. Molecular imaging of proliferation in malignant lymphoma. Cancer Research. 2006;66(22):11055–11061. doi: 10.1158/0008-5472.CAN-06-1955. [DOI] [PubMed] [Google Scholar]
- 41.Kasper B, et al. Functional diagnosis of residual lymphomas after radiochemotherapy with positron emission tomography comparing FDG- and FLT-PET. Leuk. Lymphoma. 2007;48(4):746–753. doi: 10.1080/10428190601113568. [DOI] [PubMed] [Google Scholar]
- 42.Herrmann K, et al. Early response assessment using 3 ′-deoxy-3 ′-[F-18]fluorothymidine-positron emission tomography in high-grade non-hodgkin’s lymphoma. Clin. Cancer Res. 2007;13(12):3552–3558. doi: 10.1158/1078-0432.CCR-06-3025. [DOI] [PubMed] [Google Scholar]
- 43·.Krohn KA, et al. True tracers: Comparing FDG with glucose and FLT with thymidine. Nuclear Medicine and Biology. 2005;32(7):663–671. doi: 10.1016/j.nucmedbio.2005.04.004. [DOI] [PubMed] [Google Scholar]
- A very good review of the differences between FDG and FLT imaging
- 44.Muzi M, et al. Kinetic analysis of 3 ′-deoxy-3 ′-fluorothymidine PET studies: Validation studies in patients with lung cancer. J. Nucl. Med. 2005;46(2):274–282. [PubMed] [Google Scholar]
- 45.Vesselle H, et al. F-18-fluorothymidine radiation dosimetry in human PET imaging studies. J. Nucl. Med. 2003;44(9):1482–1488. [PubMed] [Google Scholar]
- 46.Alexander S, et al. Flt: Measuring tumor cell proliferation in vivo with positron emission tomography and 3 ′-deoxy-3 ′-[F-18]fluorothymidine. Semin. Nucl. Med. 2007;37(6):429–439. doi: 10.1053/j.semnuclmed.2007.08.001. [DOI] [PubMed] [Google Scholar]
- 47.Smyczek-Gargya B, et al. Pet with [18F]fluorothymidine for imaging of primary breast cancer: A pilot study. Eur J Nucl Med Mol Imaging. 2004;31(5):720–4. doi: 10.1007/s00259-004-1462-8. [DOI] [PubMed] [Google Scholar]
- 48·.Muzi M, et al. Kinetic analysis of 3′-deoxy-3′-F-18-fluorothymidine in patients with gliomas. J. Nucl. Med. 2006;47(10):1612–1621. [PubMed] [Google Scholar]
- This paper suggest that the FLT uptake dose NOT correlate with proliferation in brain tumors unless the blood brain barrier is disrupted
- 49·.Shields AF, et al. A simplified analysis of [F-18]3′-deoxy-3 ′-fluorothymidine metabolism and retention. Eur. J. Nucl. Med. Mol. Imaging. 2005;32(11):1269–1275. doi: 10.1007/s00259-005-1813-0. [DOI] [PubMed] [Google Scholar]
- This paper validated a simplified method of correcting FLT SUV values for the patient specific fraction of metabolized FLT at the time of imaging
- 50.Choi SJ, et al. [(18)F]3′-deoxy-3′-fluorothymidine PET for the diagnosis and grading of brain tumors. Eur J Nucl Med Mol Imaging. 2005 doi: 10.1007/s00259-004-1742-3. [DOI] [PubMed] [Google Scholar]
- 51.Oyama N, et al. 11c-acetate PET imaging of prostate cancer: Detection of recurrent disease at psa relapse. J Nucl Med. 2003;44(4):549–555. [PubMed] [Google Scholar]
- 52.Fricke E, et al. Positron emission tomography with 11c-acetate and 18F-FDG in prostate cancer patients. Eur J Nucl Med Mol Imaging. 2003;30(4):607–11. doi: 10.1007/s00259-002-1104-y. [DOI] [PubMed] [Google Scholar]
- 53.Oyama N, et al. 11c-acetate PET imaging of prostate cancer. J Nucl Med. 2002;43(2):181–6. [PubMed] [Google Scholar]
- 54.Kotzerke J, et al. [1-c-11]acetate uptake is not increased in renal cell carcinoma. Eur. J. Nucl. Med. Mol. Imaging. 2007;34(6):884–888. doi: 10.1007/s00259-006-0362-5. [DOI] [PubMed] [Google Scholar]
- 55.Ho CL, Yu SC, Yeung DW. 11c-acetate PET imaging in hepatocellular carcinoma and other liver masses. J Nucl Med. 2003;44(2):213–21. [PubMed] [Google Scholar]
- 56.Shreve P, et al. Carbon-11-acetate PET imaging in renal-disease. J Nucl Med. 1995;36(9):1595–1601. [PubMed] [Google Scholar]
- 57.Yoshimoto M, et al. Characterization of acetate metabolism in tumor cells in relation to cell proliferation: Acetate metabolism in tumor cells. Nucl. Med. Biol. 2001;28(2):117–122. doi: 10.1016/s0969-8051(00)00195-5. [DOI] [PubMed] [Google Scholar]
- 58.Schoder H, Larson SM. Positron emission tomography for prostate, bladder, and renal cancer. Semin Nucl Med. 2004;34(4):274–92. doi: 10.1053/j.semnuclmed.2004.06.004. [DOI] [PubMed] [Google Scholar]
- 59.Kato T, et al. Accumulation of [c-11]acetate in normal prostate and benign prostatic hyperplasia: Comparison with prostate cancer. Eur. J. Nucl. Med. Mol. Imaging. 2002;29(11):1492–1495. doi: 10.1007/s00259-002-0885-3. [DOI] [PubMed] [Google Scholar]
- 60.Donahue KP, et al. Initial staging of differentiated thyroid carcinoma: Continued utility of posttherapy I-131 whole-body scintigraphy. Radiology. 2008;246(3):887–894. doi: 10.1148/radiol.2463061328. [DOI] [PubMed] [Google Scholar]
- 61.Silberstein EB. Comparison of outcomes after I-123 versus I-131 preablation imaging before radioiodine ablation in differentiated thyroid carcinoma. Journal of Nuclear Medicine. 2007;48(7):1043–1046. doi: 10.2967/jnumed.107.040311. [DOI] [PubMed] [Google Scholar]
- 62.Rault E, et al. Comparison of image quality of different iodine isotopes (I-123, i-124, and I-131) Cancer Biotherapy and Radiopharmaceuticals. 2007;22(3):423–430. doi: 10.1089/cbr.2006.323. [DOI] [PubMed] [Google Scholar]
- 63.Pentlow KS, et al. Quantitative imaging of iodine-124 with PET. J. Nucl. Med. 1996;37(9):1557–1562. [PubMed] [Google Scholar]
- 64.Meares CF, Goodwin DA. Linking radiometals to proteins with bifunctional chelating-agents. Journal of Protein Chemistry. 1984;3(2):215–228. [Google Scholar]
- 65.Liu S, Edwards SD. Bifunctional chelators for therapeutic lanthanide radiopharmaceuticals. Bioconjugate Chemistry. 2001;12(1):7–34. doi: 10.1021/bc000070v. [DOI] [PubMed] [Google Scholar]
- 66.Reubi JC. Peptide receptors as molecular targets for cancer diagnosis and therapy. Endocrine Reviews. 2003;24(4):389–427. doi: 10.1210/er.2002-0007. [DOI] [PubMed] [Google Scholar]
- 67.Okarvi SM. Peptide-based radiopharmaceuticals: Future tools for diagnostic imaging of cancers and other diseases. Medicinal Research Reviews. 2004;24(3):357–397. doi: 10.1002/med.20002. [DOI] [PubMed] [Google Scholar]
- 68.Reubi JC, Waser B. Concomitant expression of several peptide receptors in neuroendocrine tumours: Molecular basis for in vivo multireceptor tumour targeting. European Journal of Nuclear Medicine and Molecular Imaging. 2003;30(5):781–793. doi: 10.1007/s00259-003-1184-3. [DOI] [PubMed] [Google Scholar]
- 69.Limouris GS, et al. Somatostatin receptor scintigraphy of non-neuroendocrine malignancies with In-111-pentetreotide. Anticancer Research. 1997;17(3B):1593–1597. [PubMed] [Google Scholar]
- 70·.Krenning EP, et al. Somatostatin receptor scintigraphy with [In-111-dtpa-d-phe(1)]- and [I-123-tyr(3)]-octreotide - the Rotterdam experience with more than 1000 patients. European Journal of Nuclear Medicine. 1993;20(8):716–731. doi: 10.1007/BF00181765. [DOI] [PubMed] [Google Scholar]
- This report compares In-111 and I-123 octreotide
- 71.Barone R, et al. Therapy using labelled somatostatin analogues: Comparison of the absorbed doses with In-111-dtpa-d-phe(1)-octreotide and yttrium-labelled dota-d-phe(1)-tyr(3)-octreotide. Nucl. Med. Commun. 2008;29(3):283–290. doi: 10.1097/MNM.0b013e3282f3d03e. [DOI] [PubMed] [Google Scholar]
- 72.Gabriel M, et al. Ga-68-dota-tyr(3)-octreotide PET in neuroendocrine tumors: Comparison with somatostatin receptor scintigraphy and ct. J. Nucl. Med. 2007;48(4):508–518. doi: 10.2967/jnumed.106.035667. [DOI] [PubMed] [Google Scholar]
- 73.Jacene HA, et al. Comparison of Y-90-ibritumomab tiuxetan and I-131-tositumomab in clinical practice. J. Nucl. Med. 2007;48(11):1767–1776. doi: 10.2967/jnumed.107.043489. [DOI] [PubMed] [Google Scholar]
- 74.Davies AJ. Radioimmunotherapy for b-cell lymphoma: Y-90 ibritumomab tiuxetan and I-131 tositumomab. Oncogene. 2007;26(25):3614–3628. doi: 10.1038/sj.onc.1210378. [DOI] [PubMed] [Google Scholar]
- 75.Pegram MD, et al. Phase ii study of receptor-enhanced chemosensitivity using recombinant humanized anti-p185(HER2/neu) monoclonal antibody plus cisplatin in patients with HER2/neu-overexpressing metastatic breast cancer refractory to chemotherapy treatment. Journal of Clinical Oncology. 1998;16(8):2659–2671. doi: 10.1200/JCO.1998.16.8.2659. [DOI] [PubMed] [Google Scholar]
- 76.Menard C, et al. Magnetic resonance spectroscopy of the malignant prostate gland after radiotherapy: A histopathologic study of diagnostic validity. Int. J. Radiat. Oncol. Biol. Phys. 2001;50(2):317–323. doi: 10.1016/s0360-3016(01)01480-8. [DOI] [PubMed] [Google Scholar]
- 77.Kim YS, et al. Her-2/neu overexpression as a poor prognostic factor for patients with metastatic breast cancer undergoing high-dose chemotherapy with autologous stem cell transplantation. Clin. Cancer Res. 2001;7(12):4008–4012. [PubMed] [Google Scholar]
- 78.Perik PJ, et al. Indium-111-labeled trastuzumab scintigraphy in patients with human epidermal growth factor receptor 2-positive metastatic breast cancer. J Clin Oncol. 2006;24(15):2276–82. doi: 10.1200/JCO.2005.03.8448. [DOI] [PubMed] [Google Scholar]
- 79.Blend MJ, et al. Labeling anti-HER2/neu monoclonal antibodies with In-111 and Y-90 using a bifunctional dtpa chelating agent. Cancer Biother. Radiopharm. 2003;18(3):355–363. doi: 10.1089/108497803322285107. [DOI] [PubMed] [Google Scholar]
- 80·.Milenic DE, et al. Targeting of HER2 antigen for the treatment of disseminated peritoneal disease. Clin Cancer Res. 2004;10(23):7834–41. doi: 10.1158/1078-0432.CCR-04-1226. [DOI] [PubMed] [Google Scholar]
- This paper suggests that radiolabeled antiHER2 therapy can have use in tumors NOT overexpressing HER2
- 81.Press MF, et al. Diagnostic evaluation of her-2 as a molecular target: An assessment of accuracy and reproducibility of laboratory testing in large, prospective, randomized clinical trials. Clin. Cancer Res. 2005;11(18):6598–6607. doi: 10.1158/1078-0432.CCR-05-0636. [DOI] [PubMed] [Google Scholar]
- 82.Cohen S, Carpenter G, King L. Epidermal growth factor-receptor-protein kinase interactions - co-purification of receptor and epidermal growth factor-enhanced phosphorylation activity. Journal of Biological Chemistry. 1980;255(10):4834–4842. [PubMed] [Google Scholar]
- 83.Rivera F, Vega-Villegas ME, Lopez-Brea MF. Cetuximab, its clinical use and future perspectives. Anticancer Drugs. 2008;19(2):99–113. doi: 10.1097/CAD.0b013e3282f23287. [DOI] [PubMed] [Google Scholar]
- 84.Rocha-Lima CM, et al. Egfr targeting of solid tumors. Cancer Control. 2007;14(3):295–304. doi: 10.1177/107327480701400313. [DOI] [PubMed] [Google Scholar]
- 85.Arteaga CL. The epidermal growth factor receptor: From mutant oncogene in nonhuman cancers to therapeutic target in human neoplasia. Journal of Clinical Oncology. 2001;19(18):32S–40S. [PubMed] [Google Scholar]
- 86.Li SQ, et al. Structural basis for inhibition of the epidermal growth factor receptor by cetuximab. Cancer Cell. 2005;7(4):301–311. doi: 10.1016/j.ccr.2005.03.003. [DOI] [PubMed] [Google Scholar]
- 87.Mellstedt H. Monoclonal antibodies in human cancer. Drugs Today. 2003;39:1–16. [PubMed] [Google Scholar]
- 88.Italiano A. Targeting the epidermal growth factor receptor in colorectal cancer: Advances and controversies. Oncology. 2006;70(3):161–167. doi: 10.1159/000093092. [DOI] [PubMed] [Google Scholar]
- 89.Lenz HJ, et al. Activity of cetuximab in patients with colorectal cancer refractory to both irinotecan and oxaliplatin. Journal of Clinical Oncology. 2004;22(14):247S–247S. [Google Scholar]
- 90.Chung KY, et al. Cetuximab shows activity in colorectal cancer patients with tumors that do not express the epidermal growth factor receptor by immunohistochemistry. Journal of Clinical Oncology. 2005;23(9):1803–1810. doi: 10.1200/JCO.2005.08.037. [DOI] [PubMed] [Google Scholar]
- 91.Goldstein NS, Armin M. Epidermal growth factor receptor immunohistochemical reactivity in patients with american joint committee on cancer stage iv colon adenocarcinoma - implications for a standardized scoring system. Cancer. 2001;92(5):1331–1346. doi: 10.1002/1097-0142(20010901)92:5<1331::aid-cncr1455>3.0.co;2-m. [DOI] [PubMed] [Google Scholar]
- 92.Sparreboom A, et al. Preclinical pharmacokinetics of paclitaxel and docetaxel. Anti-Cancer Drugs. 1998;9(1):1–17. doi: 10.1097/00001813-199801000-00001. [DOI] [PubMed] [Google Scholar]
- 93.Kiesewetter D, Eckelman W. Radiochemical synthesis of [18F]fluoropaclitaxel ([18F]fpac) J. Labelled Cpd. Radiopharm. 2001;44(supplement):S903–S905. [Google Scholar]
- 94·.Gottesman MM, Pastan I. Biochemistry of multidrug-resistance mediated by the multidrug transporter. Annu. Rev. Biochem. 1993;62:385–427. doi: 10.1146/annurev.bi.62.070193.002125. [DOI] [PubMed] [Google Scholar]
- This paper provides and in-depth comprehensive review of MDR
- 95.Gangloff A, et al. Estimation of paclitaxel biodistribution and uptake in human-derived xenografts in vivo with (18)F-fluoropaclitaxel. J Nucl Med. 2005;46(11):1866–71. [PubMed] [Google Scholar]
- 96.Kurdziel K, et al. Biodistribution, radiation dose estimates, and in vivo pgp modulation studies of (18)F-paclitaxel in nonhuman primates. J Nucl Med. 2003;44(8):1330–9. [PubMed] [Google Scholar]
- 97.Jagoda E, et al. Comparision of the biodistribution of fluorinated and tritiated paclitaxel (PAC) in mdr1a(-)/1b(-) knockout vs wildtype mice. J Nucl Med. 2002;43(S):277P. [Google Scholar]
- 98.Kiesewetter DO, et al. Fluoro-, bromo-, and iodopaclitaxel derivatives: Synthesis and biological evaluation. Nucl Med Biol. 2003;30(1):11–24. doi: 10.1016/s0969-8051(02)00351-7. [DOI] [PubMed] [Google Scholar]
- 99·.Kurdziel KA, et al. Imaging multidrug resistance with 4-[18F]fluoropaclitaxel. Nucl Med Biol. 2007;34(7):823–31. doi: 10.1016/j.nucmedbio.2007.04.011. [DOI] [PubMed] [Google Scholar]
- This paper includes a summary of pre-clinical and early clinical data on FPAC
- 100·.Chen CC, et al. Detection of in vivo p-glycoprotein inhibition by PSC 833 using Tc-99m sestamibi. Clin. Cancer Res. 1997;3(4):545–552. [PubMed] [Google Scholar]
- This paper shows images of Pgp modulation in patients
- 101.Sparreboom A, et al. Clinical pharmacokinetics of doxorubicin in combination with GF120918, a potent inhibitor of mdr1 p-glycoprotein. Anti-Cancer Drugs. 1999;10(8):719–728. doi: 10.1097/00001813-199909000-00005. [DOI] [PubMed] [Google Scholar]
- 102.Araujo RP, Liotta LA, Petricoin EF. Proteins, drug targets and the mechanisms they control: The simple truth about complex networks. Nat. Rev. Drug Discov. 2007;6(11):871–880. doi: 10.1038/nrd2381. [DOI] [PubMed] [Google Scholar]
- 103.Terstappen GC, et al. Target deconvolution strategies in drug discovery. Nat. Rev. Drug Discov. 2007;6(11):891–903. doi: 10.1038/nrd2410. [DOI] [PubMed] [Google Scholar]
- 104·.Butcher EC, Berg EL, Kunkel EJ. Systems biology in drug discovery. Nat. Biotechnol. 2004;22(10):1253–1259. doi: 10.1038/nbt1017. [DOI] [PubMed] [Google Scholar]
- This is an excellent review of systems biology approached in drug discovery