

Abstract
Hsp90, an essential eukaryotic chaperone, depends upon its intrinsic ATPase activity for function. Crystal structures of the bacterial Hsp90 homolog, HtpG, and the yeast Hsp90 reveal large domain rearrangements between the nucleotide-free and the nucleotide-bound forms. Using small-angle x-ray scattering and newly developed molecular modeling methods, we describe the solution structure of HtpG and demonstrate how it differs from known Hsp90 conformations. In addition to this novel HtpG conformation, we demonstrate that under physiologically-relevant conditions, multiple conformations co-exist in equilibrium. In solution, nucleotide-free HtpG adopts a more extended conformation than observed in the crystal, and upon the addition of AMPPNP, HtpG is in equilibrium between this open state and a closed state that is in good agreement with the yeast AMPPNP crystal structure. These studies provide a unique view of Hsp90 conformational dynamics and provide a new model for the role of nucleotide in effecting conformational change.
Keywords: Hsp90, HtpG, molecular chaperone, SAXS, conformational dynamics, solution structure
Introduction
Hsp90, an essential eukaryotic protein, is a member of the molecular chaperone protein family that facilitates protein folding within the cell. Like the well-studied Hsp70 and GroEL chaperones, Hsp90 interacts with substrate proteins, known as client proteins, in an ATP-dependent manner (Young, et al., 2004). ATP binding and hydrolysis facilitates conformational changes in the chaperone that are required for client protein activation (Feltham and Gierasch, 2000; Grantcharova, et al., 2001; Mayer and Bukau, 2005; Richter and Buchner, 2001; Young, et al., 2004; Young, et al., 2001). Unlike Hsp70 and GroEL, however, Hsp90 appears to interact with client proteins at late stages along the protein folding pathway when the client proteins are in near-native state conformations (Freeman and Yamamoto, 2002; Picard, 2002; Pratt and Toft, 2003; Richter and Buchner, 2001; Young, et al., 2001; Zhao, et al., 2005). Hsp90 is believed to induce subtle conformational changes within its client proteins, promoting the binding and release of ligands or the interaction with partner proteins. Hsp90 binding also serves to protect some client proteins from ubiquitinylation and subsequent degradation (Caplan, et al., 2007; Whitesell and Lindquist, 2005). In eukaryotes, Hsp90 interacts with a broad array of client proteins that are dominated by signaling and regulatory proteins. These client proteins include serine/threonine and tyrosine kinases, steroid hormone nuclear receptors, transcriptions factors, and tumor suppressor proteins (Caplan, et al., 2007; Pearl and Prodromou, 2006; Picard, 2006; Richter and Buchner, 2001). Many of Hsp90’s client proteins, including Cdk4 and v-src, are oncogenic or otherwise required for cell proliferation, making Hsp90 an attractive target for anticancer therapeutics (Neckers, 2007). Inhibition of Hsp90 with small molecules such as geldanamycin and its derivatives has been shown to be antitumorigenic, and several of these compounds are currently in clinical trials (Chiosis, et al., 2003; Neckers and Ivy, 2003; Workman, 2004).
Given the significant differences in the interactions with client proteins, it is probable that Hsp90 has an underlying mechanism distinct from either Hsp70 or GroEL. Even though nucleotide binding and hydrolysis are required for the function of all three molecular chaperones, the relatively subtle structural transformations effected by Hsp90 on native-like client proteins may require a different mechanism for coupling ATP to chaperone conformational state. Moreover, Hsp90 is a constitutive dimer, and crystal structures show that in the nucleotide-free (apo) state, each of the three domains within each protomer (N-terminal (NTD), middle (MD), C-terminal (CTD)) expose hydrophobic surfaces that likely serve for client protein binding (Shiau, et al., 2006). Recent crystal structures show that binding of nucleotide to the NTD induces remarkably distinct conformational states that decrease (AMPPNP; (Ali, et al., 2006)) or completely bury (ADP; (Shiau, et al., 2006)) the exposed hydrophobic patches. These conformational changes presumably act to alter client protein structure and to modulate client protein binding. Although localized changes in the active site lid (residues 100–126), and the src loop (residues 281–296) are the origin of these vastly different conformational states, the overall changes are well described by rigid body domain rearrangements about flexible linkers separating the domains (Shiau, et al., 2006).
Although the crystal structures suggest a conformational pathway that is related to chaperone function, these structures are unlikely to describe all of the steps required for chaperone function. As was noted by Shiau and colleagues (Shiau, et al., 2006), the nucleotide-free state of Hsp90 is incompatible with nucleotide binding and thus the need for an intermediate structure was proposed. Recently, the full-length structure of the ER homolog, Grp94, was solved (Dollins, et al., 2007), showing a previously unknown conformation. While the Grp94 NTD-MD conformation is virtually the same as the apo bacterial Hsp90 (HtpG; (Huai, et al., 2005; Shiau, et al., 2006)), the overall conformation is more closed than HtpG, and more open than the AMPPNP bound yeast structure. Therefore, it may represent an intermediate state along the chaperone cycle. Other unknown intermediates may also exist at other steps along the chaperone functional cycle. Moreover, it is unclear whether the conformations observed in the crystals predominate in solution. To address these and related questions, we have investigated the structural properties of the E. coli homolog, HtpG, in solution using small angle X-ray scattering (SAXS). SAXS has previously been used to study human Hsp90. Using the radius of gyration (Rg) calculated from SAXS data, Zhang et al showed a compaction of Hsp90 upon the addition of the inhibitor geldanamycin (Zhang, et al., 2004). To gain more detailed structural information from the SAXS data, we have developed new robust molecular modeling methods that use the known structures as the starting point for rigid body refinement. From this analysis, we found novel conformations of HtpG in solution, and determined that a set of conformations can exist in equilibrium under physiologically relevant conditions. These results provide important new insights into the role of nucleotide in modulating Hsp90 conformation and have implications for substrate binding, the molecular mechanism of substrate activation, and the regulation of Hsp90.
Results
Scattering data for apo and AMPPNP bound HtpG
To investigate the effect of nucleotide on the solution conformation of HtpG, we collected SAXS data for apo HtpG and HtpG in the presence of a saturating concentration of the non-hydrolyzable ATP analog, AMPPNP. The scattering intensity, I(Q), was measured for scattering angles (Q=4πsinθ /λ) from 0.01 to 0.3Å−1 (Figure 1). The scattering data indicates that the apo and AMPPNP bound conformations in solution are distinct from one another (R=35.1% (R is analogous to the crystallographic R-factor, see Materials and Methods)). The radii of gyration (Rg) for both apo HtpG and HtpG-AMPPNP were calculated from the scattering data using the Guinier approximation. Apo HtpG has an Rg of 51.7Å, and HtpG-AMPPNP has an Rg of 47.5Å. The differences between the two conformations are even more apparent when comparing the interatomic distance distribution functions (P(r)) that can be directly computed from the I(Q) data by Fourier transform. The P(r) function provides a histogram of the interatomic distances found within the molecule giving information on shape as well as maximum size. As seen in Figure 1B, the distance distribution for HtpG-AMPPNP is narrower and has a smaller maximum interatomic distance. These differences indicate that the HtpG-AMPPNP bound state is considerably more compact than the apo state, which is qualitatively consistent with the known structures.
Figure 1. Experimental SAXS data for apo and AMPPNP-HtpG.
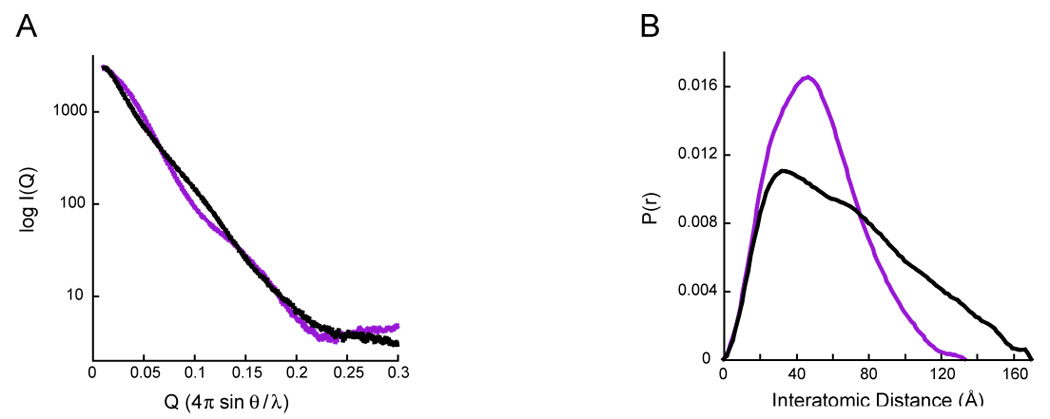
A) Averaged and scaled solvent-subtracted scattering curves (I(Q)) for full-length HtpG without nucleotide (black) and in the presence of saturating concentrations (10mM AMPPNP, purple).
B) Interatomic distance distribution functions (P(r)) calculated from the scattering data shown in panel A (black and purple for apo- and AMPPNP-HtpG, respectively). The P(r) curves are normalized to have equivalent areas under the curve. In solution, apo-HtpG is significantly expanded compared to the AMPPNP state.
Analysis of the apo state of HtpG in solution reveals a novel conformation of Hsp90
Even though the SAXS Rg values are generally consistent with the known structures, further investigation reveals that the observed P(r) data for apo HtpG deviates significantly from the P(r) function calculated from the apo crystal structure (R=26.2%, Figure 2). The solution conformation is also quite distinct from the apo Grp94 crystal structure (data not shown). In solution, apo HtpG has an Rg of 51.7Å, which is significantly larger than that calculated from the atomic coordinates of either apo HtpG (44.3Å), apo Grp94 (39.8Å), or a modeled AMPPNP HtpG (40.0Å, Figure 2A). While the location of P(r) peaks at ~40Å and ~80Å is consistent between the apo crystal structure and the solution conformation, suggesting the preservation of local structure, the solution conformation includes many interatomic distances larger than those seen in the crystal structure (Figure 2B). Both the Rg and the P(r) function demonstrate that HtpG is considerably more extended in solution than in either the apo or AMPPNP-bound crystal structures.
Figure 2. Comparing apo HtpG scattering data to the apo HtpG crystal structure.
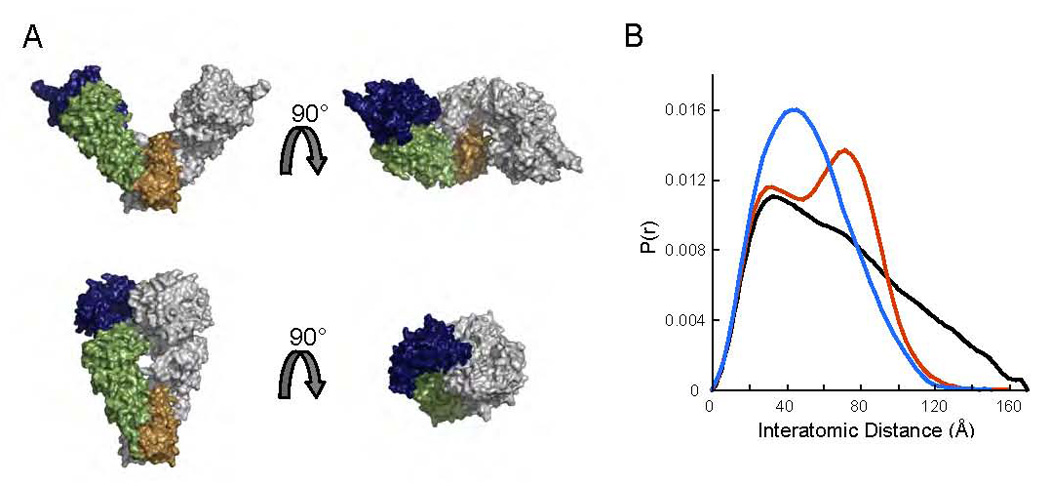
A) Crystal structure for apo HtpG (Shiau, et al., 2006) and the homology model for AMPPNP-HtpG based upon the yeast AMPPNP bound crystal structure (Ali, et al., 2006). The homology model was created by aligning the domains of HtpG to those of the yeast crystal structure. The NTD is shown in blue, the MD in green and the CTD in brown. The second monomer is shown in grey.
B) Normalized P(r) curves calculated from the apo crystal structure (red) and the AMPPNP-HtpG homology model (blue) compared to the normalized experimental P(r) for apo HtpG (black). Neither the apo or AMPPNP crystal structures match the experimental SAXS data.
Initial attempts at calculating a molecular envelope for HtpG in solution using established ab initio methods (Svergun, et al., 2001) failed to give a reproducible result even using perfect model data (data not shown). This may be a general problem of large, extended structures like the apo HtpG conformation. Since the crystal structures indicated that Hsp90 conformational rearrangements are well described by rigid-body domain movements (Shiau, et al., 2006), we used rigid body refinement of the known crystal structures to better model the SAXS data.
The simplest model for achieving the larger interatomic distances seen in the experimental data is to allow the two arms of the HtpG dimer to open and become more extended (Figure 3A). Examination of the apo crystal structure indicates that the interface between the MD and CTD is small, burying only 320 Å2 of surface area. Also, the two domains are connected by a long, flexible linker that could readily allow for such conformational flexibility (Shiau, et al., 2006). The plausibility of this region as a source of conformational flexibility is further enhanced by the observation that while otherwise quite similar, apo Grp94 pivots about a similar point to produce a narrower open angle (Dollins, et al., 2007). Finally, within the apo HtpG crystal, NTDs and MDs of different dimers interact, which could easily restrain the opening angle within the crystal (Shiau, et al., 2006).
Figure 3. Modeling the apo scattering data by altering the opening angle of the apo crystal structure.

A) Schematic showing the setup for the rigid body refinement protocol. The apo crystal structure is treated as three rigid bodies with the CTD dimerization domain’s orientation fixed. The orientations of the NM domains were then allowed to vary while maintaining the two-fold symmetry of the dimer.
B) Normalized P(r) showing the fit of the best model (red) to the apo experimental data (black).
C) The best fitting model (R = 3.03%) resulting from the rigid body refinement described in panel A. The opening angle between the monomers is ~75° in the apo crystal structure and expands to ~120° in the model, providing a greatly improved estimate of the structure of HtpG in solution.
In solution, the HtpG dimer is much more open than in the crystal
Using the simplest possible model to investigate the effect of the HtpG dimer opening angle on the fit to the SAXS data, we treated the dimer as three rigid bodies (Figure 3A). The dimerization interface between the two CTDs was held constant, and the configuration of the NTD relative to the MD was also kept fixed. Only the orientation of the combined NTD and MD (NM domain) relative to the dimerization domain was allowed to vary. A pivot point was set between the CTD and the MD along the flexible linker connecting the two domains and the rigid bodies were allowed to rotate along either a defined axis or via a general rotation. The rotation axis was determined by a comparison of the apo and AMPPNP-bound crystal structures. Using software developed in the Agard lab (PRFIT), a grid search was performed by rotating the NM domains in a two-fold symmetric manner about either the defined or general axis. Optionally, the axis orientation could be searched or refined in a least-squares manner. At each step, the P(r) function for the symmetric model was calculated and compared to experimental data. The model with the best fit to the experimental P(r) data (R = 4.40%) has each monomer rotated by ~25° relative to the apo crystal structure to create a considerably more open model (Figure 3). While this model accounts for the majority of the differences seen between the crystal structure and the experimental data, significant deviations are still present (Figure 3B). These differences are highly reliable and contain real information about the solution conformation of HtpG and cannot be accounted for by refining the rotations and translations of the combined NM domain. This observation suggests that there may also be conformational changes within the NM domain.
The apo NM domain of HtpG adopts a more extended conformation than that seen in the crystal structure
To test for alterations in the relative orientations of the NTD and MD in solution, we expressed and purified a truncation mutant of HtpG (residues 1–495, NM). This allowed us to directly examine the solution conformation of the isolated NM domain. We collected SAXS data in the absence of nucleotide from a Q of 0.009 to 0.3Å−1 with no signs of aggregation, and the calculated Rg was 30.9Å. This value contrasts with the predicted Rg of 27.7Å for the apo crystal structure, suggesting that even the isolated NM domain is more extended in solution than in the crystal. This conclusion is supported by comparison of the experimental (Figure 4; black) and predicted P(r) curve (blue) for the apo crystal structure. The Grp94 NM domain configuration is essentially identical to the HtpG NM domain from the apo crystal structure and thus produces an equivalent result (data not shown). There are three other known configurations of the NM domain (Ali, et al., 2006; Huai, et al., 2005; Shiau, et al., 2006), and these were also compared to the experimental SAXS data. Although the AMPPNP modeled structure provides the closest fit (green, R=4.06%), none of the known conformations accurately describes the experimental data (Figure 4).
Figure 4. Comparison of crystallographically-observed NM domain structures to that observed in solution by SAXS.

Volume representations of each of the four known NM domain configurations are shown with silhouettes representing the full-length structure that complements each configuration. The normalized P(r) curve for each structure (apo R=11.9%, AMPPNP R=4.06%, ADP extended R=7.64%, ADP compact R=48.8%) is shown in the corresponding color, and the experimental P(r) for NMHtpG is shown in black. While none of the calculated curves completely match the experimental data, the extended AMPPNP structure is best.
To explore if there were other NM domain arrangements that would better fit the experimental SAXS data, rigid body modeling was again performed, this time treating the NM domain as two separate but linked rigid bodies; the rigid NTD (residues 8–228) and MD (residues 232–493) were connected by flexible residues (residues 229–231). New software, built within the well-established IMP protein-modeling framework (Förster et al, in preparation; Sali and Blundell, 1993) was developed to more completely search the conformational space available to the NM domain. This methodology minimized a score S, which consisted of terms that account for the fit of the model I(Q) to the experimental data, stereochemistry of the linker atoms, volume clashes, and the statistical potential DOPE which seeks to provide well-packed interfaces (Materials and Methods). Optimization started from an initial model, which was obtained from the apo full-length crystal structure by a random rotation and translation of the MD around a pivot point at residue 230, keeping the NTD fixed. This randomly generated initial model was optimized through 50 rounds of a biased Monte-Carlo, simulated annealing algorithm; at each step, the model is randomly perturbed by approximately 3Å, locally optimized using quasi-Newton minimization and then accepted or rejected using the Metropolis criterion based on the total S score. The quasi-Newton minimization was required to efficiently produce physically realistic conformations. This entire process was repeated 500 times, resulting in 500 optimized models that covered a broad range of possible HtpG conformations largely consistent with the given input information. Initial modeling attempts returned unrealistic results with the N-terminal domain rotated about an axis that extends along the long axis of the middle domain. This rotation is inconsistent with any of the known structures and seemed to arise from the cylindrical nature of the MD at low resolution.
To better restrain the search, we aligned the middle domains of the known NM domain crystal structures and compared the rotations of the N-terminal domain. A second pivot point was found between residues 51 and 332. In subsequent modeling runs, these two residues were restrained to remain within 10Å of one another to prevent the unrealistic rotations of the N-terminal domain that we previously observed. This entire process was repeated to create 1000 models; the top 10% of the solutions were then clustered using pairwise root-mean squared deviations of corresponding Cα. atoms (Cα RMSD). Hierarchical clustering demonstrates that the top solutions fall into 3 well-populated groups, each with a mean RMSD of 2.6–2.9Å (Figure 5A). The top solution from each cluster gives an comparable and excellent fit to the experimental data, comparable to the quality of the fit in the unrestrained calculation (Figure 5B; green R=2.42%, red R=1.61%, gold R=1.71%) When aligning the solutions by the secondary structure of the middle domain, the solutions have significantly different orientations of the N-terminal domain (Figure 5C). However when the molecular envelopes are aligned, it can be seen that each solution occupies a similar volume (Figure 5D). The modeled volume was also consistent with ab initio bead models from the program GASBOR (Svergun, et al., 2001; data not shown). Given the low resolution of SAXS data, the different solutions are essentially identical and effectively represent different rotations of the nearly cylindrical MD about its axis. Notably, only these three rotations about the MD cylindrical axis were observed, presumably indicating that they were the only conformations allowed due to steric interactions between the domains. When aligned by their middle domains, there appears to be a simple rotational progression in NTD orientation going from apo crystal structure to our NM solution model to the AMPPNP state, perhaps defining a conformational trajectory (Figure S1 in the Supplemental Data). This suggests that our NM solution models represent an intermediate between the two previously seen states.
Figure 5. Modeling the SAXS data for the NMHtpG.

A) Clustering of the solutions from one modeling run of the NM domain data yields three well-populated groups.
B) P(r) curves for the top model from each cluster as compared to the experimental data shown in black. All the top models fit the experimental data.
C) Structure of the top models whose P(r) functions are shown in the corresponding color in B.
D) Alignment of the volumes of the models shown in panel C reveals they all have the same molecular volume. The differences result from rotations about the nearly cylindrical MD.
Modeling the full-length apo HtpG solution state discriminates between the different models for the NM domain
We are unable to differentiate the three top NM domain models because their shapes are indistinguishable at the resolution of the SAXS data. However, we reasoned that the solutions could be differentiated when in the context of the full-length model. When each of these models is grafted onto the full-length HtpG structure, the NTDs are oriented uniquely with respect to the CTD. The differences between the NM domain models are therefore accentuated in the context of the full-length models and should thus be distinguishable. The middle domains of the NM domain models were aligned with the middle domains of the apo crystal structure and the crystal structure NTD was replaced with the NTD from each of the NM domain models. Because the AMPPNP NM domain has a reasonable fit to the NM domain solution P(r) (Figure 4, green), we included it in the analysis, creating four new apo models. The initial fitting was done using the PRFIT program keeping the middle domains aligned for the four models. A clear preference was demonstrated for one model (Figure 6A, green, R=4.18%), and the AMPPNP NM domain scored much worse (Figure 6A, blue, R=9.64%).
Figure 6. Modeling the full-length apo SAXS data using different NM domain configurations.

A) P(r) curves were calculated for each of the full-length apo models using PRFIT. The middle domain of each model was kept aligned according to the secondary structure. The P(r) curves for the full-length apo models were compared to the experimental full-length apo SAXS data (black ◆). Each color represents a different NM domain configuration calculated from the NM domain experimental SAXS data, as shown in Figure 5. Blue (◆) represents the full-length model using the AMPPNP-bound NM domain.
B) The apo models in panel A were further refined using the rigid body modeling procedure implemented in IMP. Each model is shown in the same color as in panel A.
C) Residuals of the four different models as compared to the experimental full-length apo SAXS data reveals that one model (green curve) fits significantly better than the others (R=2.6%).
D) Structure of the best fitting model. The marked rotations show the transformations required to go from the apo crystal structure to the SAXS model.
The four models were further refined using the same minimization procedure as used for the NM domain modeling, this time focusing on motions about the MD-CTD interface. For each model, 1000 conformations were optimized, scored, and clustered. The resulting clusters had a mean Cα RMSD for the entire dimer of 7 to 10Å indicating that the conformations within each cluster do not deviate significantly from one another. We examined the top solution from each cluster and found that they occupied a similar volume, adding confidence in the solutions (Figure S2). In the modeling, the two-fold symmetry of the dimer was restrained, but not rigidly enforced, allowing each solution to be slightly asymmetrical. The symmetry pairs for each monomer drawn from the top solution of each cluster were made and the symmetric models were rescored. This process was repeated for each of the four models, and the top solution for each NM domain configuration was compared (Figure 6B, C). All of the models show a more open and extended structure with a larger cleft between the two monomers as seen in the initial model and a more elongated NM domain (Figure 6D). Because the NM domain models and the AMPPNP NM domain occupy similar volumes there is some ambiguity in the positioning of the NM domain relative to the CTD. However, difference plots (Figure 6C) demonstrate that one solution (Figure 6D) scored better than the others. This NM domain configuration also scored the best in the initial PRFIT modeling (Figure 6A), suggesting that it was the best choice for the positioning of the NM domain.
Finally, to ascertain how well defined is the predicted structure, we allowed small rotations (up to ±10°) of the arms of the dimer along each of the three primary axis x, y, and z and the resulting conformations were rescored against the experimental data. The solution conformation appears to be well defined, as small deviations in conformation along any of the three axes cause the fit to the experimental data to rapidly fall off (Figure S3), and as was already demonstrated, variations in the NM domain are also not tolerated by the data.
SAXS analysis of HtpG-AMPPNP reveals a mixture of two populations in solution
After demonstrating that the apo solution structure varied significantly from the crystal structure, it was important to determine if the same was true for the AMPPNP bound form of HtpG. Not only was the crystal structure from a different species (yeast), but it was also in complex with the yeast p23 cochaperone (Ali, et al., 2006). To control for differences in sequence between the two proteins, we created a homology model by aligning the HtpG domains with the domains of the yeast protein structure (Figure 2A). The P(r) function calculated from the homology model was compared to the experimental P(r) recorded with saturating concentrations of AMPPNP (Figure 7A). The predicted Rg for the crystal structure of 40.1Å is significantly smaller than that actually observed (47.5Å), suggesting that the solution structure is less compact than the crystal. As in the case of the apo protein, the P(r) functions overlay well between 0 and 20Å indicating that the structure within the individual domains remains relatively unchanged. Once again rigid body modeling was used to fit the AMPPNP SAXS data. However, in this case rigid body modeling was unable to fit the experimental data well (data not shown).
Figure 7. Modeling the HtpG:AMPPNP scattering data.
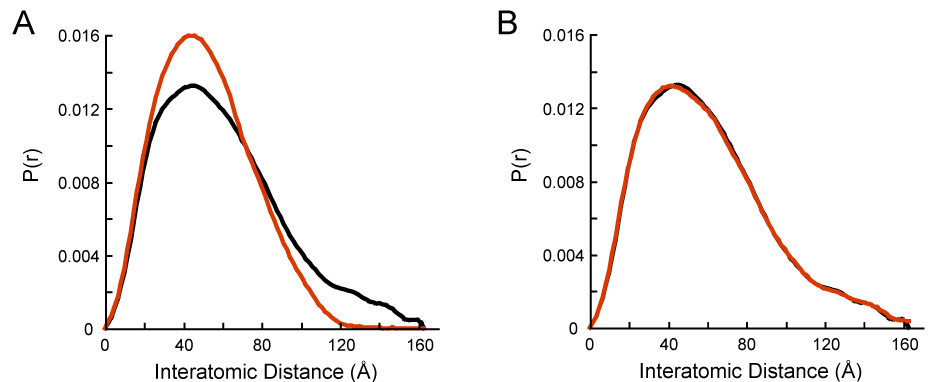
A) Normalized P(r) for the AMPPNP-HtpG homology model shown in Figure 2A (red) compared to the experimental P(r) for AMPPNP-HtpG (black).
B) Modeling the HtpG:AMPPNP experimental data (black) using a linear combination (red) of 44.5% of the AMPPNP-bound model in Figure 2A and 55.5% of the apo solution structure shown in Figure 6. Even with saturating nucleotide, there is an equilibrium between open and closed states.
A striking feature of the HtpG-AMPPNP SAXS data in comparison to the crystal structure is that the position of the peak in the two P(r) functions lines up perfectly (Figure 7A). The differences between the two curves lie at larger distances where a second population of distances appears in the solution data. This suggests that the HtpG-AMPPNP SAXS data corresponds to a mixture of populations. One population similar to the crystal structure could account for the peak, and a second more extended population could account for the larger distances. By reexamining the distance distribution of the apo solution model, it became apparent that the shape of the distance distribution function at larger distances in the HtpG-AMPPNP data looked similar to that from the apo solution structure. The simplest model was therefore that the HtpG-AMPPNP SAXS data represented a mixture of two populations, one corresponding to the known AMPPNP bound structure and the other corresponding to the apo solution conformation. We calculated linear combinations of the P(r) curves derived from the AMPPNP bound model (Figure 2B) and the apo HtpG SAXS data and compared them to the HtpG-AMPPNP SAXS data. An excellent fit (R= 1.03%) is obtained using a mixture of 46% AMPPNP crystal conformation and 54% of the full-length apo solution data (Figure 7B).
Discussion
Determining structures from SAXS data is an underdetermined problem. That is, multiple solutions potentially have similar fits to the experimental data. Our newly developed modeling methods were designed to fully explore this possibility. Our Metropolis Monte Carlo simulated annealing optimization strategy allows a very large number of possible configurations to be thoroughly explored and the inclusion of pseudo energy terms, such as the DOPE potential, provides additional restraints to help pick the optimal solution. The resultant models were clustered based on both structural deviations and quality, resulting in a small number of discrete solutions. As seen in the case of the NM data, several different domain configurations were discovered that gave similar fits to the experimental data. To the resolution of the SAXS data, these different configurations, which are easily distinguishable by the positioning of secondary structure elements, occupy essentially indistinguishable volumes. In the case of HtpG, this ambiguity was greatly reduced by placing these models in the context of the full-length structures where the single best solution could then be selected. Similarly, although the modeled AMPPNP NM structure also provides a reasonable fit to the NM SAXS data, it requires a very large rotation (80°) about the MD vertical axis to fit the full-length solution data and gave a worse fit at multiple stages of the optimization process. Together, this suggests that our modeled conformation is the most appropriate choice. The full-length solution also appears to be well determined in terms of the positioning of the middle domain relative to the C-terminal domain. A small rotation of the arms in the x, y, or z directions causes large changes in the fit to the experimental data, suggesting that the full-length structure is well defined by the SAXS data.
Our SAXS data and modeling reveal that rigid body motions about junctions in both domain interfaces are required to accurately describe the apo HtpG solution structure. In the crystal, apo HtpG dimers form long, interlocking fibrils (Shiau, et al., 2006) that apparently dictate the opening angle of the dimer cleft. By contrast, in solution, the HtpG dimer preferentially adopts a more extended conformation that is quite different from any of the crystal structures. This extension may have an impact on the size of client proteins that can be recognized. Extensive modeling studies exploring linear combinations of conformations (data not shown) suggest that a well-defined conformation dominates in solution. However, given that rather weak crystal packing forces can significantly distort this angle, it seems likely that Hsp90 is able to alter its opening angle to accommodate the diverse sizes and shapes of its protein substrates (Figure 8A, B).
Figure 8. Implications for the discussed results on the function of Hsp90.

A, B) Potential substrate binding modes of Hsp90. Panel A shows the extended solution structure that could bind large substrates on the order of 130Å. Panel B shows the Progesterone receptor ligand-binding domain (1SQN; (Madauss, et al., 2004) docked to the crystal structure of Hsp90, demonstrating how Hsp90 may bind smaller client proteins. As proposed by (Fang, et al., 2006), the CTD amphipathic helix could readily displace the ligand-gated helix12 of the receptor.
C) Model for the effects of ATP on Hsp90 conformation: In the unliganded state HtpG is in an open state that is relatively flat and has a large cleft that is accessible for client protein binding. Once ATP is bound, an equilibrium is established between the open state and a compact closed state.
In the SAXS solution conformation, the orientation of the N-terminal domain with respect to the middle domain is also different from any of the observed crystal structure conformations (apo, AMPPNP, ADP extended, ADP compact). The solution data indicates an arrangement where the NTD is rotated away from the MD by 40° in comparison to the apo crystal structure. This difference may have consequences for the ability of the NTD to bind nucleotide. The arrangement of the N-terminal and middle domains in the apo crystal structure is incompatible with nucleotide binding. Gln 122 and Phe 123 from a conserved structural element known as “the active site lid” (residues 100–126) are positioned to directly block nucleotide binding in the apo structure. Nucleotide binding requires that this lid region be reorganized, however this reorganization would lead to steric clashes between the NTD and the MD (Shiau, et al., 2006) that can only be relieved by repositioning the NTD. The more extended NTD-MD conformation seen in both the free NTD-MD fragment and the intact apo HtpG in solution could accommodate the necessary repositioning of the lid, allowing nucleotide to bind. Whether the more closed NTD-MD configuration seen in the crystal is physiologically relevant, for example by being in equilibrium with the conformation determined here, will need to be explored.
In the presence of saturating concentrations of AMPPNP, HtpG can adopt the same conformation as observed in the crystal structure of the yeast ortholog when complexed with the cochaperone p23. Despite their evolutionary distance, this similarity provides further evidence for the common structural and mechanistic behavior of the prokaryotic and eukaryotic Hsp90s and suggests that p23 binding does not significantly alter the intrinsic ATP-state conformation. The prevailing model of the Hsp90 chaperone cycle posits that Hsp90 progresses through a series of nucleotide dependent conformations in a step-wise mechanism, in a similar manner as Hsp70 or GroEL. Our analysis of the solution scattering data from HtpG shows that the mechanistic cycle of Hsp90 is not a deterministic process. Instead, the chaperone cycle of Hsp90 is better understood as a largely stochastic process in which AMPPNP biases, but does not uniquely determine, the conformational equilibrium between our newly determined HtpG open-extended state and the closed AMPPNP bound state seen in the crystal structure of full-length yeast Hsp90 bound to AMPPNP (Figure 8C). While the open-closed equilibrium described here was observed for the bacterial homolog, reports from Frey et al suggest that this equilibrium is important for other Hsp90 homologs as well (Frey, et al., 2007). Using kinetic studies they report that 97% of Grp94 is found in an open state when ATP is bound, and for yeast Hsp90 only 20% is found in the open state upon the binding of ATP (Frey, et al., 2007). Previous SAXS studies on human Hsp90 have shown that the binding of ATP causes no significant change in the Rg of the protein (Zhang, et al., 2004), suggesting that like Grp94, the ATP-dependent equilibrium for the human Hsp90 lies mainly in the direction of the open state. It seems likely that these differences represent species-specific optimizations in regulating the chaperone cycle of Hsp90, and the origins of these differences warrant further study. While this work focuses on the apo and ATP states of HtpG, the ADP-bound state is also of interest. Initial SAXS experiments have been carried out for HtpG in the presence of ADP, however, the analysis has proven to be complicated and is currently in progress.
The discovery of a dynamic equilibrium between an open state and a closed state, both of which are bound to AMPPNP, has important implications for the mechanism of Hsp90 action. First, it places limitations on the amount of energy available from ATP binding that could be utilized to drive substrate activation. Secondly, it suggests that ATP hydrolysis and subsequent release of ADP or Pi could be the energetically most demanding steps in the cycle, much as in myosin (White and Taylor, 1976), and these steps could be coupled to client protein release. Additionally, the binding of client proteins to Hsp90 may affect the equilibrium between the two conformations, favoring or disfavoring the closed state, thereby altering the rates of ATP hydrolysis. Cytosolic eukaryotic Hsp90s are known to require a number of cochaperones for correct in vivo function. By contrast, no Hsp90 cochaperones, which could preferentially stabilize particular conformational states, have been discovered in prokaryotes. Thus while eukaryotes could utilize cochaperone binding to alter the Hsp90 conformational equilibrium, prokaryotic Hsp90s might rely solely on the dynamic equilibrium for function, and thus be less efficient than their eukaryotic orthologs.
These insights into the mechanism of Hsp90 highlight the importance of studying the structure and dynamics of Hsp90 in solution. Not only have we been able to identify novel conformations of the bacterial Hsp90, but we have determined that the binding of nucleotide affects conformation differently then previously thought. Using crystallography studies alone, it would have been extremely difficult to dissect the role of a conformational equilibrium as part of the chaperone cycle. Similar solution studies can now be conducted to investigate the potential of other intermediate conformations in the cycle and to further investigate the dynamics of the currently known conformations. These results also provide critical insights into the energetics of substrate activation and are an important step in better understanding the molecular mechanism of Hsp90.
Materials and Methods
Protein Expression and Purification
Full-length HtpG (residues 1–624) was cloned into pET29b (Invitrogen) and the HtpG truncation mutant, NMHtpG (residues 1–495) was cloned into pET151 using the TOPO cloning system (Invitrogen). Both constructs were expressed in E. coli using BL21(DE3) cells (Invitrogen). The full-length protein was purified by successive passage over DE52 (Whatman), monoQ and gel filtration (Amersham Biosciences) columns with a final buffer of 20mM Tris pH 7.5, 100mM NaCl. NMHtpG was first passed over Ni-NTA agarose and the collected peak was cleaved with TEV overnight. The cleaved protein was then purified by gel filtration (Amersham Biosciences) into a final buffer of 20 mM Tris pH 7.5 and 100 mM NaCl. The purified proteins were collected and concentrated using 10 kD molecular weight cutoff Amicon Ultra spin concentrators (Millipore). Using a desalting column (GE Healthcare) the samples were exchanged into 50 mM Tris pH 7.5 or pH 9, 50 mM KCl, 10 mM MgCl2, and 1 mM DTT. Using Millipore Ultrafree®-0.5 Centrifugal Filter Units, samples were concentrated to between 10 and 30mg/ml as estimated by absorbance at 280 nm. The A260 nm/A280 nm ratio was measured as < 0.6 giving confidence that no nucleotide was present in the purified sample. Samples were split into two aliquots and 10 mM AMPPNP was added to one aliquot. Samples were then flash frozen in liquid nitrogen and stored at −80°C. Samples with AMPPNP were kept at pH 7.5 whereas samples with no nucleotide were used at both pH 7.5 and pH 9. Other measurements, including negative stain electron microscopy (D. Southworth, unpublished data), suggest that the apo sample is more homogenous at pH 9.
SAXS data collection
Initial SAXS measurements were collected at beamline 4-2 at the Stanford Synchrotron Radiation Laboratory (SSRL) and at the BioCAT beamline (18-ID) at the Advanced Photon Source (APS). Data reported here was collected at SSRL beamline 4-2 and at the SIBYLS beamline (12.3.1) at the Advanced Light Source (ALS). To minimize aggregation, samples were spun in a table top microcentrifuge for 5 minutes immediately before data collection. Data was then collected at 25°C at 2.5, 5 and 10mg/ml. At the ALS, samples were exposed for 7 and 70 seconds at a detector distance of 1.6m. At SSRL, samples were exposed for five 30 second exposures at a detector distance of 2.5m. The data was collected on a Mar165CCD detector, and the detector channels were converted to Q = 4πsinθ/λ, where 2θ is the scattering angle and λ is the wavelength, using a silver behenate sample as a calibration standard. The data was circularly averaged over the detector and normalized by the incident beam intensity.
SAXS data analysis
The raw scattering data, I(Q), were scaled and the buffers were subtracted. Variations were seen in the amplitude of the high Q data for data sets that should be identical. To correct for this variation, data from multiple concentrations were linearly extrapolated to the buffer background signal. The experimental buffers were then scaled to match the calculated buffer background signal. This correction was only necessary for precise comparison to molecular models and did not affect the overall shape of either the scattering curves or the interatomic distance profiles (P(r)). Individual scattering curves for a given nucleotide condition collected at different concentrations and over different scattering angle ranges were scaled and merged to yield a single low-noise average scattering curve. The radii of gyration (Rg) were initially calculated from the Guinier plot as implemented in the program PRIMUS (Konarev, et al., 2003). The interatomic distance distribution functions (P(r)) were then calculated using the program GNOM (Svergun, 1992). Dmax was determined by constraining the rmax to zero and then varying rmax between 160 and 190Å. The rmax that yielded an Rg that best matched the Rg calculated from the Guinier plot and had the highest “total estimate” was chosen as Dmax.
Molecular modeling of the scattering data
Two strategies were employed for modeling: a rigid body grid search/least squares refinement method (PRFIT) and a more comprehensive modeling strategy developed within IMP (Sali and Blundell, 1993). In PRFIT, an exhaustive rotational grid search could be made about defined axes (derived from comparison of crystal structures) separating the NTD and MD domains and/or the MD and CTD domains. Alternatively completely arbitrary rotations could be made about a pivot point separating either set of domains. For the modeling described here, strict two-fold dimer symmetry was enforced. To simplify the calculations, the shape of all atoms was assumed to be identical, while the electron content was based on the solvent-corrected electron scattering factors for each atom type (Fraser, et al., 1978). For each conformation, the calculated Pcalc(r) was scaled and compared to the experimentally derived Pobs(r) using an R factor metric similar to that routinely used in X-ray crystallography (R = Σ | |Pobs(r) | - |Pcalc(r)| | / Σ |Pobs(r)|). Optionally, at each grid step or at the end, the rotations and/or translations about the pivot point could be refined by several cycles of least-squares minimization. Additionally, linear combinations of either adjustable or rigid models (total of 3 simultaneous search angles) could be combined at each grid step using a completely deterministic linear least-squares scaling procedure.
The more extensive simultaneous rotation/translation optimization strategy protocol was implemented in IMP to minimize a combined score S (described in more detail in (Förster et al, in preparation)). In brief, the score S of a given model, consisted of the sum of several individual scores: S = SSAXS + Sstereo + Sclash + SDOPE + Ssym, where SSAXS measures the violation of SAXS data, I(Q), Sstereo accounts for stereochemistry according to the CHARMM force-field(MacKerell Jr., et al., 1998), Sclash measures steric clashes, SDOPE, is a statistical potential meant to describe the quality of the domain interface(Shen and Sali, 2006), and Ssym is used to enforce an approximate two-fold symmetry by ensuring that the differences in pair-wise distances within symmetric subunits were small. Similar to previous approaches to modeling based on SAXS data (Svergun, 1999), we chose SSAXS essentially as the squared deviation between the experimental SAXS data and the calculated SAXS spectrum of the model. To calculate the SAXS spectrum of the model, we use the Debye model (Debye, 1915) because it enabled us to use gradient-based optimization algorithms.
To sample different minima of S, many independent optimizations were carried out starting from different random initial configurations. For the modeling of the NTD-MD construct, 500 initial configurations were obtained from the apo crystal structure (Shiau, et al., 2006) by rotating the MD around an arbitrary axis by an angle of 0–360° and allowing for a random translation of up to 10Å. Based on the known crystal structures (Ali, et al., 2006;Huai, et al., 2005;Shiau, et al., 2006), residues 229–231 were defined as a flexible linker. For the full-length HtpG model, 1000 initial configurations were obtained by rotations of the NTD-MD domain around residue 493. Random orientations were chosen within a maximum angular range of ±50°. In addition, a random translation of less than 5Å was applied. The two-fold symmetry was maintained for the initial configurations. Residues 494–500, which are not resolved in the crystal structures, were defined as flexible linkers.
The optimization protocol was a biased Monte Carlo minimization: first, each model was optimized using a quasi-Newton optimization. Next, the model was iteratively perturbed and subsequently optimized. The model was accepted as the input for the next iteration according to the Metropolis criterion. 50 refinement iterations were carried out for each model, exponentially decreasing the temperature at each iteration. For the final 25 interations, SDOPE was added to the score S. The 10 % best-scoring models according to SSAXS were retained for hierarchical clustering based on the pair-wise Cα RMSD for all pairs of the models (MATLAB, The Mathworks, Inc.). As a threshold for the clustering we chose 4Å for the NTD-MD construct and 14 Å for the full-length HtpG models.
Supplementary Material
Acknowledgements
Funding for this project was provided by the Howard Hughes Medical Institute and a UC Discovery Grant (bio03-10401/Agard) as well as NIH PN2 EY016525 (Sali). K.A.K was supported by a NSDEG Graduate Fellowship. F.F. is grateful to a long-term fellowship from the Human Frontier Science Project Organization (HFSPO). We wish to thank the staff at the Advanced Light Source (ALS) SIBYLS beamline 12.3.1 (especially G. Hura), the Stanford Synchrotron Radiation Laboratory (SSRL) beamline 4-2 (especially H. Tsuruta) and the Advanced Photon Source (APS) Biocat beamline 18-ID. A special thanks to C. Cunningham, D. Southworth, U. Boettcher, T. Street, and L. Lavery for many helpful discussions and comments on the manuscript.
Footnotes
Publisher's Disclaimer: This is a PDF file of an unedited manuscript that has been accepted for publication. As a service to our customers we are providing this early version of the manuscript. The manuscript will undergo copyediting, typesetting, and review of the resulting proof before it is published in its final citable form. Please note that during the production process errors may be discovered which could affect the content, and all legal disclaimers that apply to the journal pertain.
References
- Ali MM, Roe SM, Vaughan CK, Meyer P, Panaretou B, Piper PW, Prodromou C, Pearl LH. Crystal structure of an Hsp90-nucleotide-p23/Sba1 closed chaperone complex. Nature. 2006;440:1013–1017. doi: 10.1038/nature04716. [DOI] [PMC free article] [PubMed] [Google Scholar]
- Caplan AJ, Mandal AK, Theodoraki MA. Molecular chaperones and protein kinase quality control. Trends Cell Biol. 2007;17:87–92. doi: 10.1016/j.tcb.2006.12.002. [DOI] [PubMed] [Google Scholar]
- Chiosis G, Lucas B, Huezo H, Solit D, Basso A, Rosen N. Development of purine-scaffold small molecule inhibitors of Hsp90. Curr. Cancer Drug Targets. 2003;3:371–376. doi: 10.2174/1568009033481778. [DOI] [PubMed] [Google Scholar]
- Debye P. Zerstreuung von Roentgenstrahlen. Annalen der Physik. 1915;46:809–823. [Google Scholar]
- Dollins DE, Warren JJ, Immormino RM, Gewirth DT. Structures of GRP94-nucleotide complexes reveal mechanistic differences between the Hsp90 chaperones. Mol. Cell. 2007;28:41–56. doi: 10.1016/j.molcel.2007.08.024. [DOI] [PMC free article] [PubMed] [Google Scholar]
- Fang L, Ricketson D, Getubig L, Darimont B. Unliganded and hormone-bound glucocorticoid receptors interact with distinct hydrophobic sites in the Hsp90 C-terminal domain. Proc. Natl. Acad. Sci. USA. 2006;103:18487–18492. doi: 10.1073/pnas.0609163103. [DOI] [PMC free article] [PubMed] [Google Scholar]
- Feltham JL, Gierasch LM. GroEL-substrate interactions: molding the fold, or folding the mold. Cell. 2000;100:193–196. doi: 10.1016/s0092-8674(00)81557-3. [DOI] [PubMed] [Google Scholar]
- Fraser RDB, MacRae TP, Suzuki E. An improved method for calculating the contribution of solvent to the X-ray diffraction pattern of biological molecules. J. Appl. Crystallogr. 1978;11:693–694. [Google Scholar]
- Freeman BC, Yamamoto KR. Disassembly of transcriptional regulatory complexes by molecular chaperones. Science. 2002;296:2232–2235. doi: 10.1126/science.1073051. [DOI] [PubMed] [Google Scholar]
- Frey S, Leskovar A, Reinstein J, Buchner J. The ATPase cycle of the endoplasmic chaperone Grp94. J. Biol. Chem. 2007;282:35612–35620. doi: 10.1074/jbc.M704647200. [DOI] [PubMed] [Google Scholar]
- Grantcharova V, Alm EJ, Baker D, Horwich AL. Mechanisms of protein folding. Curr. Opin. Struct. Biol. 2001;11:70–82. doi: 10.1016/s0959-440x(00)00176-7. [DOI] [PubMed] [Google Scholar]
- Huai Q, Wang H, Liu Y, Kim HY, Toft D, Ke H. Structures of the N-terminal and middle domains of E. coli Hsp90 and conformation changes upon ADP binding. Structure. 2005;13:579–590. doi: 10.1016/j.str.2004.12.018. [DOI] [PubMed] [Google Scholar]
- Konarev PV, Volkov VV, Sokolova AV, Koch MHJ, et al. PRIMUS: a Windows PC-based system for small-angle scattering data analysis. J. Appl. Crystallogr. 2003;36:1277–1282. [Google Scholar]
- MacKerell AD, Jr, Bashford D, Bellot M, Dunbrack RL, Jr, Evanseck JD, Field MJ, Fischer S, Gao J, Guo H, Ha S, et al. All-atom empirical potential for molecular modeling and dynamic studies of proteins. J. Phys. Chem. B. 1998;102:3586–3616. doi: 10.1021/jp973084f. [DOI] [PubMed] [Google Scholar]
- Madauss KP, Deng SJ, Austin RJ, Lambert MH, McLay I, Pritchard J, Short SA, Stewart EL, Uings IJ, Williams SP. Progesterone receptor ligand binding pocket flexibility: crystal structures of the norethindrone and mometasone furoate complexes. J. Med. Chem. 2004;47:3381–3387. doi: 10.1021/jm030640n. [DOI] [PubMed] [Google Scholar]
- Mayer MP, Bukau B. Hsp70 chaperones: cellular functions and molecular mechanism. Cell. Mol. Life Sci. 2005;62:670–684. doi: 10.1007/s00018-004-4464-6. [DOI] [PMC free article] [PubMed] [Google Scholar]
- Neckers L. Heat shock protein 90: the cancer chaperone. J. Biosci. 2007;32:517–530. doi: 10.1007/s12038-007-0051-y. [DOI] [PubMed] [Google Scholar]
- Neckers L, Ivy SP. Heat shock protein 90. Curr. Opin. Oncol. 2003;15:419–424. doi: 10.1097/00001622-200311000-00003. [DOI] [PubMed] [Google Scholar]
- Pearl LH, Prodromou C. Structure and mechanism of the Hsp90 molecular chaperone machinery. Annu. Rev. Biochem. 2006;75:271–294. doi: 10.1146/annurev.biochem.75.103004.142738. [DOI] [PubMed] [Google Scholar]
- Picard D. Heat-shock protein 90, a chaperone for folding and regulation. Cell. Mol. Life Sci. 2002;59:1640–1648. doi: 10.1007/PL00012491. [DOI] [PMC free article] [PubMed] [Google Scholar]
- Picard D. Chaperoning steroid hormone action. Trends Endocrinol. Metab. 2006;17:229–235. doi: 10.1016/j.tem.2006.06.003. [DOI] [PubMed] [Google Scholar]
- Pratt WB, Toft DO. Regulation of signaling protein function and trafficking by the Hsp90/Hsp70-based chaperone machinery. Exp. Biol. Med. (Maywood) 2003;228:111–133. doi: 10.1177/153537020322800201. [DOI] [PubMed] [Google Scholar]
- Richter K, Buchner J. Hsp90: chaperoning signal transduction. J. Cell. Physiol. 2001;188:281–290. doi: 10.1002/jcp.1131. [DOI] [PubMed] [Google Scholar]
- Sali A, Blundell TL. Comparative protein modelling by satisfaction of spatial restraints. J. Mol. Biol. 1993;234:779–815. doi: 10.1006/jmbi.1993.1626. [DOI] [PubMed] [Google Scholar]
- Shen MY, Sali A. Statistical potential for assessment and prediction of protein structures. Protein Sci. 2006;15:2507–2524. doi: 10.1110/ps.062416606. [DOI] [PMC free article] [PubMed] [Google Scholar]
- Shiau AK, Harris SF, Southworth DR, Agard DA. Structural analysis of E. coli Hsp90 reveals dramatic nucleotide-dependent conformational rearrangements. Cell. 2006;127:329–340. doi: 10.1016/j.cell.2006.09.027. [DOI] [PubMed] [Google Scholar]
- Svergun DI. Determination of the regularization parameter in indirect-transform methods using perceptual criteria. J. Appl. Crystallogr. 1992;25:495–503. [Google Scholar]
- Svergun DI. Restoring low resolution structure of biological macromolecules from solution scattering using simulated annealing. Biophys. J. 1999;76:2879–2886. doi: 10.1016/S0006-3495(99)77443-6. [DOI] [PMC free article] [PubMed] [Google Scholar]
- Svergun DI, Petoukhov MV, Koch MHJ. Determination of domain structure of proteins from X-ray solution scattering. Biophys. J. 2001;80:2946–2953. doi: 10.1016/S0006-3495(01)76260-1. [DOI] [PMC free article] [PubMed] [Google Scholar]
- White HD, Taylor EW. Energetics and mechanism of actomyosin adenosine triphosphatase. Biochemistry. 1976;15:5818–5826. doi: 10.1021/bi00671a020. [DOI] [PubMed] [Google Scholar]
- Whitesell L, Lindquist SL. Hsp90 and the chaperoning of cancer. Nat. Rev. Cancer. 2005;5:761–772. doi: 10.1038/nrc1716. [DOI] [PubMed] [Google Scholar]
- Workman P. Altered states: selectively drugging the Hsp90 cancer chaperone. Trends Mol. Med. 2004;10:47–51. doi: 10.1016/j.molmed.2003.12.005. [DOI] [PubMed] [Google Scholar]
- Young JC, Agashe VR, Siegers K, Hartl FU. Pathways of chaperone-mediated protein folding in the cytosol. Nat. Rev. Mol. Cell. Biol. 2004;5:781–791. doi: 10.1038/nrm1492. [DOI] [PubMed] [Google Scholar]
- Young JC, Moarefi I, Hartl FU. Hsp90: a specialized but essential protein-folding tool. J. Cell Biol. 2001;154:267–273. doi: 10.1083/jcb.200104079. [DOI] [PMC free article] [PubMed] [Google Scholar]
- Zhang W, Hirshberg M, McLaughlin SH, Lazar GA, et al. Biochemical and structural studies of the interaction of Cdc37 with Hsp90. J. Mol. Biol. 2004;340:891–907. doi: 10.1016/j.jmb.2004.05.007. [DOI] [PubMed] [Google Scholar]
- Zhao R, Davey M, Hsu YC, Kaplanek P, Tong A, Parsons AB, Krogan N, Cagney G, Mai D, Greenblatt J, et al. Navigating the chaperone network: an integrative map of physical and genetic interactions mediated by the Hsp90 chaperone. Cell. 2005;120:715–727. doi: 10.1016/j.cell.2004.12.024. [DOI] [PubMed] [Google Scholar]
Associated Data
This section collects any data citations, data availability statements, or supplementary materials included in this article.