

Abstract
Cell crawling is an important biological phenomenon because it underlies coordinated cell movement in morphogenesis, cancer and wound healing. This phenomenon is based on protrusion at the cell's leading edge, retraction at the rear, contraction and graded adhesion powered by the dynamics of actin and myosin protein networks. A few one-dimensional models successfully explain an anteroposterior organization of the motile cell, but don't sufficiently explore the viscoelastic nature of the actin-myosin gel. We develop and numerically solve a model of a treadmilling strip of viscoelastic actin-myosin gel. The results show that the strip translocates steadily as a traveling pulse, without changing length, and that protein densities, velocities and stresses become stationary. The simulations closely match the observed forces, movements and protein distributions in the living cell.
Keywords: Cell motility, Actin, Myosin, Lamellipodium, Viscoelastic, Treadmilling
1. Introduction
Understanding the mechanics of cell crawling is important for explaining cancer cell metastasis, skin fibroblast migration in wound healing and white blood cell locomotion during tissue inflammation [1]. These cells crawl on surfaces by using a simple mechanical cycle [1] consisting of protrusion, adhesion, and contraction. The gel of actin polymers protrudes at the cell front and pushes out the cell's leading edge. Next, the cell strengthens its adhesions to the surface at the leading edge and weakens them at the rear edge. Finally, myosin molecular motors contract the actin gel enabling the cell to pull up its rear. In reality, these steps take place continuously and simultaneously in a coordinated fashion, with many other molecules involved in regulation of the cell speed and shape.
Significant progress has been made in understanding the molecular events of protrusion, adhesion, and contraction as well as the structural organization and biophysics of the migrating cells [2–5]. However, the mechanics of cell crawling is still not understood in detail. Perhaps the most important information comes from Ref. [2], which reports results of electron microscopy of fish keratocyte cells. These cells “glide” on surfaces at constant speed without changing their shape, and they are for the most part remarkably flat. At the front of the cell rod-like actin polymers (F-actin) are crosslinked into well ordered, relatively rigid gel [6]. The polymers grow at the leading edge generating protrusion and are firmly attached to the surface by transmembrane protein complexes [5]. Myosin molecular motors are distributed evenly near the front, but are apparently unable to perturb the firm actin gel. Closer to the center of the cell, actin fibers depolymerize. This, together with the gradual detachment of the crosslinking molecules, weakens the actin network mechanically and allows myosin to generate contractile stresses and to deform the actin-myosin network. At the same time, the adhesion complexes assembled at the front “age” and begin to disassemble, allowing the myosin-powered contraction to pull the bulk of the cell forward [5].
This qualitative picture is complemented by recent quantitative measurements yielding a map of F-actin “flow”—the speed of the local displacement of the actin-myosin network relative to the surface as a function of the position in the cell [4]. Roughly speaking, the flow is oriented from the edges to the center of the cell. This data can be used to test models' validity. Additionally, a great number of studies investigate mechanical properties of actin gels, migrating cells and myosin complexes [6–12]. These studies indicate that in general the actin-myosin gels have very complex viscoelastic properties best approximated by a combination of nonlinear Maxwell and Kelvin–Voight models [7,10]. Finally, a remarkable experiment that excised the part of the cell containing just actin-myosin gel but not the nucleus or other organelles [3] demonstrates that the cell fragment can move with the same rate and shape as the whole cell. Thus, motility is a property of the actin–myosin gel alone. This experiment also revealed a fascinating mechanical bi-stability of the cell fragment: the fragment either remains stationary keeping a disk-like shape, with myosin concentrated at the center and F-actin exhibiting slow centripetal flow, or, when prodded with a micropipette, the fragment assumes a crescent-like shape and moves persistently with myosin at the rear and F-actin flowing inward.
Quantitative models are very useful in the understanding of cell motility, as they allow the examination of hypotheses about molecular mechanisms by testing how model results depend on assumptions based on these hypotheses and comparing modeling and experimental results. Two-dimensional (spatial dimensions) models are more accurate because they reproduce the correct shape of migrating cell [17], but they are expensive computationally and lack the level of detail needed. Therefore, one-dimensional models that offer ease of analysis are very useful. A key problem is understanding the organization of the motile cell in the anteroposterior (front-rear) direction (the lateral organization is also important, but is another problem). Therefore, a number of models consider one-dimensional contractile actin gel strips [13,14,16]. Earlier models [13] consider discrete chains of active and passive mechanical subunits, then more advanced mathematically continuous models were introduced [14]. The viscoelastic nature of the actin gel remains under-investigated, with only a few notable exceptions [15,16]. This is an important quality to capture in a realistic model.
In this paper, we follow the ideas introduced in Ref. [16]. However, in that model, the addition of actin subunits at the front of the cell and their disassembly from the rear are not explicitly considered, and so the virtual cell is not truly treadmilling as it does in nature. We change this model feature to include actin polymerization and depolymerization. We also make a number of simplifications to clarify the model, and most importantly, introduce realistic myosin dynamics. Simulations of our model equations capture some of the experimental observations. At the same time, our model does not account for all observed behavior, which is also useful in indicating which assumptions are less likely to be realistic.
2. Physical model of the 1D actin–myosin gel strip
The geometry and physics of the 1D physical model of the viscoelastic actin–myosin gel strip stretching in the anteroposterior direction are illustrated in Fig. 1 (the cell is shown schematically from a side view). The x-axis follows the migration direction in the lab frame of reference. At the cell front (which has the time dependent x-coordinate f(t)) the actin fibers grow with the polymerization rate Vp, while at the rear (coordinate r(t)) the fibers shorten with the depolymerization rate Vd. We assume that Vd is a constant, while Vp decreases as the cell length increases according to the formula
Fig. 1.

A schematic diagram of the motile cell illustrating model variables and parameters (see the text).
| (1) |
where V0 is a constant, L0 is a characteristic cell length scale, and L = (f(t) − r(t)) is the cell length. Implicitly, this assumption stems from the fact that as the cell elongates, more actin is included into the F-actin network, and less of it exists in the monomeric form. Actin monomers dissociating at the rear diffuse to the front and assemble onto the tips of growing actin fibers, and when there are fewer actin monomers, the polymerization rate slows. We also assume that the process of diffusion is relatively fast and not rate-limiting.
The actin network in many cells has been characterized as a viscoelastic material [7,10]. Some experiments suggest that a simple Kelvin–Voight model—a spring in parallel with a dashpot (Fig. 1)—is an appropriate description of such a network [7] for short time scales. According to this model, if a force is applied, then the network deforms gradually due to effective viscous drag. In the steady state elastic stress equilibrates with the applied force. In the framework of this model, the gel's deformations are described with u(x, t)—the displacement vector [18]: u(x, t) = x′(x, t) —x0, where x is the coordinate of the unperturbed material point, and x′(x, t) is the coordinate of that point at time t.
There are active forces created from the interaction of actin and myosin, as well as passive viscoelastic forces in the gel, and the attachment forces between the cell and the surface. We describe the attachments as purely viscous dashpots (Fig. 1), so in the model if the cell is pulled along the surface, it will glide with constant speed, continuously breaking and creating the adhesion complexes. The main force-balance equation of the model is
| (2) |
where β(x) is the effective adhesion viscous drag per unit area. Multiplied by the local velocity of the gel, υ = ∂u/∂t (Fig. 1), it becomes the traction force that the cell applies to the surface. This force is equal to the derivative of the total gel's stress σ, which is a combination of passive stress (elastic and viscous) and active stress due to actin–myosin interaction. The factor h (the height of the cell) is necessary to account for the superposition of forces along the vertical gel transect applied only to the lower surface of the gel strip.
The total stress is given by the following expression:
| (3) |
Here E(x) is the gel's elastic modulus (Fig. 1), and the corresponding term is the elastic stress proportional to the strain ∂u/∂x. The gel's viscosity coefficient is μ(x) (Fig. 1) and the corresponding term is the viscous stress proportional to the rate of change of strain [19]. Finally, T(x) is the active myosin-generated stress. Note that the positive sign of T(x) corresponds to contraction of the gel.
The natural boundary condition at the front and rear edge are zero internal stresses:
| (4) |
| (5) |
Note that in Ref. [16] the non-biological condition of finite “protrusion” stress was used at the front.
It's important to note that the mechanical properties of the gel change with position depending on the density of the actin network. We describe this density with the variable a(x, t) governed by the conservation law:
| (6) |
where Γ is the constant rate of actin depolymerization, and the first term in the right-hand side describes gel's drift with local velocity υ = ∂u/∂t (Fig. 1). We assume that at the edges the cell maintains F-actin at constant normalized density:
| (7) |
We assume that both the elastic and viscous coefficients of the gel, as well as the adhesion viscous drag, are proportional to the local F-actin density:
| (8) |
Here E0, μ0, β0 are the characteristic values of the parameters corresponding to the maximal (non-dimensional) F-actin density a = 1. The first two relations agree with experimental indications that the mechanical moduli correlate linearly with the F-actin density [6] and with theoretical arguments [20]. However, the proportionality of the adhesion viscous drag to the F-actin density is not directly supported by observations. (All previous models used more complex assumptions about graded adhesion.) But this assumption can be justified if some process of rapid association/disassociation of adhesion complexes with actin fibers is limited by the F-actin density. We will demonstrate that this assumption leads to an adhesion distribution that agrees well with observations.
We describe the myosin dynamics with two variables: the density of myosin molecules bound to F-actin and generating contractile stress, b(x, t), and the constant in space and variable in time density of free myosin, f(t) (Fig. 1). The idea behind the spatial uniformity of the free myosin density is that unattached myosin molecules diffuse freely and rapidly in the cytoplasm, and their density equilibrates in space on a time scale which is fast compared to the motility processes. We assume that the bound myosin molecules dissociate from F-actin with the constant rate k1, and that the free myosin molecules associate with F-actin with the constant rate k2 (Fig. 1). Thus, the density of bound myosin is governed by the following equation
| (9) |
where the last term accounts for the myosin drift together with the actin gel. The natural boundary conditions are
| (10) |
because, as we will see below, myosin always drifts inward away from the edges of the strip. Finally, assuming that the total amount of myosin is conserved and normalized to unity, we have the following constraint, which is the implicit equation for f(t):
| (11) |
We assume that the myosin motors' force generation is additive, and so the macroscopic continuous active contractile stress, T(x), is linearly proportional to the concentration of bound myosin:
| (12) |
where T0 is the scale of this stress at the characteristic myosin density.
Combining the equations derived above, we obtain the following model system of partial differential equations
| (13) |
| (14) |
| (15) |
with the corresponding boundary conditions:
| (16) |
| (17) |
and constitutive relations and constraints:
| (18) |
| (19) |
Eqs. (19) specify the model system as a non-trivial free-boundary problem, in which the rates of extension of the leading edge and retraction of the rear edge are equal to the respective actin assembly/disassembly rates plus the local rates of deformation of the gel strip. We will see below that the strip always contracts inward, so the effective protrusion rate is decelerated, while the rear retraction rate is accelerated by this myosin powered contraction. Eqs. (13)–(19) constitute the complete consistent mathematical model of the motile gel strip. In the simulations, to avoid numerical instabilities, we also add small “smoothing” diffusion terms D∂2a/∂x2 and D∂2b/∂x2 to Eqs. (14) and (15), respectively. These terms can also have biological meaning accounting for small random displacements of actin fibers and myosin molecules in the gel.
3. Model parameters and scaling analysis
The mechanical and chemical properties of migrating cells vary tremendously depending on cell type and biological conditions resulting in an ongoing controversy. Here we use the values of the model parameters based on the most recent and reliable literature and on the data most relevant to rapidly and steadily moving cells, such as fish keratocytes. The model parameters are listed in Table 1. The gel's elastic modulus and the height of the gel strip (the pseudopod extension) have been directly measured [6], as have the characteristic speed and size of the cell [2]. The gel's viscosity coefficient can be deduced from the data in Ref. [10], where the relaxation time for transient mechanical perturbation of the cell of the order of 1 s was measured: the viscosity is of the order of this time multiplied by the elastic modulus. Active contractile myosin stress is of the order of traction force per unit area that the cell applies to the surface measured for a number of cells with a variety of methods [8,11,12]. The friction coefficient associated with the cell-surface adhesion has not been measured directly, but its order of magnitude can be estimated by dividing the average traction force by the characteristic local velocities induced by these forces [11,12]. The characteristic F-actin disassembly rate can be obtained from fitting the simulation results to the data in Ref. [2], where it is reported that the minimal F-actin density in the middle of the cell is ∼40–50% of the maximal density at the cell's leading edge. Myosin kinetics rates are unknown; we varied them in the simulations a few orders of magnitude. The smoothing diffusion coefficient is chosen so that the characteristic diffusive displacements of both actin and myosin over biologically relevant time scales are much less than the respective drifts.
Table 1.
Model parameters
| Parameter | Physical meaning | Value | Source |
|---|---|---|---|
| E0 | Gel's elastic modulus | ∼104 pN/μm2 | Ref. [6] |
| μ0 | Gel's viscosity coefficient | ∼104pNs/μm2 | Deduced from the data in Ref. [10] |
| T0 | Active myosin stress | ∼102–103pN/μm2 | Refs. [8,11,12] |
| β0 | Friction coefficient | ∼103pNs/μm3 | Deduced from the data in Refs. [11,12] |
| h | Height of the gel strip | ∼0.1μm | Ref. [6] |
| L0 | Characteristic length of the cell | 10μm | Ref. [2] |
| Vp, Vd | Characteristic treadmilling rates | 0.1 μm/s | Ref. [2] |
| Γ | F-actin disassembly rate | 0.002–0.01/s | Deduced from the data in Ref. [2] |
| k1, k2 | Rates of myosin kinetics | 0.01/s | Assumed |
| D | “Smoothing” diffusion coefficient | 0.1 μm2/s | Assumed |
The natural length scale in the model is L0, while the natural time scale is the characteristic relaxation time of the gel equal to μ0/E0. Furthermore, the natural scale for stress is the gel's elastic modulus, E0. Scaling all variables with these parameters, we arrive at the following non-dimensional system of equations
| (20) |
| (21) |
| (22) |
| (23) |
| (24) |
| (25) |
| (26) |
For simplicity, we keep the same notations for the rescaled variables t → tE0/μ0, υ → υμ0/E0L0, (u, x, f, r) → (u, x, f, r)/L0.
The model behavior depends on six-dimensionless combinations of parameters that can be estimated using the values listed in Table 1:
| (27) |
| (28) |
The values of these dimensionless combinations have the following important biological implications:
The characteristic adhesion force is large compared to characteristic force of deformation of the gel (s1 ⪢ 1).
Myosin-powered contraction can cause only slight deformations of the gel (s2 ⪡ 1).
F-actin depolymerization, myosin kinetics and treadmilling rates at the front and the rear of the cell are all of the same order of magnitude (∼100 s) and are much slower than the viscoelastic relaxation of the gel (∼1 s).
This scaling analysis suggests the following qualitative scenario: the viscous properties of the F-actin gel are not important because under stress the gel will relax rapidly (on the scale of seconds) into an elastically deformed state. The great stiffness of the gel compared to the contractile stress (which justifies using linear viscoelasticity theory) makes these deformations very small. The rate of flow of the gel in the lab coordinate system will also be small because of the significant adhesion strength. Therefore, the gel strip will reach an asymptotically stable length on the scale of 100 s and execute almost perfect treadmilling, with both the rear and the front edge advancing with dimensional velocity Vd. The stable length of the strip will be L = L0(V0/Vd), so that Vp = Vd. Numerical simulations described below confirm this analysis.
4. Simulations of the treadmilling gel strip
We integrated Eqs. (20)–(26) numerically using an explicit scheme in time and a generalized Gaussian method [21] to solve for the displacements u(x, t) (the equations were discretized similarly to the method in Ref. [16]) and actin and myosin densities, a(x, t) and b(x, t), respectively. At each computational step, the gel's local velocity was computed using a backward difference formula, and the free myosin density was adjusted using formula (25). A grid with uniform spacing of 0.01 (0.1 μm) and a time step small enough to maintain stability were used. We prescribed initial displacements to be zero, the rear boundary to be near the origin of coordinate system, r(0)∼0, and the cell front to be f(0)∼1.
At each computational step, we added the rear (front) boundary displacements defined by Eqs. (26), and when these cumulative displacements became greater than or equal to the distance between spatial grid points, we eliminated the leftmost (added the rightmost) grid point defining the new boundaries of the gel strip. At the newly added grid point, we set the value of the displacement u at the moment of addition to be equal to the displacement of the neighboring existing point at that time.
We also varied the initial length of the cell and perturbed the initial conditions and model parameters in a number of ways. In all simulations, a unique, asymptotically stable pattern of locomotion (Fig. 2) evolved by the time the cell had moved a few body lengths (a few tens of microns in a few minutes). Fig. 2A illustrates how the lamellipodial length and migration velocity equilibrate to constant values. This regulation stems from a negative feedback loop: in a longer cell, the rate of protrusion is reduced, while in shorter cells this rate increases, so that protrusion and retraction are matched.
Fig. 2.
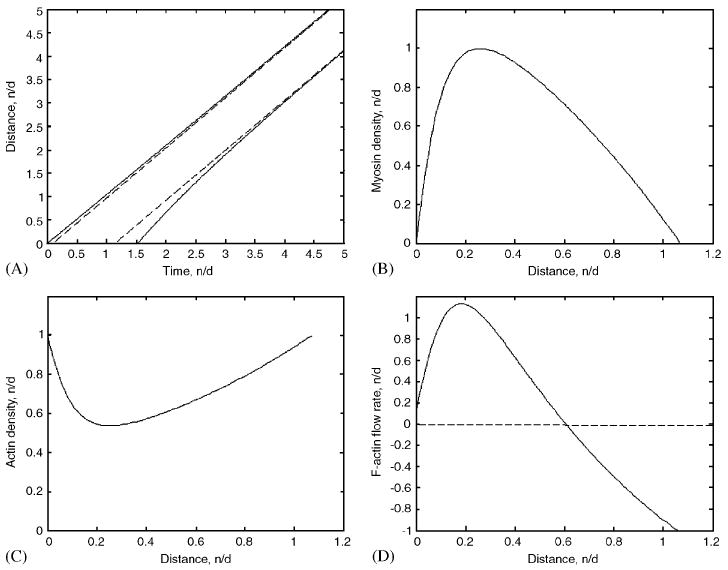
(A) Comparison of the computed trajectories of the front and rear edges of the motile gel strip (solid) with the parallel dashed straight lines demonstrating that asymptotically the strip reaches constant length and treadmills with constant speed. One time unit corresponds to 100 s. (B)–(D) Asymptotically stable stationary distributions of bound myosin (b(x))—(B), F-actin (a(x))—(C), and F-actin flow rate (υ(x))—(D) across the treadmilling strip. The densities are normalized by their maximal absolute values (the flow rate is normalized to its value at the front). One unit of distance corresponds to 10 μm; x = 0 and x ≈ 1.07 correspond to the rear and front of the strip, respectively.
Fig. 2B shows the asymptotically stable stationary distribution of the bound myosin attached to F-actin and generating contraction. As the figure shows, the myosin density is skewed toward the rear of the strip. This is because myosin experiences effective retrograde flow in the coordinate system of the treadmilling strip. This asymmetry qualitatively agrees with observations of myosin concentrating at the rear of the cell [2-4]. However, in this experimental data, the myosin density appears to be much greater at the narrow region at the rear, while simulations show a smooth distribution across the whole strip. This discrepancy could be due to much slower myosin kinetics, which would require much longer computational time to simulate.
Fig. 2C shows the normalized asymptotically stable stationary distribution of F-actin. It is a convex function, maximal at the edges and decreasing to a minimum close to the rear edge of the strip. Its profile compares well to the observed F-actin density across motile cells [2,6]. The reason for such a distribution is that F-actin disassembles everywhere away from the edges, always drifting to the rear in the coordinate system of the treadmilling strip. Note that the profiles of the gel elastic and viscous coefficients are proportional to that of F-actin. No one has attempted to measure the gradient of viscosity across the cell but the gradient of the elastic modulus in the front half of the cell measured in Ref. [6] fits the model prediction well. Finally, we assumed that the adhesion strength is also proportional to the F-actin density, so we predict high adhesion strength at the front and rear and low strength near the center of the strip. Qualitatively, this is what the observations show in slowly moving cells [22]. In the rapidly moving cells, however, the adhesion strength at the rear is low [5], which can be explained in the model framework if we assume a low boundary value for the F-actin-density at the rear. (Almost no experimental measurements are made at the rear of the cell, where the cell body interferes with data analysis, so it is difficult to determine a realistic value to use in our simulations.)
Fig. 2D shows the normalized asymptotically stable stationary distribution of the F-actin flow rate, υ(x − Vt), in the lab coordinate system. (The quantity (x − Vt) is the traveling coordinate, where V = df/dt = dr/dt is the asymptotically constant rate of strip's migration.) The F-actin contracts flowing backward in the front half of the strip and forward in the rear half, as we expected from the qualitative analysis of the model. The magnitude of the flow is large at the very front and close to the rear (about 15% of the strip length from the rear). The flow decreases at the very rear in the model due to the great strength of adhesion there and the respective decrease in the rate of the gel's movement. Note that the total traction force applied by the contracting strip to the surface, , must be equal to zero. We checked this condition, and it is satisfied with high accuracy. The model predicts that higher traction force will be applied at the front of the cell, lower force at the rear, and still lower at the center, which qualitatively agrees with observations [23]. Importantly, the qualitative flow map agrees with corresponding data [4], but the data shows a uniform, rather than a graded rate of flow in the front half of the cell, hinting that assumptions about elasticity and adhesion dependence on the actin density in the model are over-simplified.
To test the model's robustness, we varied the dimensionless combinations of parameters (17)–(18) and repeated the simulations. We found that the qualitative nature of the solutions was largely insensitive to the values of the parameters indicating that the model is robust. If we significantly decrease the strength of adhesions and gel elasticity and increase the characteristic myosin contractile stress, then the gel deforms more significantly, and the F-actin flow increases, shortening the motile strip but having little effect on its speed. Also, elastic strain becomes comparable to unity, in which limit the linear theory becomes invalid, so some experimental conditions cannot be simulated with our model.
5. Simulations of the stationary gel strip
As we mentioned in the introduction, in the lab, the cell fragment can remain stationary, keeping a disk-like shape, with myosin concentrated at the center and F-actin exhibiting slow centripetal flow [3]. In order to model this experiment, we simulated a symmetric 1D gel strip (having mirror symmetry about the center) representing a radial transect of the actual disk-like cell fragment. The center (edges) of the strip correspond to the center (boundary) of the disk. The symmetry is maintained if the initial conditions are symmetric and if the gel growth rate at both ends of the strip is the same. Because of the symmetry, we simulated only half of the strip, the left end of which corresponds to the cell center, and the right end to the cell boundary. We solved Eqs. (20)–(22) numerically as described above, with appropriate changes to the boundary conditions (23)–(26). Namely, at the center of the strip (left edge of the simulated segment), we postulated that the displacement is equal to zero, due to symmetry, instead of the zero stress condition. Also due to symmetry, the fluxes of actin and myosin densities are zero at the left edge of the simulated segment, instead of having prescribed values. In Eqs. (25)–(26), r(t) = 0, and the total myosin is normalized by 0.5, rather than 1. We changed the right edge coordinate as described above keeping the left edge fixed at zero.
The results of the simulations are shown in Fig. 3. Qualitatively, we expect that the strip will contract from the edges to the center, so that the density of actin (myosin) decreases (increases) from the edges to the center. The simulations confirm this intuitively clear prediction (Fig. 3). The computed profiles of actin, myosin and flow rate in Fig. 3 qualitatively agree with semi-quantitative observations [3].
Fig. 3.
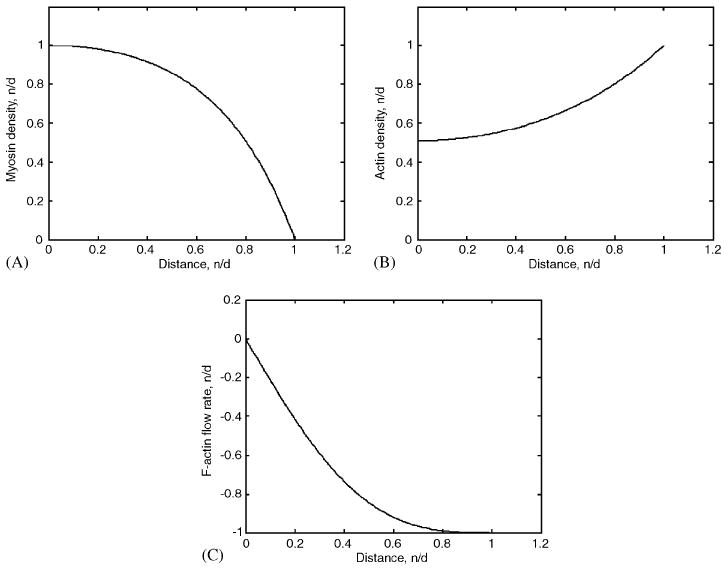
(A) Asymptotically stable stationary distributions of bound myosin (b(x)), (B) F-actin (a(x)), and (C) F-actin flow rate (υ(x)), across half of the non-motile contracting strip. The densities are normalized by their maximal absolute values. One unit of distance corresponds to 10 μm; x = 0 and x ≈ 1 correspond to the middle and right edge of the strip, respectively. The actin and myosin densities are even functions, the flow rate is an odd function.
An important question is whether the stationary strip maintains a constant size as observed in Ref. [3]. In this case, the rate of gel growth must be equalized by the rate of contraction at the edge. In the simulations, we established that the rate of contraction reaches an asymptotically stable magnitude, and it was easy to keep the length of the strip constant by simply adjusting the value of V0, so that the rates of growth and contraction at the edge matched. However, to systematically answer this question, the simulations must be run for a prolonged time, which is precluded by the fact that growing elastic strain reaches values comparable to unity making the model invalid. In principle, a Maxwell viscoelastic model allowing large viscous strains is more appropriate for the description of stationary cells.
6. Conclusions and future work
Though the general principles of cell crawling have been established for some time [1], many details remain elusive. Two physical questions that require modeling are: (1) What is the physical nature and the molecular basis of protrusion, retraction, and adhesion? (2) How are these three processes coordinated to achieve the observed shapes and movements of crawling cells? To address these questions, we have developed a 1D model of the actin-myosin system that generates movement in simple crawling cells.
Our model qualitatively reproduces the treadmilling movement of the actin–myosin gel strip with constant length and speed, the stationary contraction of the non-motile symmetric strip, and the experimentally observed distributions of F-actin, myosin and actin flow rate across the strip. We demonstrate that the qualitative features of the motile cells can be explained in the framework of viscoelastic (Kelvin–Voight) gel model assuming that the contraction is proportional to the myosin density and that elastic, viscous and adhesion coefficients are proportional to the F-actin density.
However, the predictive capacity of the model is limited. The problem is that very few crucial assumptions of the model are supported by direct experiments. Detailed biophysical research is needed to verify the model assumptions or to suggest alternatives. The examination of the simulation results suggests that a more general nonlinear viscoelastic model and more complex constitutive relations will be needed to achieve full quantitative agreement between experimental and theoretical results. Furthermore, only the full 2D model, which is much more difficult computationally, will be able to answer biological questions comprehensively. Finally, it would be interesting to theoretically determine the conditions for the symmetry break, when the stationary strip starts treadmilling [3]. This transition would require nonlinear feedbacks between gel growth, stresses and adhesions that are absent in the model at this stage. Despite its shortcomings, our present model is an important step in understanding the biophysics of the motile cell.
Acknowledgments
The authors are supported by NIH GLUE Grant ‘Cell Migration Consortium’ (NIGMS U54 GM64346) and by NSF Grant DMS-0315782.
References
- 1.Bray D. Cell Movements. Garland; New York: 2002. [Google Scholar]
- 2.Svitkina T, Verkhovsky A, McQuade K, Borisy G. J Cell Biol. 1997;139:397. doi: 10.1083/jcb.139.2.397. [DOI] [PMC free article] [PubMed] [Google Scholar]
- 3.Verkhovsky A, Svitkina T, Borisy G. Curr Biol. 1999;9:11. doi: 10.1016/s0960-9822(99)80042-6. [DOI] [PubMed] [Google Scholar]
- 4.Vallotton P, Danuser G, Bohnet S, Meister JJ, Verkhovsky AB. Mol Biol Cell. 2005;16:1223. doi: 10.1091/mbc.E04-07-0615. [DOI] [PMC free article] [PubMed] [Google Scholar]
- 5.Lee J, Jacobson K. J Cell Sci. 1997;110:2833. doi: 10.1242/jcs.110.22.2833. [DOI] [PubMed] [Google Scholar]
- 6.Laurent VM, Kasas S, Yersin A, Schaffer TE, Catsicas S, Dietler G, Verkhovsky AB, Meister JJ. Biophys J. 2005;89:667. doi: 10.1529/biophysj.104.052316. [DOI] [PMC free article] [PubMed] [Google Scholar]
- 7.Ragsdale GK, Phelps J, Luby-Phelps K. Biophys J. 1997;73:2798. doi: 10.1016/S0006-3495(97)78309-7. [DOI] [PMC free article] [PubMed] [Google Scholar]
- 8.Wakatsuki T, Kolodney MS, Zahalak GI, Elson EL. Biophys J. 2000;79:2353. doi: 10.1016/S0006-3495(00)76481-2. [DOI] [PMC free article] [PubMed] [Google Scholar]
- 9.Laurent VM, Henon S, Planus E, Fodil R, Balland M, Isabey D, Gallet F. J Biomech Eng. 2002;124:408. doi: 10.1115/1.1485285. [DOI] [PubMed] [Google Scholar]
- 10.Bausch AR, Ziemann F, Boulbitch AA, Jacobson K, Sackmann E. Biophys J. 1998;75:2038. doi: 10.1016/S0006-3495(98)77646-5. [DOI] [PMC free article] [PubMed] [Google Scholar]
- 11.Rieu JP, Barentin C, Maeda Y, Sawada Y. Biophys J. 2005;89:3563. doi: 10.1529/biophysj.104.056333. [DOI] [PMC free article] [PubMed] [Google Scholar]
- 12.Reinhart-King CA, Dembo M, Hammer DA. Biophys J. 2005;89:676. doi: 10.1529/biophysj.104.054320. [DOI] [PMC free article] [PubMed] [Google Scholar]
- 13.DiMilla PA, Barbee K, Lauffenburger DA. Biophys J. 1991;60:15. doi: 10.1016/S0006-3495(91)82027-6. [DOI] [PMC free article] [PubMed] [Google Scholar]
- 14.Choi YS, Lee J, Lui R. J Math Biol. 2004;49:310. doi: 10.1007/s00285-003-0255-1. [DOI] [PubMed] [Google Scholar]
- 15.Kruse K, Joanny JF, Julicher F, Prost J, Sekimoto K. Eur Phys J E. 2005;16:5. doi: 10.1140/epje/e2005-00002-5. [DOI] [PubMed] [Google Scholar]
- 16.Gracheva ME, Othmer HG. Bull Math Biol. 2004;66:167. doi: 10.1016/j.bulm.2003.08.007. [DOI] [PubMed] [Google Scholar]
- 17.Rubinstein B, Jacobson K, Mogilner A. SIAM J MMS. 2005;3:413. doi: 10.1137/04060370X. [DOI] [PMC free article] [PubMed] [Google Scholar]
- 18.Landau LD, Lifshitz EM. Theory of Elasticity. Reed Publishing; New York: 1986. [Google Scholar]
- 19.Bird RB, Armstrong RC, Hassager O. Dynamics of Polymeric Liquids. Wiley; New Jersey: 1987. [Google Scholar]
- 20.Boal D. Mechanics of the Cell. Cambridge University Press; Cambridge: 2002. [Google Scholar]
- 21.Garcia AL. Numerical Methods for Physics. Prentice-Hall; New York: 2002. [Google Scholar]
- 22.Jurado C, Haserick JR, Lee J. Mol Biol Cell. 2005;16:507. doi: 10.1091/mbc.E04-10-0860. [DOI] [PMC free article] [PubMed] [Google Scholar]
- 23.Oliver T, Dembo M, Jacobson K. J Cell Biol. 1999;145:589. doi: 10.1083/jcb.145.3.589. [DOI] [PMC free article] [PubMed] [Google Scholar]