Abstract
Purpose
To determine the accuracy, repeatability, and reproducibility of measurement of lateral dimensions using the Artemis (Ultralink LLC) very high-frequency (VHF) digital ultrasound (US) arc scanner.
Setting
London Vision Clinic, London, United Kingdom.
Methods
A test object was measured first with a micrometer and then with the Artemis arc scanner. Five sets of 10 consecutive B-scans of the test object were performed with the scanner. The test object was removed from the system between each scan set. One expert observer and one newly trained observer separately measured the lateral dimension of the test object. Two-factor analysis of variance was performed. The accuracy was calculated as the average bias of the scan set averages. The repeatability and reproducibility coefficients were calculated. The coefficient of variation (CV) was calculated for repeatability and reproducibility.
Results
The test object was measured to be 10.80 mm wide. The mean lateral dimension bias was 0.00 mm. The repeatability coefficient was 0.114 mm. The reproducibility coefficient was 0.026 mm. The repeatability CV was 0.38%, and the reproducibility CV was 0.09%. There was no statistically significant variation between observers (P = .0965). There was a statistically significant variation between scan sets (P = .0036) attributed to minor vertical changes in the alignment of the test object between consecutive scan sets.
Conclusion
The Artemis VHF digital US arc scanner obtained accurate, repeatable, and reproducible measurements of lateral dimensions of the size commonly found in the anterior segment.
Anterior segment dimensions such as angle-to-angle or sulcus-to-sulcus diameters apply directly to the sizing of intraocular lenses (IOLs). Accurate determination of these lateral anterior segment dimensions is a key factor in the safety of these devices.
The sulcus-to-sulcus width has to date only been estimated from the horizontal corneal diameter (white-to-white) obtained externally. Some surgeons use the white-to-white measurement, and others size the IOL by adding 0.5 to 1.0 mm to the white-to-white measurement.1 However, published studies have not found a significant anatomical correlation between white-to-white and sulcus-to-sulcus measurements.2–4 It appears, therefore, that estimating sulcus-to-sulcus from the white-to-white diameter could be responsible for the occasional sizing issues observed.1
The Artemis very high-frequency (VHF) digital ultrasound (US) arc scanner (Ultralink LLC) can image the anterior segment, providing measurement of intraocular dimensions such as the angle-to-angle width, sulcus-to-sulcus width, and anterior chamber depth.1,2,5,6 The aim of this study was to determine the accuracy, repeatability, and reproducibility of lateral dimensions similar in magnitude to those found in the anterior segment with the Artemis VHF digital US arc scanner.
Materials and Methods
This prospective study was designed to quantify the accuracy, repeatability, and reproducibility of the Artemis VHF digital US arc scanner by measuring an object of known dimension.
The following definitions were used: Accuracy is the ability of a measuring instrument to give responses close to a true value and is described by the bias. Repeatability is the closeness of the agreement between successive measurements of the object carried out under the same conditions of measurement (intrasession). Reproducibility is the closeness of the agreement between measurements of the object carried out under changed conditions of measurement (intersession, interobserver).
Test Object
A square metal bolt was used as the test object. Because a bolt is designed to have straight, consistent sides, there should be little variation in lateral dimensions across all parallel planes through the bolt. The bolt chosen was similar in size to the lateral dimensions of the anterior segment so the statistics found in the study would be relevant to the clinical use of the Artemis arc scanner for anterior segment imaging and biometry in phakic IOL sizing.
The bolt width was measured using a commercially available screw gauge micrometer (Junior's Tools Inc.). The pitch of the screw was 0.5 mm and the least count, 0.01 mm.
Ultrasound Scanning
The Artemis VHF digital US arc scanner uses sterile normal saline at 33°C as the acoustic coupling medium between the object being measured and the transducer. Normally, the patient's head is placed in a headrest while the eye fits into an eyecup that seals the saline-filled scanning compartment. For this study, a test object mount was used to seal the saline-filled scanning compartment while the test object was held in position. A broadband 50 MHz VHF US transducer (bandwidth 10 to 60 MHz) sweeps in a reverse arc high-precision mechanism to acquire B-scans. The scan sweep is designed to follow the contours of the cornea or iris and ciliary body structures, thereby maintaining transducer perpendicularity and signal-to-noise ratio to the curved structures being scanned. The US elements of Artemis technology include raw US radio-frequency data digitization and storage for digital signal processing. The digitized US data are then transformed using proprietary digital signal-processing technology that increases signal-to-noise ratio and optimizes image quality and measurement precision.7
The Artemis 1 scanner described here is the precursor to the commercially available Artemis 2 (Ultralink LLC). The main difference is that the Artemis 1 uses a polyvinylidene difluoride (PVDF) transducer and the Artemis 2 uses the more sensitive lithium niobate transducer. The PVDF and lithium niobate probes produce the same accuracy of measurement because this varies according to frequency and bandwidth, not sensitivity. The digital signal processing technology and the arc described for anterior segment as well as corneal scanning are identical for both instruments. The Artemis 2 is a miniature version of the Artemis 1, approximately one third the size and weight.
The bolt was secured inside the test object mount by pressing it onto a cushion of Blu-Tac (Bostik Ltd.). The scanning system was aligned to the bolt using the coaxial infra-red video image on the screen. The test object mount was rotated so that the sides of the bolt were visibly vertical and parallel to reference markings on the infrared coaxial video image. The position of the transducer was adjusted so the bolt was in the focal plane. Ten consecutive B-scans were obtained, with each scan sweep taking 0.5 seconds. The saline was emptied from the chamber and the test object mount removed. The experiment was repeated 4 times.
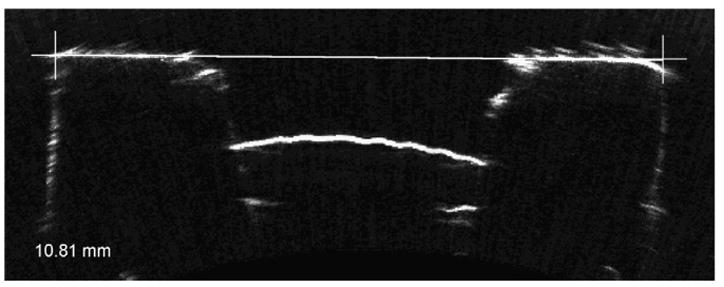
The B-scan images were displayed on screen (Figure 1). The lateral dimension of the bolt was measured by a professional observer (D.Z.R.) and a newly trained observer (T.J.A.) by placing cross-hair cursors on the reflections of the bolt sides. The upper corners of the bolt were used as the fiducial points of reference so that perpendicularity of each lateral measurement in each scan was ensured. The corner was defined as the point where the vertical of the cross hair was parallel to the vertical edge of the bolt and the horizontal cross hair was parallel to horizontal edge of the bolt (Figure 1). The value of each measurement was masked from the measuring observer, and the nonmeasuring observer was not present during measurement.
Figure 1.

Horizontal VHF digital US B-scan of the test object (10.80 mm bolt). The shape of the block is seen with the central hole for the screw. The inside of the bolt contains a protruding dome of Blu-Tac. The interfaces appear soft, similar to those seen in US images of the anterior segment. The cross hair shows how the corner was used as a reference point to keep lateral measurements between scans consistent. The white line shows the end points of the measurement that was made by the observer. The distance of the white line is displayed in millimeters in the bottom left-hand corner.
Statistical Analysis
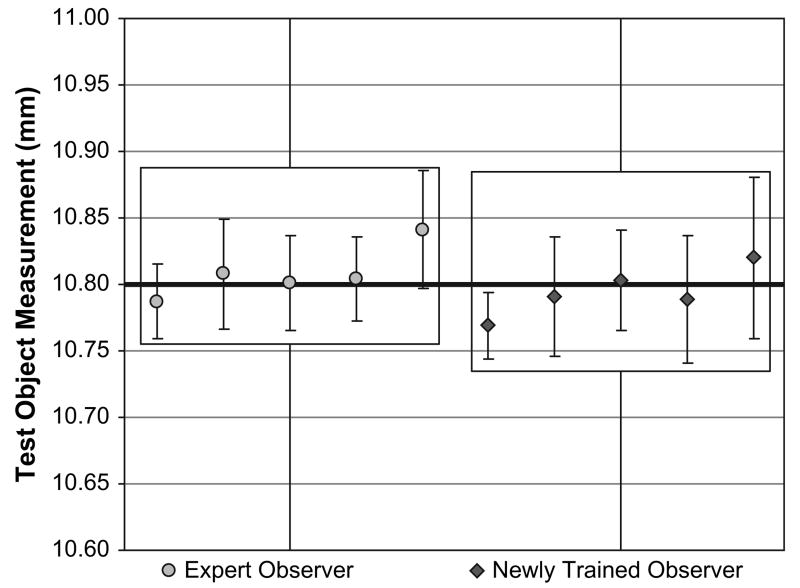
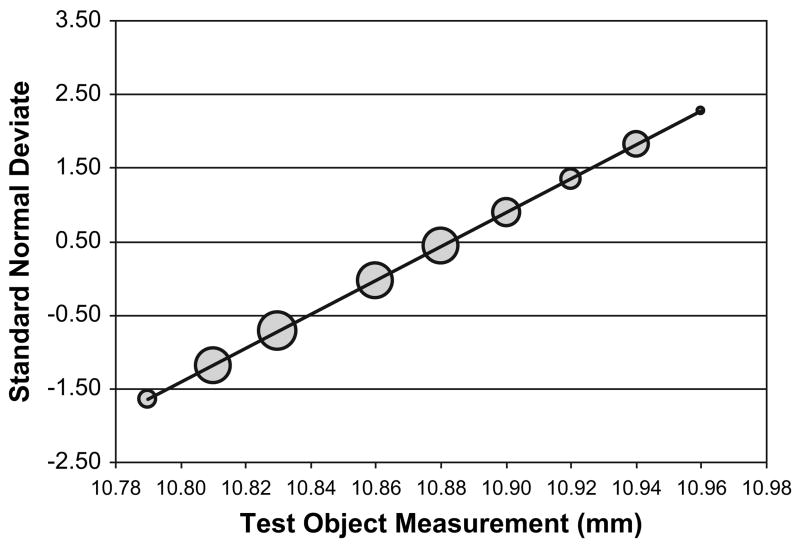
The mean and standard deviation of each scan set for the 2 observers were calculated. A repeatability and reproducibility chart was plotted to graphically show the agreement between observers (Figure 2). The difference between the average of each 10-scan set and the micrometer measured width was calculated. The overall bias was defined as the mean of these differences. A quantile-quantile (q-q chart) was plotted to test that the measurements followed a normal distribution (Figure 3). In a q-q chart, each measurement is plotted against the standard normal deviate calculated using the formula (measurement/SD) − (mean/SD). If the data are not from a normal distribution, the q-q plot will not be a straight line.8 Two-factor analysis of variance (ANOVA) was performed to calculate the mean square (MS) for variability within observers (MSW), between observers (MSB), between scan sets (MSS), and for the interaction between observers and scan sets (MSI). The respective variances were calculated using the following equations
Figure 2.
A repeatability and reproducibility plot for the study data. The mean and standard deviation of each scan set are plotted for the expert and newly trained observer. The thick black line indicates the micrometer derived lateral width (10.80 mm) of the test object. The boxes indicate the overall agreement between observers. The accuracy of the B-scan system is represented by the thick black line bisecting the average of the scan sets. The small range of the error bars represents the high repeatability of measurement. The similar height of the boxes and similar pattern of means across the sequence of 5 scan sets for the 2 observers represent the high reproducibility.
Figure 3.
A q-q bubble plot of the 100 measurements made on the test object by the 2 observers. The size of the bubble indicates the percentage of measurements that were a particular value. The straight line through the points indicates that it can be assumed that the measurements follow a normal distribution.
| (1) |
| (2) |
| (3) |
| (4) |
where b observers each measured n objects m times.
Two-factor ANOVA also tests for significant differences between observers and scan sets. A P value less than 0.05 was considered statistically significant. The repeatability coefficient is the maximum difference that is likely to occur between repeated measurements, calculated as 2.77 × σw2.9 The repeatability coefficient was calculated for each observer and for all measurements combined. Similarly, the reproducibility coefficient is the maximum difference that is likely to occur between different observers, calculated as 2.77 × σb2. The coefficient of variation (CV) was calculated. Expressed as a percentage, the CV is the ratio of the standard deviation and the overall mean.10 The CV was calculated for reproducibility, repeatability for each observer, and repeatability for all measurements combined. All statistics were calculated using Microsoft Excel 2003.
Results
The bolt width was measured 10.80 mm with the micrometer. The bolt sides were clearly visible in all the Artemis B-scans, and the corner of the bolt could be determined with confidence (Figure 1). The bias was 0.00 mm. The repeatability and reproducibility plot (Figure 2) shows that the mean of each scan set was close to 10.80 mm and there was close agreement between observers across the 5 scan sets.
The q-q plot (Figure 3) showed that the measurements could be considered to follow a normal distribution, so a 2-factor ANOVA could be performed. The output of the 2-factor ANOVA table is shown in Table 1. The repeatability coefficient was 0.114 mm. The reproducibility coefficient was 0.026 mm. The coefficients of variation are shown in Table 2. The between-observer variation was not statistically significant (P = .0965). The between–scan set variation was statistically significant (P = .0036). The interaction between observers and scan sets was not statistically significant (P = .9120).
Table 1.
The observer/scan set ANOVA output from Microsoft Excel 2003.
| Source of Variation | SS | df | MS | F | P Value | F Crit |
|---|---|---|---|---|---|---|
| Observers | 0.0048 | 1 | 0.0048 | 2.8214 | .0965 | 3.9469 |
| Scan Sets | 0.0284 | 4 | 0.0071 | 4.2144 | .0036 | 2.4729 |
| Scan Sets × Observers | 0.0017 | 4 | 0.0004 | 0.2450 | .9120 | 2.4729 |
| Within | 0.1519 | 90 | 0.0017 | — | — | — |
| Total | 0.1867 | 99 | — | — | — | — |
DF = degrees of freedom; F = F ratio statistic; MS = mean square; F Crit = F ratio statistic for statistical significance at 5% level of confidence; SS = sum of squares
Table 2.
Coefficients of variation.
| Parameter | Coefficient of Variation (%) |
|---|---|
| Within observers | 0.38 |
| Expert observer (DZR) | 0.34 |
| Newly trained observer (TJA) | 0.42 |
| Between observers | 0.09 |
| Between scan sets | 0.17 |
Discussion
The Artemis VHF digital US arc scanner can measure lateral dimensions in the range of those found in the anterior segment accurately with a bias of 0.00 mm, a within-observer repeatability CV of 0.38%, and a between-observer reproducibility of 0.09%. The consistency in accuracy and reproducibility of the arc scanner lateral measurements between an expert and a newly trained observer were also validated. As expected, the expert observer obtained slightly more repeatable measurements, but the difference was not statistically significant and contributed less to the total variation than the within-observer variation (0.09% versus 0.38%).
The variation between scan sets was statistically significant. Because of the close agreement found between observers, as well as the close agreement within observers for a given set of 10 consecutive scans, we postulate that a small rotation of the bolt caused the between-scan set variation. By trigonometry, a 2.13-degree deviation from the vertical would produce a 0.03 mm error, as seen in the fifth scan set as compared with the preceding scan sets. When imaging the anterior segment, rotation of the eye would cause less variation in lateral measurement because the anterior segment is rounder.6
Very high-frequency digital US scanning technology can produce clear images of both the angle and sulcus.2,6 The soft interfaces seen in the Artemis B-scan image of the bolt are similar to those seen in intraocular anatomical images. Thus, it is likely the Artemis B-scan measurement of dimensions within the anterior segment, including angle-to-angle and sulcus-to-sulcus widths, will have similar accuracy, repeatability, and reproducibility to those found in this study. In vivo, it is possible that the trajectory of US through the outer surface of the eye will produce minor refraction of the beam, leading to distortion of the internal interface boundaries and image warpage. This refraction, however, is known to be negligible in this immersion setup because of two factors. First, the angle of incidence of the beam to the ocular surface is kept to a maximum of ± 10 degrees by the arc-scan motion. Second, the refractive index of US from saline into cornea is 1.07 and is therefore negligible at these angles of incidence. We are currently studying the Artemis accuracy, reproducibility, and repeatability of angle-to-angle and sulcus-to-sulcus diameters in humans.
In conclusion, this study found that the Artemis VHF digital US arc scanner obtains accurate, repeatable, and reproducible measurements of lateral dimensions of the size commonly found in the anterior segment.
Acknowledgments
Supported in part by National Institutes of Health grants EB00238 and EY13901 and Research to Prevent Blindness.
References
- 1.Lovisolo CF, Reinstein DZ. Phakic intraocular lenses. Surv Ophthalmol. 2005;50:549–587. doi: 10.1016/j.survophthal.2005.08.011. [DOI] [PubMed] [Google Scholar]
- 2.Werner L, Izak AM, Pandey SK, et al. Correlation between different measurements within the eye relative to phakic intraocular lens implantation. J Cataract Refract Surg. 2004;30:1982–1988. doi: 10.1016/j.jcrs.2003.10.041. [DOI] [PubMed] [Google Scholar]
- 3.Fea AM, Annetta F, Cirillo S, et al. Magnetic resonance imaging and Orbscan assessment of the anterior chamber. J Cataract Refract Surg. 2005;31:1713–1718. doi: 10.1016/j.jcrs.2005.02.040. [DOI] [PubMed] [Google Scholar]
- 4.Pop M, Payette Y, Mansour M. Predicting sulcus size using ocular measurements. J Cataract Refract Surg. 2001;27:1033–1038. doi: 10.1016/s0886-3350(00)00830-0. [DOI] [PubMed] [Google Scholar]
- 5.Kim DY, Reinstein DZ, Silverman RH, et al. Very high frequency ultrasound analysis of a new phakic posterior chamber intraocular lens in situ. Am J Ophthalmol. 1998;125:725–729. doi: 10.1016/s0002-9394(98)00025-7. [DOI] [PubMed] [Google Scholar]
- 6.Rondeau MJ, Barcsay G, Silverman RH, et al. Very high frequency ultrasound biometry of the anterior and posterior chamber diameter. J Refract Surg. 2004;20:454–464. doi: 10.3928/1081-597X-20040901-08. [DOI] [PubMed] [Google Scholar]
- 7.Reinstein DZ, Silverman RH, Coleman DJ. High-frequency ultrasound measurement of the thickness of the corneal epithelium. Refract Corneal Surg. 1993;9:385–387. [PubMed] [Google Scholar]
- 8.Bland M. An Introduction to Medical Statistics. 3rd. New York, NY: Oxford University Press; 2000. [Google Scholar]
- 9.Bland JM, Altman DG. Statistical notes: measurement error. BMJ. 1996;313(7059):744. doi: 10.1136/bmj.313.7059.744. [DOI] [PMC free article] [PubMed] [Google Scholar]
- 10.Bland JM, Altman DG. Statistical notes: measurement error proportional to the mean. BMJ. 1996;313(7049):106. doi: 10.1136/bmj.313.7049.106. correction, 744. [DOI] [PMC free article] [PubMed] [Google Scholar]


