Abstract
Competing populations in shared spaces with nonrenewable resources do not necessarily wage a battle for dominance at the cost of extinction of the less-fit strain if there are fitness advantages to the presence of the other strain. We report on the use of nanofabricated habitat landscapes to study the population dynamics of competing wild type and a growth advantage in stationary phase (GASP) mutant strains of Escherichia coli in a sealed and heterogeneous nutrient environment. Although GASP mutants are competitors with wild-type bacteria, we find that the 2 strains cooperate to maximize fitness (long-term total productivity) via spatial segregation: despite their very close genomic kinship, wild-type populations associate with wild-type populations and GASP populations with GASP populations. Thus, wild-type and GASP strains avoid each other locally, yet fitness is enhanced for both strains globally. This computation of fitness enhancement emerges from the local interaction among cells but maximizes global densities. At present we do not understand how fluctuations in both spatial and temporal dimensions lead to the emergent computation and how multilevel aggregates produce this collective adaptation.
Keywords: biophysics, competition, ecology, microbiology
In business, large corporations can win temporarily by securing monopolies and driving small companies to extinction but at the cost of innovation caused by removal of competition (1). In the world of microorganisms, dominant populations that eliminate competing strains can lose ultimately if the competing strain driven to extinction can provide fitness enhancement to the dominant strain. Extinction phenomena of overexploitation for renewable resources have been characterized by the Tragedy of the Commons (2), but such extinction scenarios are not the norm in natural spatially heterogeneous habitats, at least for “lower” organisms. For example, bacteria segregate their populations into microecological niches in environments as diverse as soil (3) and coexist in a collective computation of coadaptation.
By “computation” we refer to the collective adaptive response in bacterial populations to present and/or future anticipated changes in the environment. This emergent computation (4) that optimizes global quantities from locally interacting agents has also been reported in other biological systems ranging from DNA (5) to plants (6, 7). At the simplest level, here the computation can be viewed as a process by which the global cell densities are collectively optimized (mutual fitness) by locally adapting cells. Escherichia coli cells have evolved sophisticated biological networks to gauge environmental conditions and to adapt to them. This can occur at the network level (8), at the epigenetic level through DNA methylation (9), and at the genomic level through mutations (10).
When bacteria are cultured in a test tube, the initial exponential growth phase leads to entry into stationary phase. After several days in this stationary phase mutant strains emerge (11). These mutants carry a growth advantage in stationary phase (GASP) phenotype: in competitive experiments, under stationary phase conditions, GASP mutants prosper at the cost of the wild-type (WT) cells (12–14). We did our competitive experiments by using (red and green) fluorescent constructs carrying rpoS WT and rpoS 819 bacteria, characterized by mutations in the rpoS gene typically, which codes the σS factors of the RNA polymerase (15–17).
The switching of σ factors (from log phase σ38 to stationary phase σS) triggers the entry into stationary phase. We compared monoculture populations with 2-strain (WT and GASP) competitive communities and compared total biomass productivity across experiments.
Multispecies communities can be described by a simple Lotka–Volterra equation (Eq. 1), where the bacterial density of strain i is ρi(t), the effective growth rate is ri, and the influence of the strains on each other is characterized by the (community) matrix element Ji,j that represents the ecological coupling between strains and their environment (18).
 |
In spatially extended systems, however, parameters of Eq. 1 vary in space and time at multiple scales in a complex manner. Critical scales are a result of the landscape structure and interactions between individuals (19, 20) and thus are difficult to determine a priori. Instead, we use an empirical approach and study the effect of landscape structure and ecological coupling experimentally. The questions we ask here are: (i) what is the influence of habitat on competition, (ii) what is the optimum fraction of WT and GASP mutant cells that maximizes fitness for the combination of WT and GASP mutants, and (iii) what is the time course approach to this solution.
Results
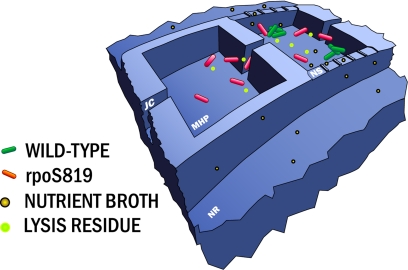
We built on our previous work (21) and used nanofabrication techniques to carry out molecular biology-engineered competition experiments within restricted environments with nonrenewable resources. Fig. 1 shows a diagram of the engineered structures, called microhabitat patches (MHPs), lying at the core of the experiments discussed below. The MHP array consists of 85 chambers of dimensions 100 × 100 × 8 μm interconnected by 5-μm-wide, 50-μm-long junction channels (JCs). Resources can diffuse into the MHPs through 200-nm deep nanoslits (NS) from nutrient reservoirs (NR) of volume ratio (MHP/NR) of 600:1. Although the JCs allow the bacteria to move between the MHPs, the NS only allow nutrients and waste to diffuse into and out of the MHPs. Many variables enter into the chip design and the experiment presented. Here, we focus on the coupling between the nutrient reservoirs and the MHPs: a nutrient landscape was created by modifying the number of NS open in each MHP. We made a simple step function of the nutrient landscape: we created regions of good food access (where all of the NS are open) spanning half the array and a region covering the other half where all of the NS are closed off, which we call “open” and “closed” regions, respectively.
Fig. 1.
Schematic view of 2 adjacent nanofabricated MHPs in a linear array. We constructed fluorescent strains of WT E. coli and GASP mutant (based on the rpoS 819 mutant) to track the populations of competing strains in our landscape. WT bacteria (with green fluorescent proteins) and rpoS 819 mutants (with red fluorescent proteins) are free to move within each MHP and between MHPs through JCs. The NR is coupled to the MHP by NS. The left side habitat patch is closed with all NS closed, and the right side patch is open with full openings. Nutrient and detritus (from bacterial lysis) are denoted by brown and green spheres, respectively, and can diffuse across the NS. Each MHP was 100 μm × 100 μm wide × 8 μm deep; the NS were etched 200 nm; and the feeding channels were 500 μm wide, 200 μm deep, and 1.5 cm long. The net feeder channel volume to MHP volumes ratio was 600:1.
Each bacterial strain was grown separately in LB broth at 24 °C to an A600 nm of 0.6. Then, the liquid cultures were mixed at the appropriate ratios to create mixtures containing 50% of each strain. The chips were sealed with membrane of polydimethylsiloxane and filled with fresh LB broth. The chip was inoculated by bringing a small amount of the liquid cultures (<100 μL) into contact with ports on each sides of the MHP array. A glass slide topped with a thin layer of uncured polydimethylsiloxane is then used to seal the back of the device. We scanned the MHP array every 30 min by an automated microscope using a different excitation filter for each color channel.
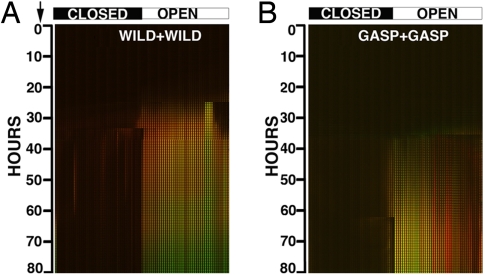
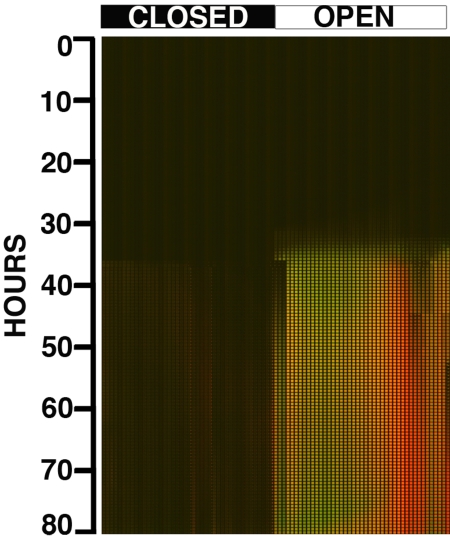
The line of recorded images was stacked to create a montage with increasing time from inoculation running from top to bottom, as shown in Figs. 2 and 3. There is an enormous amount of information at high spatial density in the stacked images that these experiments create. The bacterial strains appeared to form loose, sessile strain-specific aggregates within each MHP within hours of inoculation. Such aggregation might be expected considering the body of literature establishing that cell signaling networks exist [quorum sensing (22), chemotaxis (23)] that allow cells to communicate and possibly separate themselves from other strains. The existence of 2 color channels and 4 strains allowed us to do a series of control experiments. We limited our experiments to ≈3 days in duration to avoid genomic changes driven by stress, which may convert the WT to a GASP mutant or further evolve the GASP phenotype (12). Fig. 2 presents data from the wild–wild and GASP–GASP control experiments. Fig. 3 presents the montages of the competition experiment in which we coincubated the GFP producing WT JEK1036 (green) with the GASP RFP producing JEK1033 (red). The competition occurs as the WT grows and conditions the sealed environment, and the GASP mutant strain proceeds to grow in the conditioned medium.
Fig. 2.
Montage of the images obtained from 2 control experiments. (A) Control experiment consisting of JEK1036 (green) and JEK1037 (red) WT in coculture. (B) Control experiment consisting of JEK2032 (green) and JEK1033 (red) GASP mutant in coculture. The image stack corresponds to 80 h of run time, NS opens are shown along the top of the 3 montages, all closed to the Left, all open to the Right.
Fig. 3.
Montage of the images obtained from the competition experiment: GFP WT JEK1036 vs. RFP GASP JEK1033. The image stack corresponds to 80 h of run time; NS opens are shown along the top of the montage, all closed to the Left, all open to the Right.
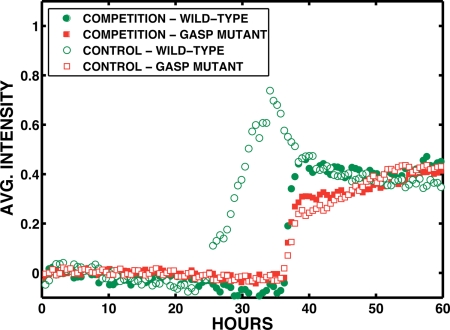
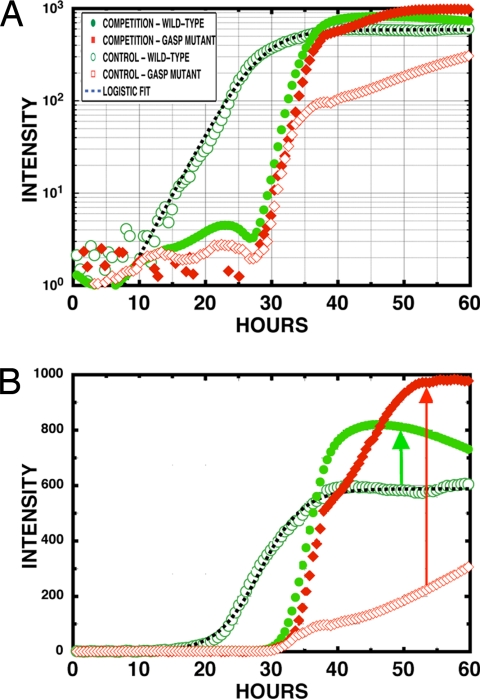
Figs. 4 and 5 show the population densities in the closed and open regions of the chip, respectively, both in the control experiment (wild–wild) and in the competition (GASP–GASP) experiment. Note that in these growth curves the intensity is measured from the green channel fluorescence for the WT strain JEK1036 and from the red channel for the GASP strain JEK1033 in both the control and competition experiments. This ensures that differences of intensities of the chromophore do not affect the analysis. The control experiments assess the phenotypic identity of the WT strains, JEK1036 (green) and JEK1037 (red), and the GASP strains, JEK1032 (green) and JEK1033 (red), show how the WT and GASP mutant strains respond to differing levels of stress in the absence of competition.
Fig. 4.
Averaged fluorescent intensities in the closed region of the array. The open and filled circles are the WT control and competition growth curves, respectively, whereas the open and filled diamonds are the GASP-type control and competition growth curves, respectively.
Fig. 5.
Averaged fluorescent intensities in the open region of the array. The open and filled circles are the WT control and competition growth curves, respectively, whereas the open and filled diamonds are the GASP-type control and competition growth curves, respectively. (A) Semilog intensity vs. time. (B) Linear intensity vs. time.
We expect that the WT strains will follow the logistic growth in a fresh, unconditioned LB medium and in the absence of competition with other strains (such as a GASP mutant). In the control experiments, we expect that entry by the WT into stationary phase will occur earlier in the closed region because of the more rapid depletion of the medium. We expect that the GASP mutant will grow slowly upon initial inoculation into the array but will accelerate its growth as the medium acquires a chemical composition to which it is adapted (conditioned LB). The GASP mutant might paradoxically grow more rapidly in the closed region than the open region because it is preadapted to stress.
Some of our qualitative expectations are borne out in the control (no competition) experiments, which are shown in Figs. 4 and 5 with open symbols. The WT strain follows logistic growth in the open half of the chip and has a higher fitness than the GASP mutant, suggesting that it is adapted for fresh medium whereas the GASP mutant is not. The GASP strain grows slowly in the open region and then produces a population surge in the closed region, as presumably the medium conditions, followed by slow continued growth in both regions. The apparent burst of growth of the GASP mutant at ≈35 h actually correlates with a decrease in population of the GASP mutant in the open region, so this event may be a movement of the GASP strains stressed by the absence of conditioned medium in the closed region. We reported and discussed similar transverse population dynamics in earlier experiments (21). The WT strain also shows pronounced dynamics in the open region and probable movement of the population into the closed region, again at ≈30 h, which seems to be a common time for invasions. The GASP mutant behavior is difficult to describe as simple logistic growth even in the control experiment cultures with only a single strain present.
The competition experiment yields rather startling results. In the closed region, competition does not seem to aid the fitness of either strain. There is a modest increase of fitness for both the WT and the GASP. However, in the open section, competition profoundly changes the dynamics. First, the presence of the GASP mutant strongly suppresses the initial growth of the WT strain despite the same inoculation frequency of the control and competition experiments. The WT strain in competition delays growth by ≈20 h and is now very similar to the GASP mutant growth. Competition dramatically aids the fitness of the GASP mutant, with a nearly 2-fold increase in population density, whereas the WT experiences a smaller 25% increase in population density; both fitness advantages are measured compared with homogeneous control cultures. Further, in neither the case of the open or closed areas does the GASP mutant population fraction tend toward unity, in contrast to our expectations suggested from experiments in homogeneous and stirred environments (14). This simply means that in a spatially inhomogeneous environment the deterministic aspects of strain domination based on GASP adaptation do not necessarily happen.
Discussion: Spatial Analysis of Fluorescence Images
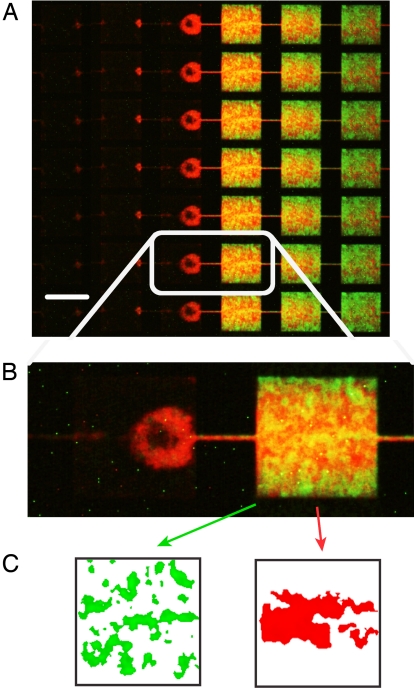
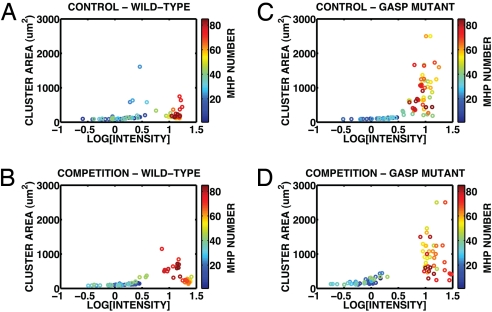
Rather than merely coexisting, the WT and the GASP mutant simultaneously display increased fitness in competition, as we see in Fig. 5. How is this possible when we might expect from previous stirred experiments that the GASP mutant could overwhelm or at least inhibit the WT (14). We use the spatial information that our nanofabricated experiment affords to ask two questions about this mutually beneficial interaction. Examination of the cell densities within each MHP reveals that the bacteria are not uniformly distributed within a particular patch as seen in Fig. 6. Instead, the bacteria form loose aggregates, and most individuals lose motility after ≈24 h of incubation. The visual appearance of this soft aggregation, which as we will show is surprisingly strain-specific, is reminiscent of cell–cell binding made possible with curly amyloids (24). The aggregations occur both in the control experiments and in the competition experiments, indicating that aggregation is not solely caused by competition but is an intrinsic aspect of the strain phenotype. The patterns can be quantified in terms of the size of aggregates in μm2 A and the cell densities i within each patch, as discussed in Materials and Methods and shown in Fig. 6C. We have done a cluster size analysis on images acquired 40 h after inoculation and plotted the 〈A〉 and 〈I〉 couples for each of the 85 MHPs as in Fig. 7.
Fig. 6.
Fluorescence images of competing populations in MHPs. (A) True-color image of the fluorescence of the chain of MHPs stacked vertically for JEK1033 (GASP bacteria, red RFP) and JEK1036 (WT bacteria, green GFP) competitive cohabitation. This image corresponds to an enlargement of the interface region between the closed and open regions ≈50 h into the run. (B) Two neighboring patches across the interface between 0 external nutrient diffusion (Left) and full external nutrient diffusion (Right). (C) Result of the cluster size analysis performed on the B, Right patch.
Fig. 7.
Patch size and population density for (A) GASP+GASP JEK1033 control, (B) WT+WT JEK1036 control, (C) GASP JEK1033 competition experiment, (D) WT JEK1036 competition experiment. The MHP numbers are color coded, with lower numbers (closed MHPs) coded blue to blue–green and the higher numbers (open MHPs) coded yellow to red.
The results of the analysis confirm that both strains, especially the GASP mutant, display increased fitness upon competition culturing. However, the plots also show that the average local patch size of the GASP strains in the open region is consistently 5 times the area of the WT strains in the competition experiment and that this feature was retained from the control experiments. The consistency of the cluster sizes between control and competition cultures suggest that the WT and GASP phenotypic identities are stable during coculturing. Consequently, the fluorescence images recommend proposing a mechanism for the increased fitness of both strains during competition that does not rely on complete phenotypic change of either strain. If the strains retain their phenotypes under competition, we can associate red fluorescence with GASP cells and green fluorescence with WT cells and thus interpret confidently the interaction between color channels in our montages as interactions between the 2 strains. We return to the competition fluorescence montage in Fig. 3 to ask how strain interaction manifests itself spatially. Within the open region, we see that the red GASP cells separate from the green WT cells. The green cells populate the majority of the open region with a depressed density 3/4 of the distance from the closed–open interface to the rightmost edge of the chip. Precisely in this depression, the red GASP population peaks. The coincidence in the peak between the GASP fluorescence and the valley in the WT fluorescence is sharply localized. The 2 strains avoid each other. The red and green color channels in the control experiments are smoother and do not fit each other like a lock and key as do the competition color channels.
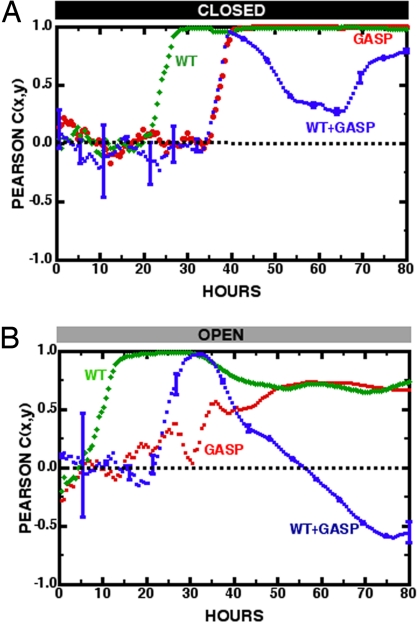
To confirm quantifiably that the color channels in competition are truly segregated, we computed the Pearson correlation coefficient Cx,y between vector datasets x and y, consisting of the fluorescence intensities of the green (xi) and red (yi) channels:
dEach element xi or yi is an intensity averaged within a given MHP i, 〈x〉 is the average value of the xi elements over a region of MHPs, and σx is the standard deviation of the xi values over the same region, etc. Cx,y varies in value from +1 for perfectly correlated data to −1 for perfectly anticorrelated data, with a value of 0 if the datasets have no correlation at all. Fig. 8 presents the results of a Pearson correlation as a function of time for both the open and closed regions, for both the control experiments with red and green WT+WT and red and green GASP+GASP, and competition experiments of green WT+red GASP. If the 2 strains of bacteria simply ignored each other but still interacted with the environment in the same way, Cx,y would be +1, which is approximately the case for both the closed and open regions of the MHP landscape for the control experiments. If there were a mutual exclusion of the WT and GASP mutants in a competition experiment, one would expect Cx,y = −1, and this in fact seems to develop in competition at times greater than ≈40 h; afterward, the 2 strains remain largely separated. Pearson correlation values descending below −0.5 confirm the presence of anticorrelation as expected from visual inspection of Fig. 6.
Fig. 8.
Cx,y vs. time in hours after inoculation for the closed and open regions of the MHP array. Error bars are shown for only the WT+GASP competition experiments. (A) Closed region. WT+WT control cross-correlations between red and green strains are green diamonds, GASP+GASP control cross-correlation between red and green strains are red circles, WT+GASP competition cross-correlation between red and green strains are blue squares. (B) Open region. WT+WT control cross-correlation between red and green strains are green diamonds, GASP+GASP control cross-correlation between red and green strains are red circles, WT+GASP competition cross-correlation between red and green strains are blue squares.
Conclusion
The identification of a mechanism for the WT–GASP interaction constitutes a microbiological approach, one we have not carried out in these experiments. As West discusses (25), the evolutionary approach asks a complementary question to this work: how do the mechanisms increase a biological system's fitness in natural environments? Here we have conducted biophysical experiments and developed a quantitative description of the spatiotemporal patterns characteristic of these adaptations.
At the start of this article we posed some questions concerning the purpose of our experiments. We now have some answers. (Q1) What is the influence of habitat on competition? (A1) The open region shows significant fitness enhancement (as maximum long-term productivity of biomass) upon mixture for both strains, but the closed region shows minimal changes. (Q2) What is the optimum fraction of WT and GASP mutant cells that maximizes fitness for the combination of WT and GASP mutants? (A2) We tested 3 inoculation population fractions: (i) all WT, (ii) 50/50 WT and GASP, and (iii) all GASP. Of the 3 populations tested, the 50/50 mixture optimized the fitness. (Q3) What is the time course approach to this solution? (A3) As described earlier, the pelagic stage lasts for maybe 20 h, perhaps seeding initial fluctuations into the spatial distribution of cells. A sessile stage begins. Sessile growth freezes in spatial patterns in the open region of the chip. GASP mutants survive in the closed half of the chip. We find it interesting that these separate phases are taken because previous experiments forced cells to exhibit a uniform degree of spatial mixture throughout the duration of those experiments. Using unstirred aqueous growth medium, we allowed the cells to use, at different times, different degrees of motility.
Our experiments should map into attempts to simulate the bacterial adaptive behavior (computation) by including a multiscale approach including at least (i) mutually beneficial interactions at longer-length scales and (ii) less beneficial interactions at intermediate scales. It would be interesting to learn how these local cell–cell interactions might determine critical scales of biomass aggregation (multiscale cluster structure) that we expect from the emergence of a distributed computation (4). Unlike the case of stomata collectively computing (through hydraulic coupling) conductance to maximize CO2 uptake/water-release balance at the level of the whole plant (6, 7), in our bacterial community the unit of selection is less clear. Multiscale structures (seen here as cluster associations) are the signature of multilevel selection operating at the levels of cells and their ensembles. Ultimately, it is the community biofilm that collectively computes (through ecological coupling) the adaptations, which integrate information (from landscape scales back to the scale of cell–cell interactions), and maximizes total productivity.
Materials and Methods
We estimate that the highest cell densities reached are ≈0.3/μm3, or ≈4 OD per cm as measured by using light scattering. We moved (P1 transduction) rpoS alleles into bacterial strain carrying fluorescent proteins (GFP and RFP) inserted in the lac operon. The lacYZ::GFP2 construct is an rpoS 819 (green) strain and was assigned the name JEK1032, and the construct W3110 [lacYZ::mRFP-1, rpoS 819 (red) = JEK1033]. WT strains (rpoS wt) carrying the wt allele were also made in a similar fashion: JEK1036 = W3110 lacYZ::GFPmut2, rpoS wt (green) and (red) JEK1037 = W3110 lacYZ::mRFP-1, rpoS wt. Because both the WT strains (JEK1036, green and JEK1037, red) and the GASP strains (JEK1033, red and JEK1032, green) were constructs, we verified by performing competition experiments with fluorescent markers reversed that the clustering behavior depended only on the rpoS alleles, not the fluorescent protein (data not shown). We confirm the rpoS allele of our constructs by PCR with forward primer 5′-TCACCCGTGAACGTGTTC-3′ and reverse primer 5′-GTTAACGACCATTCTCG-3′. DNA sequencing of the PCR products was done by using GENEWIZ service. The only difference between alleles is a duplication in the GASP rpoS 819 of sequence (gcaggggctgaatatcgaa). A fully computer-controlled epifluorescence microscope (Nikon Eclipse 90i) scanned the MHP array in 2-color channels (green and red fluorescence emission). Our experience with lysed bacteria is that the GFP and RFP proteins degrade in the lysate in <0.5 h, so we believe that the fluorescence intensity is a linear measurement of the living unlysed bacterial density in the MHP. The cell density in the MHPs is capable of achieving levels substantially higher than those that occur in standard bacterial culture tubes, but the actual steady-state population depends very much on the food supply, that is, on the fraction of NS open. The measure of the aggregate sizes of the 2 strains was quantitatively analyzed from the montage images shown in Figs. 2 and 3 as shown in Fig. 6. This was done by extracting the pixels in the 75th percentile or up and computing the average area of the contiguous domains 〈A〉 in the green (WT) and red (GASP mutant) color channels. The mean fluorescence intensity 〈I〉 of each MHP, which is proportional to the local population density of WT or GASP bacteria, is also calculated for both color channels.
Acknowledgments.
We thank Simon Levin, Roberto Kolter, Stuart West, Ted Cox, Miguel Gaspar, Ned Wingreen, Pascal Silberzan, Tom Silhavy, Cees Dekker, Saeed Tavazoie, and Michael Desai for valuable discussions and Steve Finkel, Juliana Malinverni, Mark Mandel, and Peter Wolanin for assistance with the E. coli fluorescent constructs. This work was supported by Delft University of Technology Start-up funds, Air Force Office of Scientific Research Grant FA9550-05-01-0365, National Institutes of Health Grant HG01506, National Science Foundation Nanobiology Technology Center Grant BSC-ECS9876771, Cornell NanoScale Science and Technology Facility (National Science Foundation Grant ECS-9731293), the Department of Defense NDSEG fellowship program, the Natural Sciences and Engineering Research Council of Canada, and the Defense Advanced Research Planning Agency.
Footnotes
The authors declare no conflict of interest.
References
- 1.Gates W, Rinearson P, Myhrvold N. The Road Ahead. Waterville, ME: Wheeler Publishing; 1996. [Google Scholar]
- 2.Hardin G. The tragedy of the commons. Science. 1968;162:1243–1248. [PubMed] [Google Scholar]
- 3.O'Donnell AG, Young IM, Rushton SP, Shirley MD, Crawford JW. Visualization, modeling and prediction in soil microbiology. Nat Rev Microbiol. 2007;5:689–699. doi: 10.1038/nrmicro1714. [DOI] [PubMed] [Google Scholar]
- 4.Crutchfield J, Mitchell M. The evolution of emergent computation. Proc Natl Acad Sci USA. 1995;92:10742–10746. doi: 10.1073/pnas.92.23.10742. [DOI] [PMC free article] [PubMed] [Google Scholar]
- 5.Wakabayashi K, Yamamura M. A design for cellular evolutionary computation by using bacteria. Nat Comput. 2005;4:275–292. [Google Scholar]
- 6.Peak D, West JD, Messinger SM, Mott KA. Evidence for complex, collective dynamics and emergent, distributed computation in plants. Proc Natl Acad Sci USA. 2004;101:918–922. doi: 10.1073/pnas.0307811100. [DOI] [PMC free article] [PubMed] [Google Scholar]
- 7.Mott KA, Peak D. Stomatal patchiness and task-performing networks. Ann Bot. 2007;99:219–226. doi: 10.1093/aob/mcl234. [DOI] [PMC free article] [PubMed] [Google Scholar]
- 8.Barkai N, Leibler S. Robustness in simple biochemical networks. Nature. 1997;387:913–917. doi: 10.1038/43199. [DOI] [PubMed] [Google Scholar]
- 9.Fraga ME, Esteller M. DNA methylation: A profile of methods and applications. BioTechniques. 2002;33:632–649. doi: 10.2144/02333rv01. [DOI] [PubMed] [Google Scholar]
- 10.Karpinets TV, Greenwood DJ, Pogribny IP, Samatova NF. Bacterial stationary-state mutagenesis and mammalian tumorigenesis as stress-induced cellular adaptations and the role of epigenetics. Curr Genomics. 2006;7:481–496. doi: 10.2174/138920206779315764. [DOI] [PMC free article] [PubMed] [Google Scholar]
- 11.Zambrano MM, Siegele DA, Almiron M, Tormo A, Kolter R. Microbial competition: Escherichia coli mutants that take over stationary phase cultures. Science. 1993;259:1757–1760. doi: 10.1126/science.7681219. [DOI] [PubMed] [Google Scholar]
- 12.Finkel SE, Kolter R. Evolution of microbial diversity during prolonged starvation. Proc Natl Acad Sci USA. 1999;96:4023–4027. doi: 10.1073/pnas.96.7.4023. [DOI] [PMC free article] [PubMed] [Google Scholar]
- 13.Zinser ER, Kolter R. Mutations enhancing amino acid catabolism confer a growth advantage in stationary phase. J Bacteriol. 1999;181:5800–5807. doi: 10.1128/jb.181.18.5800-5807.1999. [DOI] [PMC free article] [PubMed] [Google Scholar]
- 14.Vulic M, Kolter R. Evolutionary cheating in Escherichia coli stationary phase cultures. Genetics. 2001;158:519–526. doi: 10.1093/genetics/158.2.519. [DOI] [PMC free article] [PubMed] [Google Scholar]
- 15.Tanaka K, Takayanagi Y, Fujita N, Ishihama A, Takahashi H. Heterogeneity of the principal σ factor in Escherichia coli: The rpoS gene product, σ38, is a second principal σfactor of RNA polymerase in stationary-phase Escherichia coli. Proc Natl Acad Sci USA. 1993;90:3511–3515. doi: 10.1073/pnas.90.8.3511. [DOI] [PMC free article] [PubMed] [Google Scholar]
- 16.Hengge-Aronis R. Recent insights into the general stress response regulatory network in Escherichia coli. J Mol Microbiol Biotechnol. 2002;4:341–346. [PubMed] [Google Scholar]
- 17.Ishihama A. Functional modulation of Escherichia coli RNA polymerase. Annu Rev Microbiol. 2000;54:499–518. doi: 10.1146/annurev.micro.54.1.499. [DOI] [PubMed] [Google Scholar]
- 18.Tilman D, Downing JA. Biodiversity and stability in grasslands. Nature. 1994;367:363–365. [Google Scholar]
- 19.Durrett R, Levin S. The importance of being discrete (and spatial) Theor Pop Biol. 1994;46:363–394. [Google Scholar]
- 20.Durrett R, Levin S. Allelopathy in spatially distributed populations. J Theor Biol. 1997;185:165–171. doi: 10.1006/jtbi.1996.0292. [DOI] [PubMed] [Google Scholar]
- 21.Keymer JE, Galajda P, Muldoon C, Park S, Austin RH. Bacterial metapopulations in nanofabricated landscapes. Proc Natl Acad Sci USA. 2006;103:17290–17295. doi: 10.1073/pnas.0607971103. [DOI] [PMC free article] [PubMed] [Google Scholar]
- 22.Bassler BL. Small talk: Cell-to-cell communication in bacteria. Cell. 2002;109:421–424. doi: 10.1016/s0092-8674(02)00749-3. [DOI] [PubMed] [Google Scholar]
- 23.Berg HC. A physicist looks at bacterial chemotaxis. Cold Spring Harbor Symp Quant Biol. 1988;53:1–9. doi: 10.1101/sqb.1988.053.01.003. [DOI] [PubMed] [Google Scholar]
- 24.Barnhart MM, Chapman MR. Curli biogenesis and function. Annu Rev Microbiol. 2006;60:131–147. doi: 10.1146/annurev.micro.60.080805.142106. [DOI] [PMC free article] [PubMed] [Google Scholar]
- 25.West SA, Griffin AS, Gardner A, Diggle SP. Social evolution theory for microorganisms. Nat Rev Microbiol. 2006;4:597–607. doi: 10.1038/nrmicro1461. [DOI] [PubMed] [Google Scholar]


