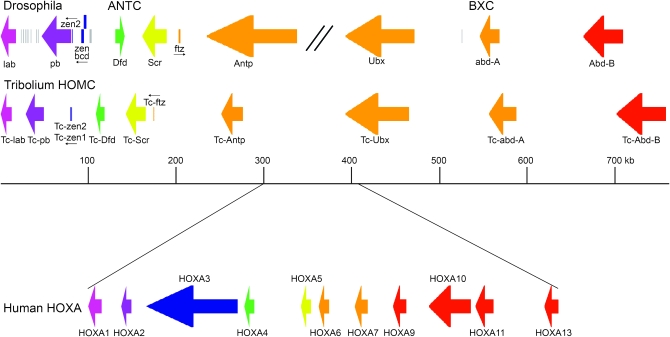
Figure 2.—
A comparison of the size and organization of the Hox clusters of Drosophila and Tribolium, as well as one of the human clusters. The sizes of the primary transcripts are shown, and for most the direction of transcription is indicted. For Hox genes, more closely related genes are indicated by common colors. Additional non-Hox genes in the Drosophila cluster are shown in gray.

