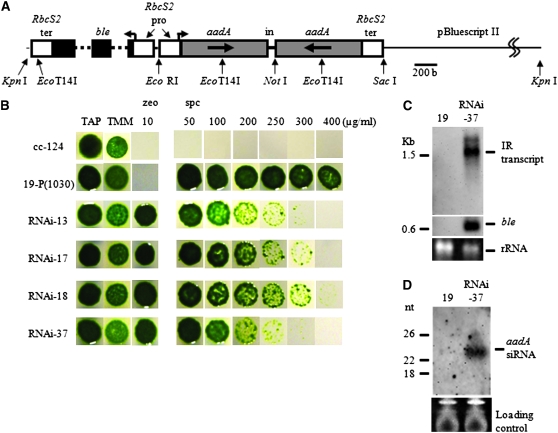
Figure 1.—
The silencer DNA construct and analysis of RNAi-induced cell features. (A) Restriction enzyme sites utilized to make this construct are indicated by arrows. A 786-bp coding region for the aadA gene (gray box) with a deletion of the first 15 bases was arranged to make an inverted repeat. A 79-bp fragment containing the second intron of COX2 was located in the middle of the inverted repeat. A ble gene (black box) was used as a transformation marker. This gene carries two copies of the first intron of RbcS2 (dotted line) that provides transcriptional enhancer activity. To regulate transcriptional activity of the silencer construct and the ble marker gene, the C. reinhardtii RbcS2 promoter and RbcS2 terminator (white box) were used. The silencer DNA construct and the marker gene were arranged in opposite transcriptional directions. In, intron; pro, promoter; ter, terminator. (B) Results of the spotting tests for cells transformed with the silencer DNA construct. cc-124, wild-type; 19-P[1030], a cc-124 transformant that stably expresses the aadA mRNA; RNAi-13, -17, -18, and -37, 19-P[1030] transformants of an aadA silencer DNA plasmid linearized by KpnI. TAP, Tris–acetate–phosphate medium; TMM, TAP not containing acetate; zeo, zeocin; spc, spectinomycin. (C) Detection of the aadA IR transcript by Northern blot analysis. Hairpin RNA transcribed from the silencer DNA construct was detected by a DIG-labeled sense-aadA RNA probe. Analysis of the same blot with a ble probe was also carried out. About 10 μg of total RNA was loaded per lane. Ethidium bromide staining of the agarose gel was carried out to confirm that equal amounts of RNA were loaded per lane. (D) Detection of siRNA. A small-sized RNA fraction prepared from 30 μg of total RNA was loaded into an 8-m urea-containing 15% polyacrylamide gel. After RNA was transferred to a membrane, detection was carried out by a sense-aadA RNA probe. Ethidium bromide staining of the polyacrylamide gel was carried out to monitor the amount of the loaded RNA. Positions of molecular weight marker bands are shown on the left of each hybridization photogram.

