

Abstract
Protein kinase C (PKC) is implicated in the potentiation of Cav 2.3 currents by acetyl-β-methylcholine (MCh), a muscarinic M1 receptor agonist or phorbol-12-myristate, 13-acetate (PMA). The PKC isozymes responsible for the action of MCh and PMA were investigated using translocation as a measure of activation and with isozyme-selective antagonists and siRNA. Cav channels were expressed with α1 2.3, β1b and α2δ subunits and muscarinic M1 receptors in the Xenopus oocytes and the expressed currents (IBa) were studied using Ba2+ as the charge carrier. Translocation of PKC isozymes to the membrane studied by Western blot revealed that all eleven known PKC isozymes are present in the Xenopus oocytes. Exposure of the oocytes to MCh led to the translocation of PKC α whereas PMA activated PKC βII and ε isozymes. The action of MCh was inhibited by Go 6976, an inhibitor of cPKC isozymes or PKC α siRNA. PMA-induced potentiation of Cav 2.3 currents was inhibited by CG533 53, a PKC βII antagonist, βIIV5.3, a peptide translocation inhibitor of PKC βII or PKC βII siRNA. Similarly, εV1.2, a peptide translocation inhibitor of PKC ε or PKC ε siRNA inhibited PMA action. The inhibitors of PKC increased the basal IBa slightly. It is possible that some PKC isozymes have negative control over the IBa. Our results implicate PKC α in the potentiation of Cav 2.3 currents by MCh and PKC βII and ε in the potentiation of Cav 2.3 currents by PMA.
Classification of terms: Section: 3. Neurophysiology, Neruopharmacology and other forms of Interceullular communication
Keywords: PKC, Voltage-gated Calcium channels, Xenopus oocytes, Phosphorylation, Muscarinic receptors, Phrobol ester, MCh
1. Introduction
Voltage–gated calcium channels (Cav) mediate calcium influx in response to membrane depolarization and regulate intracellular processes such as contraction, secretion, neurotransmission and gene expression (Dolphin, 2006). Cav channels are heteromultimers composed of an α1 subunit and three auxillary subunits: β, α2δ and γ. The α1 subunit has the channel pore, modulates channel gating and has drug binding sites; the auxillary subunits modify the expression of the channels and the kinetics of the current (Walker and De Waard, 1998). Ten α1 subunits have been identified, which are grouped under three families, Cav 1.0, 2.0 and 3.0. Members of the Cav 1.0 family are encoded by α1 1.1, 1.2, 1.3 and 1.4 subunits; Cav 2.0 family is encoded by α1 2.1, 2.2 and 2.3 subunits; Cav 3.0 family is encoded by α1 3.1, 3.2 and 3.3 subunit DNAs (Elmslie, 2003; Ertel et al., 2000). The intracellular segments of the α1 subunit, viz., the N- and C- termini and the loops between domains I and II, II and III, and III and IV, possess the binding/recognition sites for second messengers such as G-protein βγ subunits, intracellular Ca2+ ([Ca2+]ί) as well as sites that can be phosphorylated by protein kinase C (PKC) (Hamid et al., 1999; Melliti et al., 2000; Stea et al., 1995; Zuhlke and Reuter, 1998).
PKC is a family of serine/theronine kinases that regulate cellular responses elicited by hormones, neurotransmitters, and growth factors (Nishizuka, 1988). The PKC family can be divided into three subfamilies based on the difference in sequence homology between the isozymes and the requirement for cofactors. The classic PKCs (cPKC; α, βI, βII and γ) require calcium and are stimulated by phosphatidylserine and diacylglycerol (DAG). Novel PKCs (nPKCs; δ, ε, θ and η) are calcium-independent but still stimulated by phosphatidylserine and DAG. Members of the third category, atypical PKCs (aPKCs; ζ, λ/ι and µ) are Ca2+ and DAG–independent. PKC activation by phorbol-12-myristate, 13-acetate (PMA) enhanced Cav 2.2 or 2.3 currents, whereas Cav 1.2c or 2.1 currents were not affected. In contrast, acetyl-β-methylcholine (MCh), which also leads to PKC activation, potentiated Cav 2.3 currents, decreased Cav 1.2c currents, and failed to modulate Cav 2.1 or 2.2 currents (Kamatchi et al., 2003). The differential response of the Cav currents to PMA and MCh may be attributed to i) the kind of PKC isozyme(s) activated and ii) the presence of PKC isozyme-selective phosphorylation sites in the α1 subunit of the Cav channels. It was suggested that while cPKC is involved in the action of MCh, both cPKC and nPKC are required for the action of PMA (Kamatchi et al., 2003). Mutation analysis revealed Ser-888, Ser-892, Ser-984 in the II-III linker and Ser-1987 in the C-terminus as MCh–selective potential PKC phosphorylation sites in the α1 2.3 subunit. In contrast, Thr-365, Ser-369 in the I-II linker and Ser-1995 and Ser-2011 in the C-terminus of α1 2.3 subunit were identified as both MCh- and PMA–selective sites (Kamatchi et al., 2004; Fang et al., 2005). In the α1 2.2 subunit, Thr-422 and Ser-425 in the I-II linker and Ser-2108 and Ser-2132 in the C-terminus, the homologs of α1 2.3 Thr-365, Ser-369, Ser-1995 and Ser-2011, were the sites for PMA action (Fang et al., 2006). It is possible that the PKC isozymes activated by MCh and PMA target these specific Ser/Thr PKC phosphorylation sites.
The goal of the present study was to identify specific PKC isozymes involved in the potentiation of Cav 2.3 currents by MCh and PMA. We employed translocation assays, isozyme-specific antagonists and small interfering RNA (siRNA) for this purpose. Our results show that PKC α is involved in the potentiation of Cav 2.3 currents by MCh and that PKC βII and ε are involved in the potentiation of Cav 2.3 currents by phorbol ester.
2. Results
2.1. PKCs α, βII and ε translocate from cytosol to membrane in Xenopus oocytes
The Xenopus oocyte expression system is convenient for investigating the modulation of cloned ion channels and receptors. Endogenously they express the required constituents for receptor activation including G-proteins, phospholipase C (PLC) and PKC (Dascal, 1987; Snutch, 1988). However only a few reports are available on the identification of individual PKC isozymes in Xenopus oocytes. Those studies reported the presence of isozymes α, βI, βII, γ, δ and ζ in Xenopus oocytes (Johnson and Capco, 1997; Stith et al., 1997). In the current study, in addition to the above, we also have identified isozymes ε, θ, η, λ/ι and µ. Thus, all eleven PKC isozymes shown in mammals exist in the Xenopus oocytes. The molecular weight of the Xenopus PKC isozyme proteins varies from 75 to 90 kDa, similar to their counter parts in mammals (Wetsel et al., 1992; Stumpo et al., 1994).
Translocation of the PKC isozymes after exposure to MCh (1 µM) or PMA (100 nM) for 2 min was studied by Western blot. The response of PKCs α, βII and ε to these agents is shown in Fig. 1 with representative Western blots in Fig. 1A and quantification of these blots in Fig. 1C. None of the other isozymes showed a significant translocation in response to these stimuli in this time frame (data not shown). The purity of our cytosolic fraction (CF) and membrane fraction (MF) is demonstrated in Fig. 1B. The α1 2.3 subunit (170 KDa), a membrane component is present in the MF and the β1b subunit (55 KDa), a cytosolic component is shown in CF of the oocytes. PKC α was translocated to membrane in response to MCh, where as there was a significant increase in PKC βII and ε in the MF in response to PMA.
Fig. 1A, 1B and 1C. Effect of MCh and PMA on PKC isozymes.
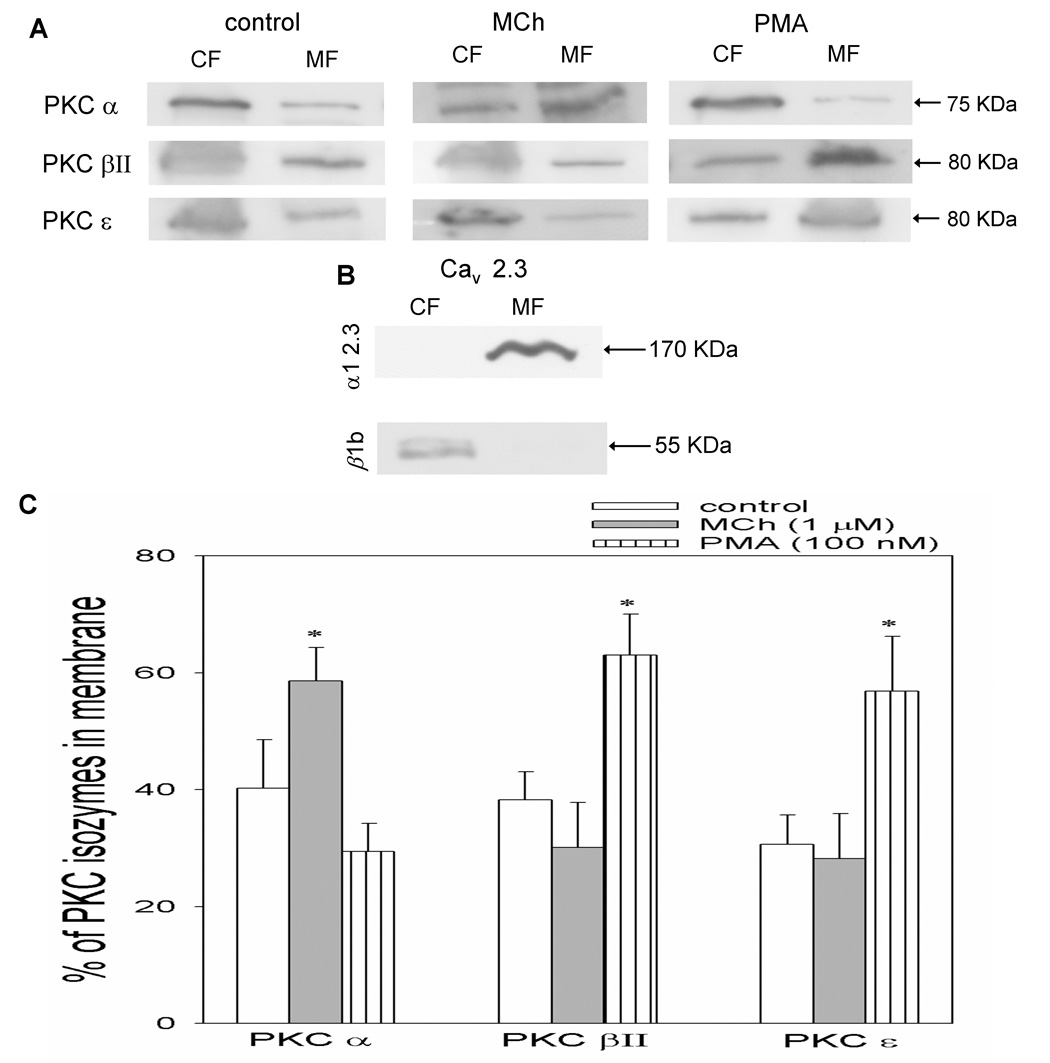
The Xenopus oocytes expressing Cav 2.3 channels and M1 receptors were exposed to MCh (1 µM) or PMA (100 nM) for 2 minutes. Fig. 1A shows representative Western blots of CF and MF from control, MCh-and PMA-treated oocytes probed for PKCs α, βII and ε. Fig. 1B shows representative Western blots of CF and MF from Cav 2.3 oocytes probed for α1 2.3 and β1b subunits and displays the purity of our CF and MF. Fig. 1C shows the average values from densitometry analysis of 3 separate experiments. *p< 0.05 as compared with control; Student’s t-test.
2.2. PKC α may be involved in MCh-induced potentiation of Cav2.3 currents
Since PKC α is translocated to the membrane in response to MCh, various antagonists of this isozyme were employed to further examine the role of PKC α in the action of MCh. Xenopus oocytes were challenged with MCh after the injection of Go 6976 (10 µM), an inhibitor of cPKCs including PKC α, into the oocytes (Benussi et al., 1998). There was a significant inhibition of the MCh response in the oocytes pretreated with Go 6976 compared to control (Fig. 2). Since many PKC inhibitors affect several isozymes within a cell, the action of MCh was examined in oocytes injected with an siRNA for the PKC α isozyme. PKC α siRNA-injected oocytes were fractionated and probed with the PKC α antibody in order to check the efficacy of the siRNA. PKC α was totally depleted in the oocytes injected with PKC α siRNA when compared to control 16 hours after the siRNA injection (Fig. 3A). The action of MCh was significantly inhibited by PKC α siRNA while the scrambled PKC α siRNA failed to decrease the action of MCh (Fig. 3B). SiRNA for the other members of the cPKC isozymes failed to modify M1 receptor-induced potentiation of Cav2.3 channels by MCh (Fig. 3B).
Fig. 2. Effect of non-specific PKC inhibitor (Go 6976) on MCh-induced potentation of Cav 2.3 currents.
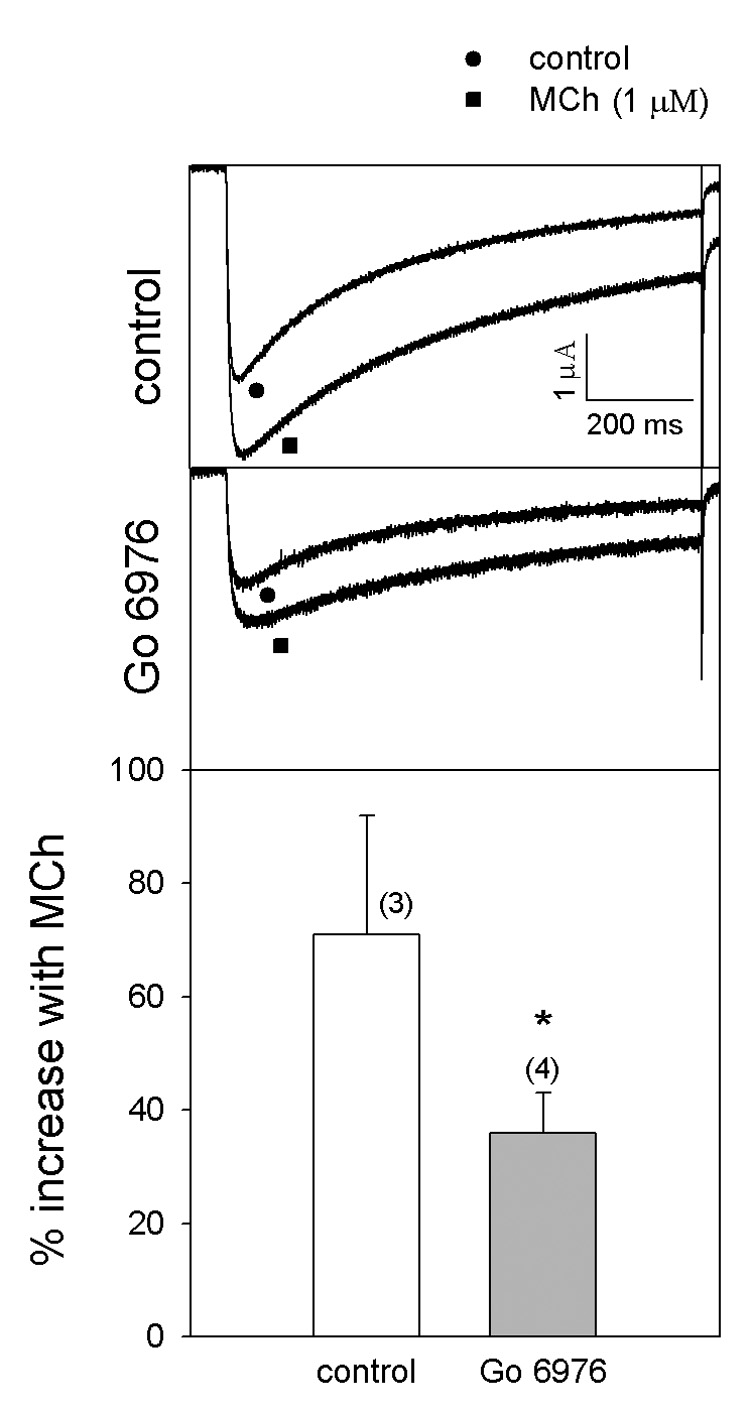
Cav 2.3 currents were expressed with α1 2.3, β1b and α2δ in Xenopus oocytes. The oocytes were incubated at 16°C for 7–8 days and voltage-clamped using −80 and 0 mV as holding and test potentials, respectively. Go 6976 (10 µM) was microinjected into the oocytes 3 hours before testing the currents. The top panel shows the potentation of Cav 2.3 currents by MCh in the control and the middle panel shows the inhibition of MCh affected by Go 6976. The bottom panel shows the average MCh response. The numbers in parentheses indicate ‘n’. *p<0.05 as compared with control; Student’s t-test.
Fig. 3A and 3B. Effect of MCh after siRNA injection for cPKCs.

Fig. 3A. Control and PKC α siRNA (100 µM)-injected oocytes were fractionated and probed with PKC α antibody. Fig. 3B. Cav 2.3 currents were expressed with β1 2.3, α1b and α2δ in Xenopus oocytes. The oocytes were incubated at 16°C for 7–8 days and voltage-clamped using −80 and 0 mV as holding and test potentials respectively. The siRNAs for cPKC isozymes (100 µM) were microinjected into the oocytes the day before testing the currents. The top panels show the potentation of the current with MCh and the middle panels show the effects of siRNA on the MCh response. The bottom panels show the average MCh response. The numbers in parentheses indicate ‘n’. *p<0.05 as compared with control; Student’s t-test.
2.3. PKC βII and ε may be responsible for PMA-induced potentiation of Cav2.3 currents
Since PKC βII and ε were translocated to the membrane in response to PMA, potentiation of Cav2.3 currents by PMA was examined following pretreatment of the oocytes with modulators of these isozymes. Oocytes pretreated with either βIIV5.3, a peptide translocation inhibitor of PKC βII (10 µM) (Vijayaragavan et al., 2004), or CG533 53 (20 µM), a chemical inhibitor of PKC βII (Chalfant et al., 1996) displayed significantly decreased response to PMA (Fig. 4). The efficacy of PKC βII siRNA was tested by western blot before challenging the oocytes with PMA. Sixteen hours after injection of the siRNA, PKC βII was totally depleted from the oocytes compared with the control (Fig. 5A). Consistent with this, siRNA for PKC βII significantly inhibited the potentiation of Cav2.3 currents by PMA. Scrambled PKC βII siRNA or the siRNA for the other members of the cPKC family failed to modulate significantly the effect of PMA (Fig. 5B).
Fig. 4. Effect of PKC βII translocation inhibitor or PKC βII antagonist on PMA response.

Cav 2.3 currents were expressed with α1 2.3, β1b and α2δ in Xenopus oocytes. The oocytes were incubated at 16°C for 7–8 days and voltage-clamped using −80 and 0 mV as holding and test potentials respectively. βIIV5.3 (10 µM) or CG533 53 (20 µM) were microinjected into the oocytes 3 hours before testing the currents. The top panels show PMA-induced potentiation in the control and the middle panels show the effect of the modulators. The bottom panel shows the average PMA response. The numbers in parentheses indicate ‘n’. *p<0.05 as compared with control; Student’s t-test.
Fig. 5A and 5B. Effect of selected siRNA on PMA treatment.
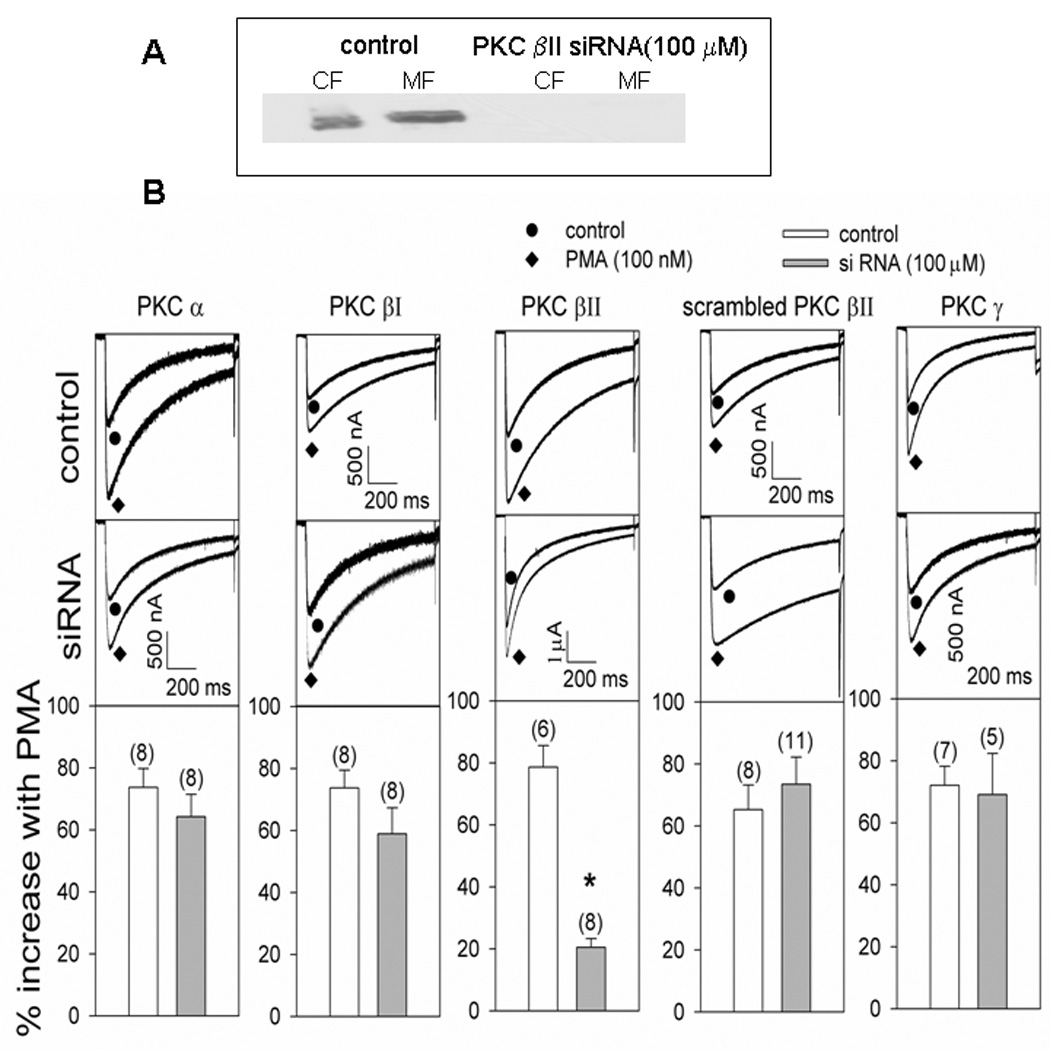
Fig. 5A. Control and PKC βII siRNA (100 µM) injected oocytes were fractionated and probed with PKC βII antibody. Fig. 5B. Cav 2.3 currents were expressed with α1 2.3, β1b and α2δ in Xenopus oocytes. The oocytes were incubated at 16°C for 7–8 days and voltage-clamped using −80 and 0 mV as holding and test potentials respectively. The top panels show the potentation with PMA in the control and the middle panels show the effect of siRNA injections. The bottom panels show the average effect of PMA. The numbers in parentheses indicate ‘n’. *p<0.05 as compared with control; Student’s t-test.
The contribution of PKC ε in PMA-induced potentiation of Cav2.3 currents was examined by using εV1.2, a peptide inhibitor of PKC ε translocation (Vijayaragavan et al., 2004) and PKC ε siRNA. Western blot probing revealed that PKC ε siRNA injection totally depleted PKC ε sixteen hours after its injection (Fig. 6A). Both εV1.2 and PKC ε siRNA significantly decreased the effect of PMA while scrambled PKC ε siRNA failed to do so (Fig. 6B).
Fig. 6A and 6B. Effect of PMA after the modulation of PKC ε.

Fig. 6A. Control and PKC ε siRNA injected oocytes were fractionated and probed with PKC ε antibody. Fig. 6B. Cav 2.3 currents were expressed with α1 2.3, β1b and α2δ in Xenopus oocytes. The oocytes were incubated at 16°C for 7–8 days and voltage-clamped using −80 and 0 mV as holding and test potentials respectively. The currents were tested one day and 3 hrs after the intracellular injection of siRNA (100 µM) or εV1.2 (10 µM) respectively. The top panels show PMA potentation and the middle panels show the effect of PKC ε modulators on the PMA response. The bottom panels show the average response to PMA. The numbers in parentheses indicate ‘n’. *p<0.05 as compared with control; Student’s t-test.
We noticed that the basal IBa was increased with siRNA for PKC isozymes βI and ε (Fig. 7). Since siRNA for PKC α, βII and γ did not affect the basal current significantly, specific inhibitory functions for PKCs βI and ε are suggested.
Fig. 7. Effect of PKC isozyme siRNA on the basal Cav 2.3 currents.

Cav 2.3 currents were expressed with α1 2.3, β1b and α2δ in Xenopus oocytes. The oocytes were incubated at 16°C for 7–8 days and voltage-clamped using −80 and 0 mV as holding and test potentials respectively. The currents were tested one day after the intracellular injection of siRNA (100 µM). The numbers in parentheses indicate ‘n’. *p<0.05 as compared with control; Student’s t-test.
3. Discussion
Several studies support a role for PKC in the enhancement (Swartz, 1993;Yang and Tsien, 1993; Kamatchi et al., 2003) or inhibition (Pemberton and Jones, 1997; Rane and Dunlap, 1986) of depolarization-evoked Cav currents by DAG, PMA or MCh. Although the auxiliary β subunit is required for this action (Stea et al., 1995; Kamatchi et al., 2003) most evidence suggests that PKC targets the α1 subunit. The contribution of α1 subunits is evident because only selected Cav currents are modulated. For example, MCh and PMA failed to modulate Cav 2.1 currents expressed in Xenopus oocytes. In contrast, Cav 1.2a currents expressed in mammalian (tsA-201) cells were decreased by PMA (McHugh et al., 2000). Cav 2.3 currents were potentiated by both MCh and PMA while Cav 2.2 currents were increased by PMA only (Kamatchi et al., 2004). The differential response of expressed Cav currents to the PKC activators may be related to the isozymes activated, the expression system used and the isozyme-selective Ser/Thr PKC phosphorylation sites available (Kamatchi et al., 2004; Fang et al., 2005).
In previous studies, use of PKC inhibitors/antagonists had suggested that cPKC isozymes are involved in the action of MCh and that nPKC isozymes are involved in the action of PMA (Kamatchi et al., 2003). In this study, Western blotting and densitometry analysis reveal that among the four cPKCs (α, βI, βII and γ), PKC α is translocated to the membrane in response to MCh (see Fig. 1A and C). The involvement of PKC α in the action of MCh was further supported by the blockade of its effect with the cPKC inhibitor Go 6976 (see Fig. 2) and PKC α siRNA (see Fig. 3B). The observation that siRNA for the other members of cPKC isozymes did not affect MCh response speaks for the specificity of PKC α in the action of MCh. MCh stimulates muscarinic M1 receptors to activate G proteins (Gαq and G α11) and phospholipase C, resulting in the production of DAG and inositol-1, 4, 5-triphosphate (IP3). IP3 releases [Ca2+]ί, a cofactor for cPKCs, from the endoplasmic reticulum (Caulfield, 1993; Castellano et al., 1993). The C2 domain of PKC α mediates its translocation from the cytoplasm to the plasma membrane in response to increasing cytoplasmic Ca2+ (Evans et al., 2006).
PMA caused translocation of PKC βII and ε to the membrane as shown by Western blotting and densitometry (see Fig.1A and C). The translocation of PKC βII, a cPKC isozyme, in response to PMA was surprising since release of [Ca2+]ί is not involved in the action of PMA. However, PKC βII is less calcium-dependent than is PKC α (Corbalan-Garcia et al., 2006), so the constitutive Ca2+ present in the oocyte cytoplasm may have been sufficient for the activation of PKC βII by PMA. The involvement of PKC βII in response to PMA was further supported by the inhibition of its effect with the PKC βII translocation inhibitor βIIV5.3, the PKC βII inhibitor CG533 53 or PKC βII siRNA (see Fig. 4 and Fig. 5). Similarly, the involvement of PKC ε was supported by inhibition of the PMA-potentiated currents with the PKC ε peptide inhibitor εV1.2 and with PKC ε siRNA (Fig. 6). The observed inhibition of MCh- or PMA-stimulated current could be caused by an increase in the basal current or a decrease in the stimulated current. Depletion of PKC α with siRNA did not affect the basal current (see Fig. 7), only the MCh-stimulated current was decreased (see Fig. 3) strongly implicating PKC α in the MCh stimulation. Similarly, depletion of PKC βII with siRNA did not affect the basal current but did decrease the PMA-stimulated current, implicating PKC βII in the effect of PMA. In contrast, siRNA for PKC ε or βI caused an increase in the basal current. It is possible that the Cav 2.3 channel subunits are under negative control by these PKC isozymes and hence their depletion led to the increased basal currents. It may be recalled here that Ser-425 of the Cav α1 2.2 subunit acts as an inhibitory PKC site (Fang et al., 2006) and its homologue, Ser-369 in the Cav α1 2.3 subunit appears to act in a similar fashion (unpublished observation). It is possible that these sites are partially phosphorylated by PKC βI and ε that are active under basal conditions.
We hypothesized that there may be MCh- and PMA-selective Ser/Thr PKC phosphorylation sites in the α1 2.3 subunit of Cav 2.3 channels (Kamatchi et al., 2004). Mutational analysis revealed that Ala substitution of Ser-888, Ser-892 and Ser-894 or Ser-892 (of II-III linker) and Ser-1987 (of C terminus) in the α 1 2.3 subunit inhibited MCh-induced potentiation of Cav 2.3 currents (Kamatchi et al., 2004). Hence, these sites are designated as MCh-selective sites and it is possible that PKC α activated by MCh preferentially acts on these sites. However, Ala substitution of another set of Ser/Thr sites, (Thr-365 and Ser-369 of I-II linker and Ser-1995 of C terminus, the PMA-selective sites) also inhibited MCh-induced potentiation of Cav 2.3 currents to the same extent as PMA-induced potentiation. Hence, we referred to Thr-365, Ser-369 and Ser-1995 as MCh and PMA sites (Fang et al., 2005). However, sites homologous to Thr-365, Ser-369 and Ser-1995 are present in the α1 2.2 subunit (Thr-422, Ser-425 and Ser-2108) and Cav 2.2 currents were potentiated only by PMA (Kamatchi et al., 2004; Fang et al., 2005). Thus, the question arises as to why MCh doesn’t act on the Cav 2.2 currents.
Several interpretations are compatible with these results. The fact that different sets of mutations involving I-II linker, II-III linker and C-terminal sites of α1 2.3 subunit could abolish Cav 2.3 responses to MCh (Kamatchi et al., 2004; Fang et al., 2005) suggests that several of these potential phosphorylation sites are necessary but not sufficient. The implication of PKC α in phosphorylation of the unique α1 2.3 subunit sites in the II-III linker and C-terminus suggests that PKC α may be necessary, but not sufficient for the MCh effect. The fact that the sites in the I-II linker and C-terminus are implicated in the action of PMA and MCh suggests either that both agonists stimulate some other PKC isozymes in common or that different isozymes can phosphorylate some of the same sites.
It is possible that MCh, like PMA, activates PKC βII and/or PKC ε but that their translocation is transient after activation by a natural DAG analog generated in response to MCh or that their activation occurs later and thus was not observed in our short translocation experiments. More time may be required after MCh-receptor interaction to generate the DAGs that activate these isozymes; and DAGs are rapidly metabolized by most cells whereas phorbol esters have much longer half-lives and generally are more potent. The faster generation of DAGs from phosphatidylinositol hydrolysis vs. phosphatidylcholine hydrolysis (Nishizuka, 1995) may predispose to activation of cPKCs instead of nPKCs. Evidence from other studies suggests that the more rapid kinetics of cPKC translocation is determined by the calcium transients (Oancea, 1998; Lenz et al., 2002; Gallegos et al., 2006).
In summary, although phosphorylation at specific PKC sites in the I-II linker and C-terminus would seem to be sufficient for activation of Cav 2.2 channels, in the Cav 2.3 channels, these sites may be necessary but not sufficient. Evidence presented here suggests that the PKC βII and PKC ε isozymes may be involved in I-II linker phosphorylation events when cells are stimulated by PMA. Activation of the Cav 2.3 channels by MCh additionally requires unique sites in the II–III linker and one in the C-terminus (Kamatchi et al., 2004; Fang et al., 2005). The evidence that PKC α is required for the MCh but not the PMA effect suggests that PKC α may effect phosphorylation at the II–III linker sites. PKC isozyme-selectivity may allow for the inclusion of different ion channels in responses to different agonists; and the possibility is raised that selective PKC isozyme inhibitors may be able to modify the action of specific members of the calcium channel family because of different isozyme-selective target sites on the channels.
4. Experimental procedures
4.1. Harvesting of Oocytes and cDNA Injection
Mature female Xenopus laevis frogs were obtained from Xenopus I (Fort Atkinson, WI), housed in an established frog colony, and fed regular frog brittle on alternate days. For the removal of oocytes, a frog was anesthetized in 500 ml of 0.2% 3-aminobenzoic acid ethyl ester (Sigma, St Louis, MO, USA) in water until unresponsive to a painful stimulus. The anesthetized frog was placed supine on ice, and an incision of ~ 1.5 cm in length was made through both the skin and muscle layers of one lower abdominal quadrant. A section of the ovary was exteriorized, and a lobule of oocytes (~ 500) was removed. The wound was closed in two layers, and the animal was allowed to recover from anesthesia, kept in a separate tank overnight, and returned to the colony the following day. The oocytes were washed twice in a calcium free OR2 solution (in mM: NaCl 82.5, KCl 2, MgCl2 1.8, HEPES 5, pH 7.5) and transferred to OR2 solution containing 1 mg/ml collagenase (type 1A; Sigma). The dish containing the oocytes in collagenase solution was agitated for a period of 2–3 hrs at room temperature to remove the follicular cell layer. Defolliculation was confirmed by microscopic examination. The oocytes were washed in OR2 solution and transferred to modified Barth’s solution (in mM: NaCl 88, KCl 1, NaHCO3 2.4, CaCl2 0.41, MgSO4 0.82, HEPES 15, pH 7.4) containing 2.5 mM sodium pyruvate and 10 µg/ml gentamycin sulfate. The oocytes were allowed to recover by incubation at 16°C for 3–10 h before cDNA injection. Nuclear (germinal vesicle) injection was performed (Drummond “Nanoject,” Drummond Scientific Co., Broomall, PA) using a maximum of 4 ng of cDNA containing 3 ng of a 1:1:1 mix (molar ratio) of Cav α1 2.3, β1b, α2δ cDNA (in pMT2 vector) subunits and 1 ng of rat M1 receptor cDNA in pcDNA 3.1 (Invitrogen, Carlsbad, CA, USA). The oocytes were returned to Barth’s solution and incubated at 16°C for 6–8 days before the recording of current.
4.2. Current Recording
Macroscopic currents with Ba2+ (IBa) as the charge carrier were recorded using a two-electrode voltage clamp technique using Oocyte Clamp OC-725C (Warner Instrument Corp., Hamden, CT, USA). The amplifier was linked to an interface and an IBM PC-compatible computer equipped with pClamp software (version 8.2; Axon Instruments, Foster City, CA, USA) for data acquisition and analysis. Leak currents were subtracted using the P/4 procedure. Microelectrodes with an agarose cushion were filled with 3 M CsCl; typical resistances were 0.5–2.5 megohms. KCl-agar bridges were used as ground electrodes to minimize any junction potential attributable to changes in ionic composition of the bath solution. The oocytes were placed in a recording chamber (~ 500 µl volume) and superfused with the recording solution containing (in mM): Ba(OH)2 40, NaOH 50, KOH 2, HEPES 5, using methanosulfonate as the anion to adjust the pH to 7.4. Niflumic acid (0.4 mM) was included to block intrinsic chloride channels. Oocytes were held at −80 mV before being depolarized to 0 mV, the test potential for the duration of 850 ms.
4.3. Drug Treatment
All of the oocytes exhibiting IBa greater than 400 nA underwent control, treatment, and wash protocols. The control IBa was recorded at 8 min after the oocyte was impaled. Following the recording of the control IBa, either PMA or MCh was perfused for 60 s, and the current was recorded after another 60 s, thus exposing the oocyte to the agonist for a period of 2 min.
4.4. Chemicals
PMA (Calbiochem, San Diego, CA, USA) and MCh (Sigma, St Louis, MO, USA) were dissolved in Me2SO (0.05%) and distilled water, respectively. The concentrated stock solutions of MCh and PMA were stored frozen at −20°C and diluted to their final concentration in recording solution on the day of the experiment. To block endogenous Cl− currents, niflumic acid (Sigma, St Louis, MO, USA) was added to the recording solution, which was stirred overnight in order for it to dissolve. PKC peptide inhibitors were obtained from Dr. Mochly-Rosen (Standford University, Standford, CA, USA). CG533 53 and Go 6976 (EMD Chemicals Inc., Darmstadt, Germany) were dissolved in 0.001% DMSO.
4.5. Data Analysis
The IBa represented the maximum amplitude of the inward current. The data are shown as means ± S.E. unless otherwise indicated.
4.6. Measurement of translocation of the isozymes from the soluble to the particulate fraction
We followed the method of Leno and Laskey (Leno and Laskey, 1991) to separate the membrane and the cytosol fraction of the oocytes. Briefly, forty oocytes were washed two times in ice-cold extraction buffer (in 0.01 M HEPES pH 7.8, 0.1 mM EDTA, 0.1 M KCl, 1.0 mM MgCl2, 10 % glycerol and 0.2 mM DTT, containing 1.0 mM phenylmethylsulfonyl fluoride, 50 µg/ml leupeptin, and 20 µg/ml soybean trypsin inhibitor) and the excess homogenization buffer was removed. Fresh homogenization buffer was added at a volume of 5 µl/oocyte. The oocyets were homogenized and the homogenate was centrifuged in a refrigerated Biofuge (10,000 × g) for 20 minutes to separate the homogenate into three layers (yolk at the bottom, middle layer of cytosol and membrane and lipid at the top). The middle layer was transferred to a separate tube discarding the lipid and the yolk. The middle layer was centrifuged again at the maximum RPM to separate the membrane fraction, the pellet and the cytosol, the supernatant. The pellet was resuspended with the ice-cold extraction buffer following the removal of the cytosol fraction.
The fractions (membrane and cytosol) were diluted with 2 × SDS-PAGE sample buffer and denatured for 5 min at 90°C. The denatured fractions were electrophoresed on an SDS-12% polyacrylamide gel using 20 µl (equivalent to 4 oocytes) each of cytosol and membrane fractions. After electrophoresis, separated proteins were transferred onto a nitrocellulose membrane by electro blotting. Molecular weights were determined by using Biorad colored molecular weight protein markers (Biorad, Hercules, CA, USA).
The membrane was rinsed in distilled water and blocked with 5% Blotto [5% Nonfat dried milk in Tris buffered saline, pH 7.4, with 0.1% Tween 20 (TBS-T)] for 1 h at room temperature. The blots were incubated with primary antibodies in sealable pouches. We used rabbit polyclonal antibodies (Santa Cruz Biotechnology, Santa Cruz, CA), diluted in 5% Blotto (1:2500) for 2 h at room temperature on a shaking platform for specific PKC isozymes. After the incubation with primary antibody, the blot was washed four times in TBS-T for 7.5 min each. Blots were then incubated with the secondary antibody for 1 h on a shaking platform. We used a 1:10,000 dilution of goat anti rabbit IgG conjugated with horseradish peroxidase (Santa Cruz Biotechnology, Santa Cruz, CA) and diluted in 5% Blotto. Finally, the blot was washed four times in TBS-T for 7.5 min each. Immunolabeled proteins were detected by the ECL Plus enhanced chemiluminescence detection system (Amersham Life Science Buckinghamshire, UK). X-ray films were scanned and analyzed with a model-GS700 scanning densitometer and Molecular Analyst software (Bio-Rad, Hercules, CA, USA).
4.7. Preparation of small interfering RNA
We designed the siRNA templates targeting the mRNA sequence of either Xenopus (α and βII) or mouse (βI, ε and γ) PKC isozyme sequence following the method of Silencer siRNA construction kit from Ambion (Applied Biosystems, Foster city, CA). The sequences of each siRNA pair (antisense and sense respectively) were as follows; PKC α: 5′-CAG CCC AAC ATT TCC TGT CTC-3′ and 5′-TGG GCT GCC ATA GCC TGT CTC-3′; scrambled PKC α: 5′-ATC AGC ACC ATA CCC TGT CTC-3′ and 5′-ACG ACT AGG CTT TCC TGT CTC-3′; PKC βI: 5′-CCC ACT GAC AAA CCC TGT CTC-3′ and 5′-CAG TGG GAG TCA GCC TGT CTC-3′; PKC βII: GAA CTT CGA CAA GCC TGT CTC-3′ and 5′-GAA GTT CTC AGC ACC TGT CTC-3′; scrambled PKC βII: 5′-ACT ACA TCA GTA GCC TGT CTC-3′ and 5′-ATG TAG TCT CAC GCC TGT CTC-3′; PKC γ: 5′-GCA GTC ACT GTA CCC TGT CTC-3′ and 5′-TGA CTG CAG AAG GCC TGT CTC-3′; PKC ε: 5′-GCT GGC TGT CTT TCC TGT CTC-3′ and 5′-AGC CAG CTC GAT CCC TGT CTC-3′; scrambled PKC ε: 5′-TAG GTT GTT CTG CCC TGT CTC-3′ and 5′-GTT GGA TCG GTA CCC TGT CTC-3′. The double-stranded siRNA template oligonucleotides were synthesized using the reagents from the Ambion kit mentioned above. The siRNAs were stored at −20°C in aliquots (final concentration of 100 µM) and a volume of 27.6 nl was injected into the cytoplasm of the oocytes the day prior to their testing.
The modulating drugs, Go 6976 (10 µM) or CG533 53 (20 µM) and peptide inhibitors of translocation (βIIV5.3 and εV1.2, 10 µM each) were microinjected into the oocytes in a volume of 27.6 nl and the oocytes were tested 3 hrs after their injection.
Results are expressed as means ± SEM. Differences between groups were examined with the student’s t-test and a ‘p’ value of less than 0.05 was taken as significant.
Acknowledgements
This work was supported by National Institutes of Health Grant GM65214 (to G.L.K) and GM31184 (to J.J.S) and by the Department of Anesthesiology at the University of Virginia. We thank Dr.T.P. Snucth (University of British Columbia, Vancouver, British Columbia, Canada) for the clones of calcium channels and Dr. T. I. Bonner (Laboratory of Cell Biology, National Institute of Mental Health, Bethesda, MD) for the muscarinic M1 receptor clone. We thank Dr. Eva M.Dehlin for her contribution during the initial stages of western blot investigation.
Abbreviations
- PKC
protein kinase C
- DAG
diacyl glycerol
- PMA
phorbol-12-myristate, 13-acetate
- MCh
acetyl-β-methylcholine
Footnotes
Publisher's Disclaimer: This is a PDF file of an unedited manuscript that has been accepted for publication. As a service to our customers we are providing this early version of the manuscript. The manuscript will undergo copyediting, typesetting, and review of the resulting proof before it is published in its final citable form. Please note that during the production process errors may be discovered which could affect the content, and all legal disclaimers that apply to the journal pertain.
REFERENCES
- Benussi L, Govoni S, Gasparini L, Binetti G, Trabucchi M, Bianchetti A, Racchi M. Specific role for protein kinase C α in the constitutive and regulated secretion of amyloid precursor protein in human skin fibroblasts. Neurosci. Lett. 1998;240:97–101. doi: 10.1016/s0304-3940(97)00894-x. [DOI] [PubMed] [Google Scholar]
- Castellano A, Wei X, Birnbaumer L, Perez-Reyes E. Cloning and expression of a third calcium channel β subunit. J. Biol. Chem. 1993;268:3450–3455. [PubMed] [Google Scholar]
- Caulfield M. Muscarinic receptors-characterization, coupling and function. Pharmacol. Ther. 1993;58:319–379. doi: 10.1016/0163-7258(93)90027-b. [DOI] [PubMed] [Google Scholar]
- Chalfant CE, Ohno S, Konno Y, Fisher A, Bisnauth L, Watson J, Cooper DR. A carboxy-terminal deletion mutant of protein kinase C βII inhibits insulin-stimulated 2-deoxyglucose uptake in L6 rat skeletal muscle cells. Mole. Endocrinol. 1996;10:1273–1281. doi: 10.1210/mend.10.10.9121494. [DOI] [PubMed] [Google Scholar]
- Corbalan-Garcia S, Gomez-Fernandez J. Protein kinase C regulatory domains: the art of decoding many different signals in membranes. Biochim. Biophys. Acta. 2006;1761:633–654. doi: 10.1016/j.bbalip.2006.04.015. [DOI] [PubMed] [Google Scholar]
- Dascal N. The use of Xenopus oocytes for the study of ion channels. Crit. Rev. Biochem. Mole. Biol. 1987;22:317–387. doi: 10.3109/10409238709086960. [DOI] [PubMed] [Google Scholar]
- Dolphin A. A short history of voltage-gated calcium channels. Br. J. Pharmacol. 2006;147:S56–S62. doi: 10.1038/sj.bjp.0706442. [DOI] [PMC free article] [PubMed] [Google Scholar]
- Elmslie K. Neurotransmitter modulation of neuronal calcium channels. J. Bioenerg. Biomem. 2003;35:477–489. doi: 10.1023/b:jobb.0000008021.55853.18. [DOI] [PubMed] [Google Scholar]
- Ertel E, Campbell K, Harpold M, Hofmann F, Mori Y, Perez-Reyes E, Schwartz A, Snutch TP, Tanabe T, Birnbaumer L, Tsien RW, Catterall WA. Nomenclature of voltage-gated calcium channels. Neuron. 2000;25:533–535. doi: 10.1016/s0896-6273(00)81057-0. [DOI] [PubMed] [Google Scholar]
- Evans J, Murray D, Leslie C, Falke J. Specific translocation of protein kinase C α to the plasma membrane requires both Ca2+ and PIP2 recognition by its C2 domain. Mole. Biol. Cell. 2006;17:56–66. doi: 10.1091/mbc.E05-06-0499. [DOI] [PMC free article] [PubMed] [Google Scholar]
- Fang H, Franke R, Patanavanich S, Lalvani A, Powell N, Sando J, Kamatchi G. Role of α1 2.3 subunit I-II linker sites in the enhancement of Cav 2.3 currents by phorbol 13-myristate 13-acetate. J. Biol. Chem. 2005;280:23559–23565. doi: 10.1074/jbc.M501540200. [DOI] [PubMed] [Google Scholar]
- Fang H, Patanavanich S, Rajagopal S, Yi X, Gill M, Sando J, Kamatchi G. Inhibitory role of Ser-425 of the alpha 1 2.2 subunit in the enhancement of Cav 2.2 currents by phorbol-12-myristate, 13-acetate. J. Biol. Chem. 2006;281:20011–20017. doi: 10.1074/jbc.M601776200. [DOI] [PubMed] [Google Scholar]
- Gallegos L, Kunkel M, Newton A. Targeting protein kinase C activity reporter to discrete intracellular regions reveals spatiotemporal differences in agonist-dependent signaling. J. Biol. Chem. 2006;281:30947–30956. doi: 10.1074/jbc.M603741200. [DOI] [PubMed] [Google Scholar]
- Hamid J, Nelson D, Spaetgens R, Dubel S, Snutch T, Zamponi G. Identification of an interaction center for cross-talk between protein kinase C and G protein modulation of N-type calcium channels. J. Biol. Chem. 1999;274:6195–6202. doi: 10.1074/jbc.274.10.6195. [DOI] [PubMed] [Google Scholar]
- Johnson J, Capco D. Progesterone acts through protein kinase C to remodel the cytoplasm as the amphibian oocyte becomes the fertilization-competent egg. Mech. Dev. 1997;67:215–226. doi: 10.1016/s0925-4773(97)00122-6. [DOI] [PubMed] [Google Scholar]
- Kamatchi G, Franke R, Lynch C, III, Sando J. Identification of Sites Responsible for Potentiation of Type 2.3 Calcium Currents by Acetyl-β-methylcholine. J. Biol. Chem. 2004;279:4102–4109. doi: 10.1074/jbc.M308606200. [DOI] [PubMed] [Google Scholar]
- Kamatchi G, Tiwari S, Chan C, Chen D, Do S-H, Durieux M, Lynch Carl., III Distinct regulation of expressed calcium channel 2.3 in Xenopus oocytes by direct or indirect activation of protein kinase C. Brain. Res. 2003;968:227–237. doi: 10.1016/s0006-8993(03)02245-5. [DOI] [PubMed] [Google Scholar]
- Leno G, Laskey R. DNA replication in cell-free extracts from Xenopus laevis. Met. Cell. Biol. 1991;36:561–579. doi: 10.1016/s0091-679x(08)60297-6. [DOI] [PubMed] [Google Scholar]
- Lenz J, Reusch P, Albrecht N, Schultz G, Schaefer M. Ca2+ controlled competitive diacylglycerol binding of protein kinase C isoenzymes in living cells. J. Cell. Biol. 2002;159:291–301. doi: 10.1083/jcb.200203048. [DOI] [PMC free article] [PubMed] [Google Scholar]
- McHugh D, Sharp E, Scheuer T, Catterall W. Inhibition of cardiac L-type calcium channels by protein kinase C phosphorylation of two sites in the N-terminal domain. Proc. Natl. Acad. Sci. USA. 2000;97:12334–12338. doi: 10.1073/pnas.210384297. [DOI] [PMC free article] [PubMed] [Google Scholar]
- Melliti K, Meza U, Adams B. Muscarinic stimulation of α1E Ca channels is selectively blocked by the effector antagonist function of RGS2 and phospholipase C-β1. J. Neurosci. 2000;20:7167–7173. doi: 10.1523/JNEUROSCI.20-19-07167.2000. [DOI] [PMC free article] [PubMed] [Google Scholar]
- Nishizuka Y. Protein kinase C and lipid signaling for sustained cellular responses. FASEB. J. 1995;9:484–496. [PubMed] [Google Scholar]
- Nishizuka Y. The heterogeneity and differential expression of multiple species of the protein kinase C family. Biofactors. 1988;1:17–20. [PubMed] [Google Scholar]
- Oancea ETM. Protein kinase C as a molecular machine for decoding calcium and diacylglycerol signals. Cell. 1998;95:307–318. doi: 10.1016/s0092-8674(00)81763-8. [DOI] [PubMed] [Google Scholar]
- Pemberton KE, Jones SVP. Inhibition of the L-type calcium channel by the five muscarinic receptors (m1–m5) expressed in NIH 3T3 cells. Pflügers. Arch. 1997;433:505–514. doi: 10.1007/s004240050306. [DOI] [PubMed] [Google Scholar]
- Rane SG, Dunlap K. Protein Kinase C activator 1,2-oleoylacetylglycerol attenuates voltage-dependent calcium current in sensory neurons. Proc. Natl. Acad. Sci. USA. 1986;83:184–188. doi: 10.1073/pnas.83.1.184. [DOI] [PMC free article] [PubMed] [Google Scholar]
- Snutch TP. The use of Xenopus oocytes to probe synaptic communication. Trends. Neurosci. 1988;11:250–256. doi: 10.1016/0166-2236(88)90102-6. [DOI] [PubMed] [Google Scholar]
- Stea A, Soong TW, Snutch TP. Ligand-and Voltage-gated ion channels. Boca Raton, FL: CRC press, Inc.; 1995. pp. 113–151. [Google Scholar]
- Stith B, Woronoff K, Espinoza R, Smart T. sn-1,2-Diacylglycerol and choline increase after fertilization in Xenopus oocytes. Mole. Biol. 1997;8:755–765. doi: 10.1091/mbc.8.4.755. [DOI] [PMC free article] [PubMed] [Google Scholar]
- Stumpo D, Haupt D, Blackshear P. Protein kinase C isozyme distribution and down-regulation in relation to insulin-stimulated c-fos induction. J. Biol. Chem. 1994;269:21184–21190. [PubMed] [Google Scholar]
- Swartz KJ. Modulation of Ca2+ channels by protein kinase C in rat central and peripheral neurons: disruption of G protein-mediated inhibition. Neuron. 1993;11:305–320. doi: 10.1016/0896-6273(93)90186-u. [DOI] [PubMed] [Google Scholar]
- Vijayaragavan K, Boutjdir M, Chahine M. Modulation of Nav1.7 and Nav1.8 peripheral nerve sodium channels by protein kinase A and protein kinase C. J. Neurophysiol. 2004;91:1556–1569. doi: 10.1152/jn.00676.2003. [DOI] [PubMed] [Google Scholar]
- Walker D, De Waard M. Subunit interaction sites in voltage-dependent Ca2+ channels: role in channel function. Trends. Neurosci. 1998;21:148–154. doi: 10.1016/s0166-2236(97)01200-9. [DOI] [PubMed] [Google Scholar]
- Wetsel W, Khan W, Merchenthaler I, Rivera H, Halpern A, Phung H, Negra-vilar A, Hannun YA. Tissue and cellular distribution of the extended family of protein kinase C isozymes. J. Cell. Biol. 1992;117:121–133. doi: 10.1083/jcb.117.1.121. [DOI] [PMC free article] [PubMed] [Google Scholar]
- Yang J, Tsien RW. Enhancement of N- and L-type calcium currents by protein kinase C in frog sympathetic neurons. Neuron. 1993;10:127–136. doi: 10.1016/0896-6273(93)90305-b. [DOI] [PubMed] [Google Scholar]
- Zuhlke R, Reuter H. Ca2+-sensitive inactivation of L-type Ca2+ channels depends on multiple cytoplasmic amino acid sequences of the α1C subunit. Proc. Natl. Acad. Sci. USA. 1998;95:3287–3294. doi: 10.1073/pnas.95.6.3287. [DOI] [PMC free article] [PubMed] [Google Scholar]