Abstract
A reduction in cold ischemia time (CIT) can be associated with better renal allograft outcomes. However few published surveys of CIT of deceased donor kidneys transplanted in the U.S. are available. We therefore surveyed the CIT using the United Network for Organ Sharing data of the last decade. A reduction in CIT was observed during the 10-yr period with an overall reduction of 4.8 hr (n = 75,072; mean ± SD, 24.4 ± 10.9 hr in 1990 vs. 19.6 ± 8.4 hr in 2000, P < 0.001) with fewer kidneys being cold stored over 30 hr in the second half (13% in 1996–2000 vs. 25% in 1990–1995, P < 0.001). Although the overall rates of delayed graft function were not different between the two periods (24% in 1990–1995 vs. 25% in 1996–2000), possibly be due to increase in the use of ECD and DCD kidneys and the persistence of CIT over 20 hr in the second half, the 6-month post-transplant graft function (serum creatinine: 1.63 ± 0.01 mg/dL in 1996–2000 vs. 1.75 ± 0.01 mg/dL in 1990–1995; P < 0.001) and the 3-yr graft survival (80% in 1996–2000 vs. 72% in 1990–1995; P < 0.001) were better. Thus, our analysis demonstrates an overall reduction in mean CIT over the last decade mainly due to fewer kidneys being cold stored over 30 hr in the latter half. This raises the possibility that besides the influence of improved immunosuppression, reduction in CIT might have also contributed to the recently observed improvements in graft function and survival.
Keywords: Cold ischemia time, cold storage, cold preservation, renal allograft survival, delayed graft function, deceased donor kidneys, acute renal failure, ischemia reperfusion, UNOS
Introduction
Cold preservation of kidneys continues to play a critical role in the success of deceased-donor kidney transplantation. However, prolonged cold storage can lead to severe injury causing delayed graft function (DGF) and higher graft loss (1–3). With the increasing utilization of extended criteria donors (ECD) and donors after cardiac death (DCD), attempts are made to avoid prolonged CIT. Few published studies have however, surveyed the extent of CIT. In this analysis the extent of CIT reduction in deceased-donor kidney transplants in the U.S. over the last decade was determined. Attempts were also made to assess the effect of CIT reduction on post-transplant outcomes.
Methods
Using UNOS data of October 15, 2004 and applying the criteria, organ = kidney, donor type = cadaver, and transplant date = January 01, 1990 to December 31, 2000, we identified 83,987 deceased-donor kidney transplant recipients in the registry. The CIT was missing in 8,915 (10.6%). The data of remaining 75,072 recipients and donors formed the basis for this analysis. The data of those with and without CIT were comparable for key graft survival-related variables. The criteria we used to define DGF (i.e., the recipients’ need for dialysis during the first week of transplantation) and identify ECD and DCD kidneys in the database were standard(4). The graft survival rates were determined by Cox proportional hazard models. The CIT was used as continuous and categorical variable. For the latter, CIT was banded at 10 hr interval (5). The 6-month post-transplantation serum creatinine values were plotted against CIT. The covariates differences were determined by the analysis of variance (ANOVA) and chi-square methods. For Cox multivariate analysis, all covariates were assessed for proportional hazard assumption and the variables were simultaneously introduced using the single-step method. A P-value < 0.05 was considered statistically significant. All statistical analyses were carried out using the Statistical Package for Social Sciences (SPSS) computer program, version 12.0.
Results
The recipient characteristics provided in Table 1 include details for the 1st and 2nd halves of 1990–2000 and the values are presented under CIT categories. The donor and recipient age and the percentages of ECD and DCD kidneys were significantly higher in 1996–2000 than in 1990–1995. The rate of HLA mismatch and percentage of recipients with a peak PRA of >30% were not different. However, the wait-to-transplant time and the percentage of kidneys transported more than 500 miles were significantly higher in 1996–2000 than in 1990–1995. Moreover, CIT correlated positively with the transport-distance of the kidneys (r = 0.26, P < 0.001). The pump-usage to preserve kidneys did not differ between the two periods (14% vs. 15%). The percentages of ECD kidneys were distributed equally across the CIT categories in 1990–1995 and 1996–2000. However, we found a significantly higher percentage of DCD kidneys in the > 30-hr CIT category than in the rest. The pump-usage, percentage of head trauma cases, and donor age did not differ among the CIT periods.
Table 1.
The details on donors, recipients and kidneys grouped by CIT categories.
| Transplant periods | 1990–1995 | 1996–2000 | ||||||||
|---|---|---|---|---|---|---|---|---|---|---|
| CIT groups | <10 hr | 10–20 hr | 20–30 hr | >30 hr | combined | <10 hr | 10–20 hr | 20–30 hr | >30 hr | combined |
| Recipients numbers | 3638 | 15,288 | 14,797 | 9433 | 43,156 | 3286 | 13,896 | 11,146 | 3547 | 31,875 |
| Recipient age (yr) | 42 ± 14 | 42 ± 14 | 43 ± 14 | 43 ± 14 | 43 ± 14 | 45 ± 15 | 46 ± 14 | 45 ± 14 | 47 ± 13 | 46 ± 14** |
| Wait for transplant (yr) | 1.1 ±1.0 | 1.2 ± 1.1 | 1.3 ± 1.2 | 1.2 ± 1.1 | 1.2 ±1.2 | 1.7 ± 1.5 | 1.7 ± 1.5 | 1.8 ± 1.6 | 1.7 ± 1.6 | 1.7 ± 1.6** |
| Retransplant (%) | 13 | 15 | 16 | 17 | 16 | 10 | 13 | 14 | 13 | 13** |
| Peak PRA >30% (%) | 15 | 16 | 19 | 19 | 18 | 15 | 16 | 18 | 17 | 17 |
| HLA mismatch | 3.5 ± 1.4 | 3.4 ±1.5 | 3.2 ± 1.6* | 3.4 ± 1.6 | 3.3 ± 1.6 | 3.8 ± 1.5 | 3.3 ± 1.7 | 2.9 ± 1.9* | 3.3 ± 1.7 | 3.2 ± 1.8 |
| Donor age (yr) | 31 ± 16 | 32 ± 16 | 33 ± 17 | 33 ± 18 | 33 ± 17 | 35 ± 17 | 34 ± 17 | 36 ± 18 | 37 ± 18 | 36 ± 17** |
| ECD | 12 | 13 | 12 | 12 | 12 | 17 | 18 | 18 | 19 | 18** |
| DCD | 0.2 | 0.4 | 0.7 | 0.8* | 0.6 | 1 | 1.2 | 1.9 | 2.6* | 1.6** |
| DGF (%) | 18 | 21 | 26 | 35* | 24 | 18 | 22 | 26 | 36* | 25 |
P <0.05 compared to all other CIT groups within the specific transplant period.
P <0.05 compared to the “combined” value in 1990–1995, i.e., comparison between the combined value of 1990–1995 and of 1996–2000; mean ± SD.
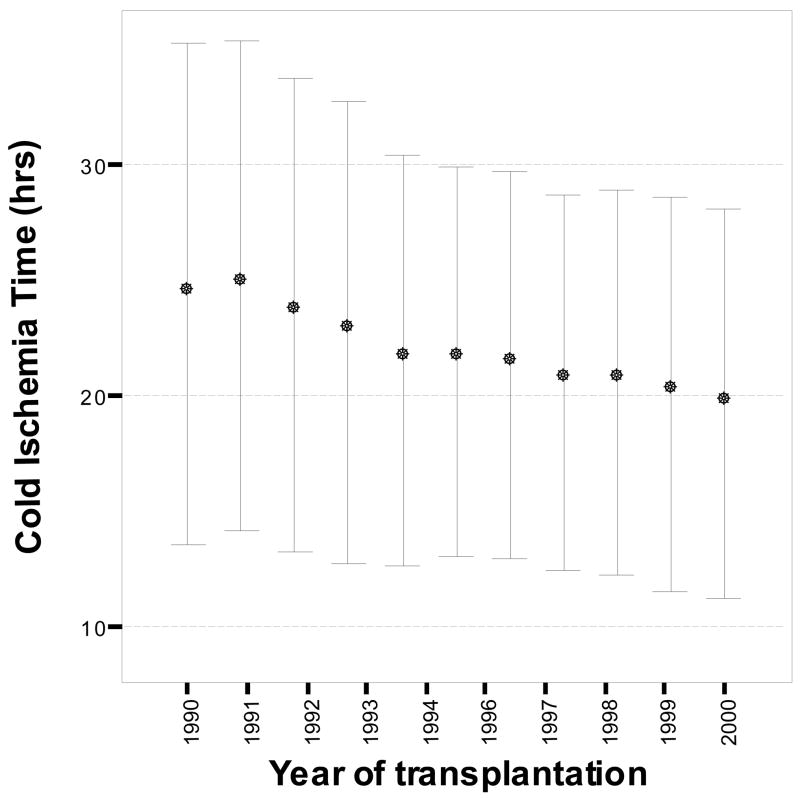
We found a reduction in CIT up to 4.8 hr during the 10-yr period (24.4 ± 10.9 hr in 1990 vs. 19.6 ± 8.4 hr in 2000, P < 0.001) resulting in significant negative correlation between CIT and the year of transplantation (Fig. 1, n=75,072; r=−0.17, p < 0.001). The mean CIT for the 10-yr period was 21.5 ± 9.6 hr; the same for 1990–1995 was 23 ± 10 hr and for 1996–2000 was 20 ± 8 hr. The difference was mostly due to fewer kidneys being cold stored for over 30 hr in 1996–2000 than in 1990–1995 (13% vs. 25%, P < 0.001). A 47.5% of kidneys were still cold stored for over 20 hr in 1996–2000.
Figure 1.
The CIT of deceased donor kidneys (n = 75,072) in hours (mean ± SD) plotted against year of transplantation (1990–2000). A negative correlation was found between the two measures (r=−0.17, p < 0.001).
Significantly different types of immunosuppressive drugs were used in 1990–1995 and 1996–2000. For induction therapy, interleukin–2 receptor antagonists OKT3 and polyclonal antilymphocyte antibodies were prescribed for 0%, 17% and 20% of recipients respectively in 1990–1995 and 8%, 15% and 14% respectively in 1996–2000. However, the use of these agents within each period did not differ among CIT categories. For maintenance therapy, mycophenolate was used in 3% of recipients in 1990–1995 and 67% in 1996–2000. Tacrolimus was used in 4% in 1990–1995 and 24% of recipients in 1996–2000. The use of cyclosporine decreased (77% in 1996–2000 vs. 94% in 1990–1995). The rate of rejection-treatment in the first 6 months after transplantation was 28% in 1996–2000, down from 41% in 1990–1995 (P < 0.001). The rejection rates did not differ significantly by CIT.
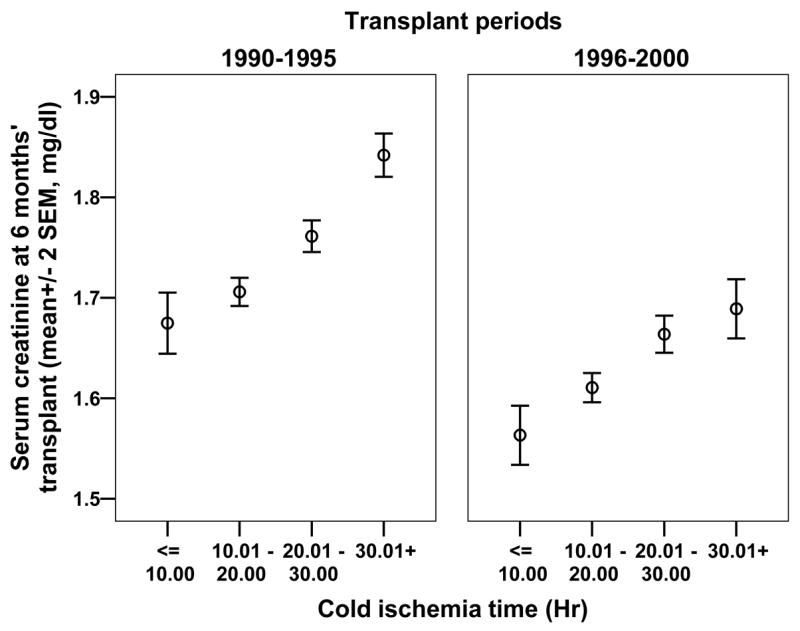
The percentage of DGF increased with longer CIT in both periods but the overall DGF rates were not differ: 24% in 1990–1995 and 25% in 1996–2000. The 6 month serum creatinine levels correlated positively with CIT in both periods (r = 0.21, P < 0.001 in 1990–1995) and (r = 0.18, P < 0.001 in 1996–2000) periods (Fig. 2). However, the mean levels were lower for each CIT period in 1996–2000 vs. 1990–1995, with the overall mean serum creatinine level low at 1.63 ± 0.01 mg/dL in 1996–2000 vs. 1.75 ± 0.01 mg/dL in 1990–1995 (P < 0.001).
Figure 2.

The 6-month post-transplantation serum creatinine level (mg/dL) plotted against CIT for 1990–1995 and 1996–2000. The serum creatinine levels progressively increased with groups of CIT in 1990–1995 and 1996–2000. The mean values for the each CIT were lower in 1996–2000; the overall mean serum creatinine level was 1.63 ± 0.01 mg/dL in 1996–2000 and 1.75 ± 0.01 mg/dL in 1990–1995 (P < 0.001).
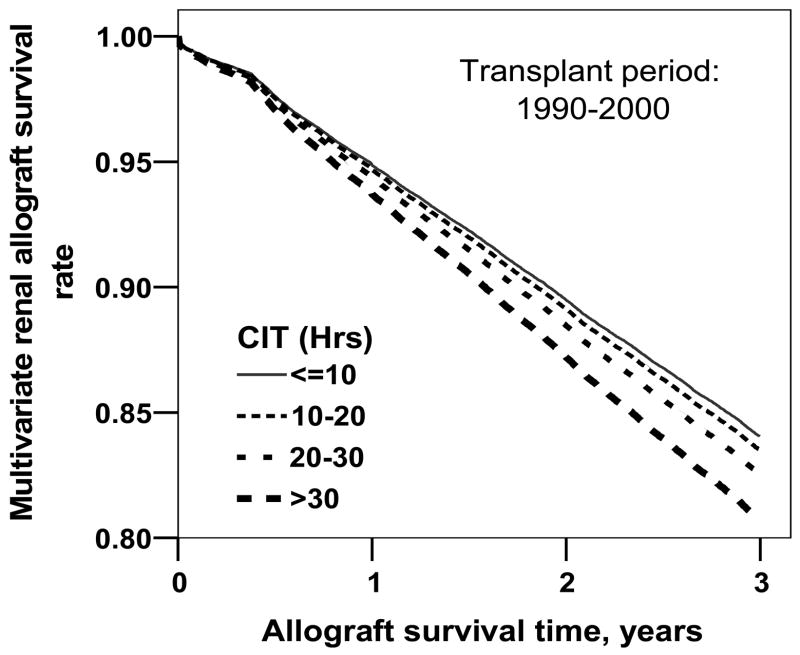
The 3-yr graft survival was better in 1996–2000 at 80% vs. 72% in 1990–1995; P < 0.001. When analysis was repeated stratified for CIT categories and after adjusting for several graft survival-related variables (donor and recipient age, donors’ cause of death, recipient ethnicity, PRA status, HLA mismatch, rejection in the first 6 months after transplantation, dialysis wait, diabetes status and previous transplantation) the 3-yr survival rates of kidneys transplanted during 1990–2000 were significantly lower for kidneys cold stored for more than 20 hr compared to kidneys stored for <10 hr (Fig. 3). A similar analysis but separate for the 1990–1995 and 1996–2000 data demonstrated a higher relative risk for graft failure for kidneys cold stored for more than 20 hr, significant only for the1996–2000 period. The full multivariate analyses data along with relative risks for graft failure for the two periods are presented in Table 2. Missing in this analysis is the adjustment for variation in immunosuppressive treatment between the two periods. The data on the treatment was missing in a large proportion of patients in the UNOS database making it inappropriate to adjust for it.
Figure 3.
The overall multivariate survival rates of renal allografts stratified for CIT and adjusted for donor and recipient age, donors’ cause of death, recipient ethnicity, PRA status, HLA mismatch, rejection in the first 6 months after transplantation, dialysis wait, diabetes status, and previous transplantation. Grafts stored for 20–30 hr and >30 hr had significantly higher rates of graft loss than grafts cold stored for < 10 hr (P < 0.015 for both).
Table 2.
Cox multivariate analysis: 3-yr relative risk for allograft failure
| 1990–1995 | 1996–2000 | |||||
|---|---|---|---|---|---|---|
| RR | 95% CI | P value | RR | 95% CI | P value | |
| Donor age (yr) | 1.008 | 1.006–1.009 | <0.001 | 1.002 | 1.000–1.004 | 0.029 |
| Recipient age (yr) | 1.004 | 1.002–1.005 | <0.001 | 1.011 | 1.010–1.013 | <0.001 |
| Recipient ethnicity (black vs. others) | 1.451 | 1.399–1.504 | <0.001 | 1.480 | 1.403–1.562 | <0.001 |
| Diabetes status (yes vs. no) | 1.308 | 1.258–1.360 | <0.001 | 1.328 | 1.252–1.408 | <0.001 |
| Previous transplantation (yes vs. no) | 1.244 | 1.184–1.306 | <0.001 | 1.188 | 1.097–1.286 | <0.001 |
| HLA mismatch | 1.035 | 1.024–1.047 | <0.001 | 1.039 | 1.024–1.054 | <0.001 |
| Peak PRA >30% | 1.083 | 1.035–1.133 | <0.001 | 1.152 | 1.076–1.234 | <0.001 |
| First 6-months’ rejection | 1.335 | 1.291–1.380 | <0.001 | 1.514 | 1.437–1.594 | <0.001 |
| Donor death (other causes vs. head trauma) | 1.044 | 1.002–1.087 | 0.039 | 1.085 | 1.022–1.151 | 0.007 |
| CIT | ||||||
| CIT 10 hr (reference) | 1 | - | - | 1 | - | - |
| 10–20 hr | 1.006 | 0.944–1.072 | 0.847 | 1.056 | 0.966–1.156 | 0.230 |
| 20–30 hr | 1.029 | 0.965–1.096 | 0.388 | 1.138 | 1.038–1.247 | 0.006 |
| >30 hr | 1.076 | 1.004–1.147 | 0.038 | 1.149 | 1.031–1.281 | 0.012 |
RR: Relative risk, CI: Confidence interval
Discussion
Our analysis demonstrates an overall reduction in mean CIT, with fewer kidneys being cold stored over 30 hr in the latter half. The UNOS has not instituted any policy or procedural changes to minimize CIT (personal communication with Ann Harper, Research/Policy Analyst, OPTN/UNOS Policy Oversight Committee) and the mechanism for the shortening of CIT is not evident from our analysis. It is possible that the transplant communities are mindful of avoiding prolonged CIT especially with the increasing use of ECD and DCD kidneys. Also, extraneous factors such as improved communication, better laboratory automation, faster transportation etc, i.e., better over all efficacy of the process of procuring, transporting and transplanting might be playing roles in reducing CIT.
Our findings also demonstrate a better 6-month graft function and 3-yr survival in the second half, but not the DGF. The increased use of ECD and DCD kidneys in the 1996–2000 along with nearly 50% of the kidneys still cold stored for over 20 hr in 1996–2000 might explain for the persistence of DGF. A recent study by the Eurotransplant Senior Program demonstrated that patients who had received deceased-donor kidneys without tissue matching to minimize CIT had excellent survival outcomes (6). We found that CIT was directly related to the distance the kidneys were transported; thus, using kidneys closer to the site of procurement, even with a less than optimal tissue match, may reduce the CIT with possible better outcomes. In spite of better over all graft outcomes in the second half, Table 2 shows that the adverse effect of CIT on grafts is more evident in the second half. One possible explanation is the loss of competing risk factors such as reduction in acute rejection, thus unmasking the effect of cold ischemic injury.
We recognize that our analysis has limitations, can be subjected to alternate methods and our results are essentially hypothesis generating. Moreover, while we have adjusted for several factors in our multivariate analysis, the variation in immunosuppression could not be adjusted due to large missing data. Large single center database that contains such information could be used to statistically tease out the effect of change in immunosuppression from reduction in CIT. Despite this limitation, our analysis provides the interesting observation that there is a significant reduction in the mean CIT over the last decade and that fewer kidneys are being cold stored over 30 hr. This raises the possibility that besides the influence of improved immunosuppression, lower CIT might also have also contributed to the recent improvements in graft function and survival.
Acknowledgments
This work was supported in part by U.S. Health Resources and Services Administration contract 231-00-0115 and in part by National Institutes of Health grant R01-DK-56835 to A.K.S. The content is the responsibility of the authors alone and does not necessarily reflect the views or policies of the U.S. Department of Health and Human Services.
Footnotes
Publisher's Disclaimer: This is a PDF file of an unedited manuscript that has been accepted for publication. As a service to our customers we are providing this early version of the manuscript. The manuscript will undergo copyediting, typesetting, and review of the resulting proof before it is published in its final citable form. Please note that during the production process errors may be discovered which could affect the content, and all legal disclaimers that apply to the journal pertain.
References
- 1.Ojo AO, Wolfe RA, Held PJ, Port FK, Schmouder RL. Delayed graft function: risk factors and implications for renal allograft survival. Transplantation. 1997;63:968–974. doi: 10.1097/00007890-199704150-00011. [DOI] [PubMed] [Google Scholar]
- 2.Shoskes DA, Cecka JM. Deleterious effects of delayed graft function in cadaveric renal transplant recipients independent of acute rejection. Transplantation. 1998;66:1697–1701. doi: 10.1097/00007890-199812270-00022. [DOI] [PubMed] [Google Scholar]
- 3.Salahudeen AK. Cold ischemic injury of transplanted kidneys: new insights from experimental studies. Am J Physiol Renal Physiol. 2004;287:F181–187. doi: 10.1152/ajprenal.00098.2004. [DOI] [PubMed] [Google Scholar]
- 4.Kendrick E, Singer J, Gritsch HA, Rosental JT. Medical and surgical aspects of kidney donation. In: Danovitch GM, editor. Handbook of kidney transplantation. 4. Baltimore: Lippincot Williams and Wilkins; 2005. pp. 135–168. [Google Scholar]
- 5.Salahudeen AK, Haider N, May W. Cold ischemia and the reduced long-term survival of cadaveric renal allografts. Kidney Int. 2004;65:713–718. doi: 10.1111/j.1523-1755.2004.00416.x. [DOI] [PubMed] [Google Scholar]
- 6.Cohen B, Smits JM, Haase B, Persijn G, Vanrenterghem Y, Frei U. Expanding the donor pool to increase renal transplantation. Nephrol Dial Transplant. 2005;20:34–41. doi: 10.1093/ndt/gfh506. [DOI] [PubMed] [Google Scholar]


