

Abstract
Our objective was to investigate whether asymptomatic carriers of apolipoprotein E ε4 [APOE-4] demonstrate pathological differences and atrophy in medial temporal lobe (MTL) sub-regions. We measured cortical thickness and volume in MTL sub-regions (hippocampal CA fields 1, 2 and 3; dentate gyrus; entorhinal cortex; subiculum; perirhinal cortex; parahippocampal cortex; and fusiform gyrus) using a high-resolution in-plane (.4×.4mm) MRI sequence in 30 cognitively normal volunteers (14 APOE–4 carriers, 16 non-carriers, mean age 57 years). A cortical unfolding procedure maximized visibility of this convoluted cortex, providing cortical ribbon thickness measures throughout individual subregions of the hippocampus and surrounding cortex. APOE–4 carriers had reduced cortical thickness compared with non-carriers in entorhinal cortex (ERC) and the subiculum (Sub), but not in the main hippocampal body or perirhinal cortex. Average cortical thickness was 14.8% lower (p=1.0e−6) for ERC and 12.6% lower (p=6.8e−5) for Sub in APOE-4 carriers. Standard volumetric measures of the same regions showed similar, but non-significant trends. Cognitively intact carriers of APOE-4 show regionally specific thinning of the cortical ribbon compared to APOE-3 carriers; cortical thickness may be a more sensitive measure of pathological differences in genetic risk subjects than standard volumetry.
Introduction
Imaging studies of asymptomatic subjects carrying the apolipoprotein E ε4 (APOE–4) allele, the primary genetic risk factor for late-onset Alzheimer’s disease (AD) (Saunders et al., 1993), have demonstrated abnormalities in the medial temporal lobe and hippocampus using FDG-PET (Reiman et al., 1996; Small et al., 2000a; Small et al., 1995), and functional MRI (fMRI) (Bondi et al., 2005; Bookheimer et al., 2000; Saykin et al., 1999; Smith et al., 2002). However, results from volumetric MRI studies of cognitively intact APOE-4 carriers compared to non-carriers are mixed. One study reported significant reductions in hippocampal volumes in cognitively-intact APOE-4 subjects (Plassman et al., 1997), but most volumetric studies have found trends for lower hippocampal volumes that did not reach significance (Jack et al., 1998; Reiman et al., 1998; Schmidt et al., 1996; Tohgi et al., 1997).
Within the medial temporal lobe (MTL), the entorhinal cortex (ERC) is the earliest site of AD pathology and volume loss (Bobinski et al., 1999; Braak and Braak, 1996; Gomez-Isla et al., 1996), present even in predementia stages of the disease (Gomez-Isla et al., 1996). Very early in the progression of AD, individual layers, rather than whole regions of cortex, show marked loss of neurons (Gomez-Isla et al., 1996). The restriction of AD pathology to specific laminae of the ERC was powerfully demonstrated by Gomez-Isla and colleagues (Gomez-Isla et al., 1996) who revealed that mild AD subjects had a 60% reduction in cell count within layer II of the ERC and 40% reduction in layer IV compared to controls. The authors concluded that even in the mildest stage of AD, the marked decrement of layer II neurons differentiated disease-related pathology from normal aging. High-resolution MRI confirmed the presence of sub-regionally specific neuronal dysfunction that was greatest within the ERC in AD (Small et al., 2000). These studies suggest that cortical thickness, or the distance between inner and outer gray matter boundaries, may be a more sensitive measure of AD-related pathology than traditional volumetric methods that assess total size. Such findings raise the possibility that in-vivo measures of cortical thickness might identify differences in subjects carrying a genetic risk for AD but without current symptoms.
We used a new cortical unfolding technique to identify subregional atrophy within the MTL of APOE-4 carriers. These tools were first applied to visual cortex (Dale et al., 1999; Fischl et al., 1999; Van Essen and Drury, 1997) and then adapted in our laboratory to investigate the hippocampus in younger control subjects (Zeineh et al., 2000; Zeineh et al., 2003). This technique uses high-field, high-resolution in-plane MRI imaging to maximize spatial resolution within the MTL in combination with a cortical unfolding procedure to increase visibility of the convoluted cortical strip within the MTL. Previous work using high-resolution imaging to evaluate hippocampal subregions demonstrated diminished resting state signal within the ERC of AD patients compared to healthy controls (Small et al., 2000). In a more recent study, the authors concluded high-resolution T2 weighted MRI’s could successfully be used to evaluate the internal structure of the hippocampal formation (Mueller et al., 2007). These results suggest that high-resolution imaging may be useful for evaluating individual subregions within the convoluted MTL. The cortical unfolding method in the present study allows us to examine the thickness of the cortical ribbon in 3-D space throughout each identified subregion separately. Because this method measures the thickness of the gray matter ribbon directly, we hypothesized that it may be more sensitive to neural loss than volumetric measurements (Kuperberg et al., 2003) in genetically at-risk, but cognitively intact subjects. Measures of whole-brain cortical thickness have shown high reliability and accuracy compared to published postmortem and in-vivo calculations (Fischl and Dale, 2000; MacDonald et al., 2000). Cerebral cortical thickness as a measure of structural abnormalities has been used and validated in numerous studies across a variety of disorders including schizophrenia (Kuperberg et al., 2003; Narr et al., 2005), Williams syndrome (Thompson et al., 2005b), HIV/AIDS (Thompson et al., 2005a), and AD (Thompson et al., 2003). We further hypothesized that, because early pathological changes in AD are limited to layer II and IV of the ERC, subregional cortical thickness measures would be more sensitive than subregional or whole-hippocampal volumetric measures in discriminating between cognitively intact APOE-4 and APOE-3 subjects.
Methods
Thirty right-handed subjects (16 APOE-3/3; 14 APOE-4/3) gave written informed consent to participate in this study, which was approved by the University of California, Los Angeles Office for the Protection of Research Subjects. All subjects were given a diagnostic evaluation to rule out medical and psychiatric problems and screened for any history of neurological problems or psychiatric conditions including hypertension or cardiovascular disease. Subjects were required to score 0 (no dementia) on the Clinical Dementia Rating (CDR) Scale (Hughes et al., 1982) and must not have met diagnostic criteria for possible or probable AD (McKhann et al., 1984). To ensure that we did not include subjects in the early stages of dementia, we only included subjects who scored ≥ 27 on the Mini-Mental State Exam (MMSE) (Bleecker et al., 1988). Subjects were genotyped for APOE using standard methods (Wenham et al., 1991). To avoid experimental bias, the investigators performing the scanning and unfolding procedures were blind to each subject’s genetic status. The two genetic groups were similar across all neuropsychological tests and clinical characteristics, and we detected no significant differences between the groups (Table 1).
Table 1.
Demographic And Clinical Characteristics Of Subject Groups.
| Characteristic | Range of Possible Scores | APOE-4/3 (N=14) | Non-APOE-4 Carriers (N=16) |
|---|---|---|---|
| Female Sex - no (%) | 7 (50) | 8 (50) | |
| Age -- year | 57.7±9.6 | 57.3±7.8 | |
| Years of Education | 17.0±4.8 | 15.4±2.0 | |
| Mini-Mental State Examination | 0–30 | 28.9±2.2 | 29.5±0.7 |
| Benton Visual Retention Test, total errors | 0–30 | 4.4±3.3 | 3.3±1.5 |
| Weschler Memory Scale, Logical Memory Delayed Recall Portion | 0–50 | 26.2±9.3 | 26.0±6.4 |
| Buschke-Fuld Selective Reminding Test, Consistent Long Term Retrieval Section | 0–144 | 66.2±36.9 | 70.8±42.8 |
MRI scanning was performed on a 3-Tesla scanner (General Electric, Waukesha, Wis.). Echo-planar shimming sequence achieved approximately 0.3 ppm r.m.s. field inhomogeneity. A Fast Spin Echo (FSE) sagittal sequence [TR 6000/TE 17&85/4 mm thick, 1 mm spacing/FOV 20 cm/1 NEX/ 26 slices] was used for spatial localization. A high-resolution oblique coronal T2 FSE structural sequence was acquired for structural segmentation and unfolding procedures [TR 3000/TE 41/ 3mm thick, 0 mm spacing/FOV 20 cm/ 2 NEX/16 slices, in-plane voxel size 0.39×0.39mm]. These images were acquired perpendicular to the long axis of the hippocampus to minimize slice-to-slice variation in anatomy (Zeineh et al., 2001). A T-1 weighted 3-dimensional volume scan [SPGR, T1 500/TE 3.7/FOV 20/1 NEX] was also acquired to visually serve as a guide in sulcal visualization during segmentation procedures in the same way an atlas is used as a visual reference.
Structural unfolding was used to create a continuous gray matter strip within the MTL using the high-resolution structural images, described in detail by Zeineh and colleagues (Zeineh et al., 2000; Zeineh et al., 2003). The unfolding procedure is designed to take the entire volume of pixels within the MTL defined as gray matter in a 3-D strip and flatten it so the volume is visible as a single 2-D sheet. First, we manually defined white matter and cerebrospinal fluid (CSF) within the MTL (Figure 1A). We segmented the following as “white matter”: (1) white matter in the parahippocampal gyrus throughout the fill rostrocaudal extent, (2) white matter on the medial aspect of the occipitotemporal sulcus, (3) CSF in the inferior horn of the lateral ventricle, and (4) the fornix. We segmented the following as “CSF”: (5) CSF in the collateral sulcus and the hippocampal fissure, (6) the ambient cistern (including the wing) and the adjacent posterior cerebral artery and basal vein, and (7) the boundaries of the segmentation. We next used a region-expansion algorithm to grow 18 connected layers of gray matter from the white-matter edge, stopping at the boundary of CSF and covering all of the gray matter pixels of interest. The final product was a gray matter ribbon that included cornu ammonis (CA) fields 1, 2, and 3, the dentate gyrus (DG), subiculum (Sub), ERC, perirhinal cortex (PRC), parahippocampal cortex (PHC), and the fusiform gyrus (Fus). As in previous studies using the unfolding procedure (Eldridge et al., 2005; Zeineh et al., 2000; Zeineh et al., 2003), we identified these regions using a rule-based decision schema in concert with histological and MRI atlases (Amaral and Insausti, 1990; Duvernoy, 1998; Mai, 1997). Unfolding computations were performed using modified versions of mrUnfold software [available at http://sourceforge.net/projects/mtl-unfolding/] (Engel et al., 1997). As shown in color on the MRI image (Figure 1B) and explained in detail in the figure legend, we delineated the boundaries of the following subregions on the in-plane image based on reference to atlases (Amaral and Insausti, 1990; Duvernoy, 1998; Mai, 1997) : Fus, PHC, PRC, ERC, Sub, CA1 and CA fields 2, 3 and dentate gyrus (CA23DG). Because of the convoluted shape of CA fields 2, 3 and dentate gyrus in the anterior hippocampus the regions were treated as a single entity. The thickness map of one subject in 3-dimensional space, superimposed on an anatomical image is shown in Figure 1C.
Figure 1. Cortical Thickness In Oblique Coronal Orientation (Zeineh et al., 2000).

A). “White matter” and “CSF” is manually defined within the MTL as the first step of the segmentation procedure (Figure 1A & B). Regional boundaries on the in-plane image are shown in color: lateral aspect of the collateral sulcus (green), the deepest point of the collateral sulcus (CoS) which separates the fusiform from the parahippocampal cortex (purple), the horizontal, medial aspect of the parahippocampal gyrus which forms the border between parahippocampal cortex and the subiculum (blue), the border between CA1 and subiculum, just inferior to the most medial extent of the CA3 and dentate gyrus of the hippocampal body (brown), the border between CA1 and CA2, drawn from the end of the hippocampal fissure to the lateral ventricle, with a 45° angle with respect to the horizontal axis of the subject. C). Coronal slice through 3-D thickness map of one subject, superimposed on an anatomical image. D). An averaged cortical thickness map in flat map space for the left hippocampus of APOE-4 subjects. Gray scale intensity represents cortical thickness, in millimeters, as denoted by the grayscale bar on the right side of the image. The boundary lines are color-coded to match the corresponding line from Figure 1B.
All demarcations of structural boundaries were traced on the original coronal images and projected mathematically to the corresponding coordinates in flat map space. We performed reverse transformations for each subject and visually compared this reverse transformation to the original data to confirm that the data was in the correct space (Zeineh et al., 2000). Prior work has confirmed that this algorithm produces topographically correct unfoldings with minimal levels of distortion (Wandell et al., 1996; Zeineh et al., 2000; Zeineh et al., 2003).
Thickness maps were produced in 3-dimensional (3D) space as follows: for each gray matter voxel in each layer of the manifold we computed the distance to the closest non-gray matter voxel (white matter or CSF). The middle layer of any given section of cortex will be equidistant from the adjacent white matter and CSF and will have the greatest distance values to the closest non-gray voxel. For each 2-dimensional (2D) flat voxel, we took the maximum of the distance values of the corresponding 3D voxels across all layers (thus effectively extracting this middle layer which will be the maximum) and multiplied by two to arrive at a thickness value. In the 2D maps, thickness was represented in voxel intensity.
We conducted a region of interest (ROI) analysis of cortical thickness for the following subregions: Fus, PHC, PRC, ERC, Sub, CA1, and CA23DG. We computed the mean thickness in each subregion by averaging the thickness across all 2-D voxels within each ROI. To average across hemispheres in each subject, we weighted the mean thickness according to the number of 2D voxels within that subregion in order to minimize the potentially confounding effects of surface area asymmetries. This weighted mean thickness for each subregion was used in our statistical analyses. We calculated the total hippocampal thickness in each subject by performing a similarly weighted average across all of the subregions. In order to assess volume, we calculated the volume of the voxels for each given region in 3-D space. In addition, the total mean cortical volume was calculated by averaging across all of these subregions within the MTL.
Two sample t-tests assuming unequal variance determined the significance of cortical thickness and volume differences between the two genetic groups. We used a corrected Bonferroni threshold of p=0.007 to adjust for multiple comparisons between the subregions. In order to assess the reliability of this technique for use in calculating cortical thickness, a single rater repeated the entire analysis on 6 subjects (3 APOE-3/3 and 3 APOE-3/4) and calculated reliability for both thickness and volumetric measurements. We used the intra-class correlation coefficient (ICC) to evaluate intra-rater reliability, reporting also the standard error of the mean (SEM).
Results
Averaged cortical thickness maps for both groups illustrate the difference in cortical thickness (from 1–5mm) by subregion (Figure 2). The ROI analysis showed that ERC was, on average, 14.8% thinner in APOE-4 carriers (p=1.0e−6) and 12.6% less for APOE-4 carriers in the Sub (p=6.8e−5), compared to non-carriers. No other subregions showed a difference of more than 4% and none was significantly different between groups (at the p= 0.05 level). There were no significant differences in left-right asymmetry within the subregions between the genetic groups. Cortical thickness averaged over all subregions, or total cortical thickness, was 6.8% less in APOE-4 carriers (p=0.0015) (Figure 3).
Figure 2. Cortical Thickness Within The MTL By Subregion.
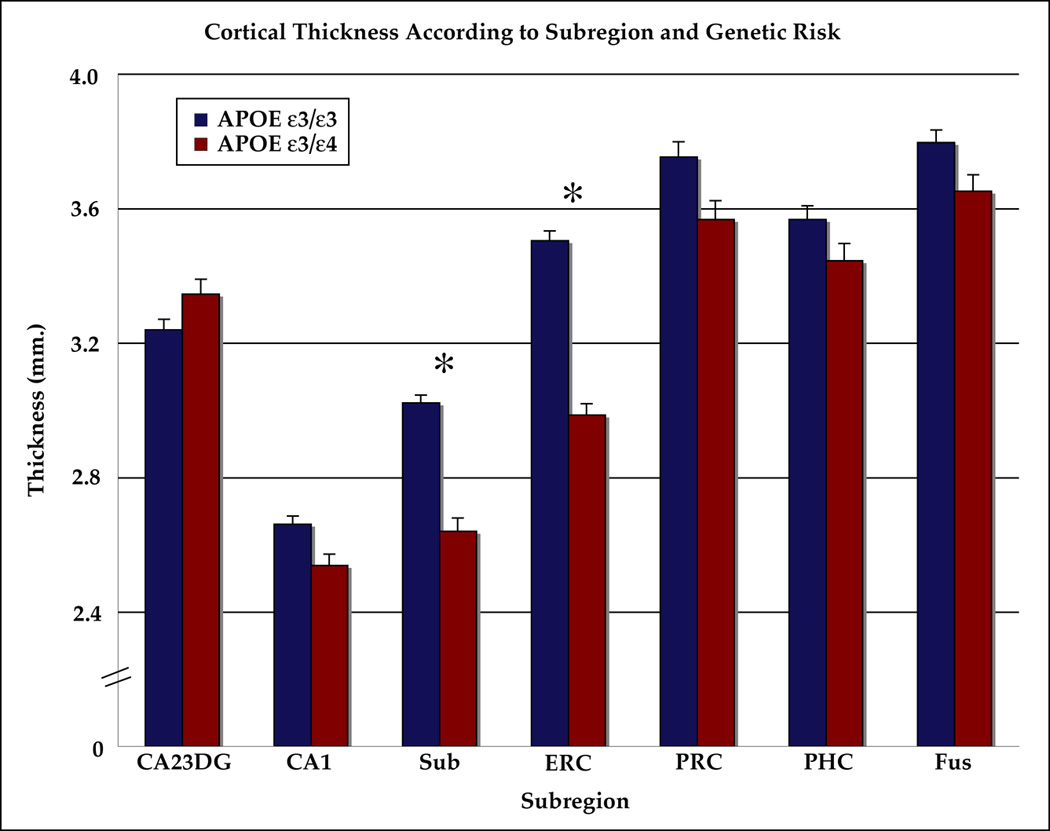
Significant differences between the groups are indicated by ‘*’ (p< 0.05, Student’s t-test, Bonferroni corrected for seven comparisons). Cortical thickness was significantly lower for carriers of the APOE-4 allele in subiculum and ERC. Note: ‘CA23DG’=Cornu Ammonis fields 2,3 and the dentate gyrus, ‘CA1’=Cornu Ammonis field 1, ‘Sub’=subiculum, ‘ERC’=entorhinal cortex, ‘PRC’=perirhinal cortex, ‘PHC’=parahippocampal cortex, ‘Fus’=fusiform cortex.
Figure 3. Total Cortical Thickness Versus Total Volumetric Measurements Within the MTL.
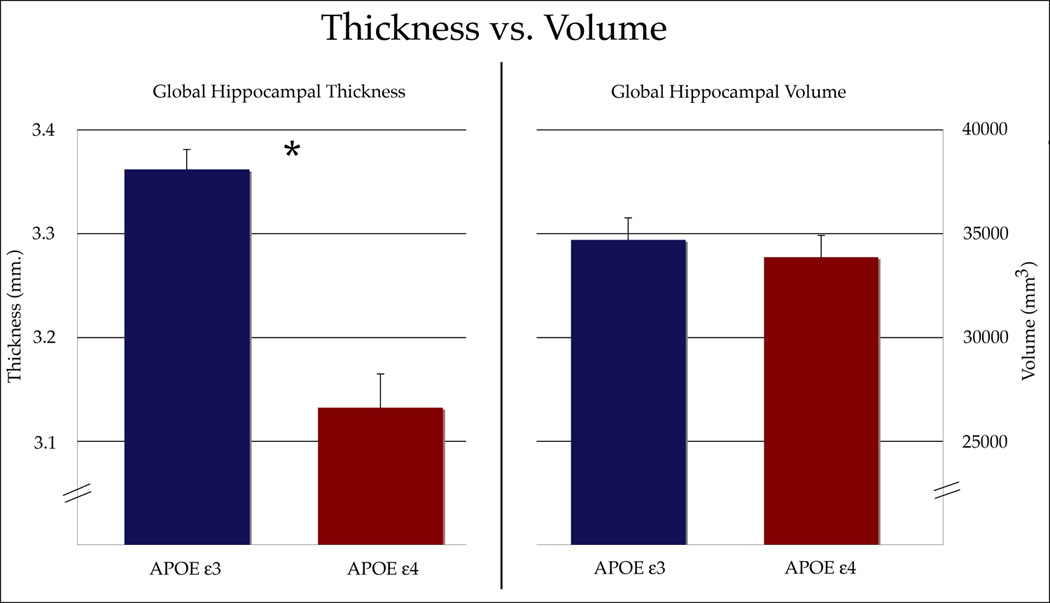
Genetic risk groups were significantly different (p<0.05) from each other when using average cortical thickness as an assessment of structural differences within the MTL. Volumetric measurements, however, did not reveal any differences between APOE-4 carriers and non-carriers.
ICCs for cortical thickness measurements in MTL subregions of APOE-4 carriers were calculated for all subregions (CA23DG: 0.973, CA1: 0.981, Sub: 0.988, ERC: 0.992, PRC: 0.970, PHC: 0.994, Fus: 0.986). ICC results from APOE-3 carriers were similar (CA23DG: 0.969, CA1: 0.974, Sub: 0.982, ERC: 0.983, PRC: 0.989, PHC: 0.987, Fus: 0.991). Averaged over all regions, the ICC was 0.983 for APOE-4 carriers and 0.982 for APOE-3 carriers. SEM values were also similar between the two genetic risk groups (APOE-4: 0.044; APOE-3: 0.038). We also determined ICC values for volumetric measurements in APOE-4 carriers (CA23DG: 0.967, CA1: 0.985, Sub: 0.968, ERC: 0.991, PRC: 0.974, PHC: 0.982, Fus: 0.993) and APOE-3 carriers (CA23DG: 0.996, CA1: 0.983, Sub: 0.972, ERC: 0.978, PRC: 0.993, PHC: 0.982, Fus: 0.989). Total ICC and SEM values over all of these subregions for the genetic groups were similar for hippocampal volumetric measurements (APOE-4: 0.980; APOE-3: 0.981). SEM values for both genetic risk groups were also similar (APOE-4: 0.047; APOE-3: 0.045).
We found no significant differences in volume measures between the two APOE groups. Differences in volume within the ERC (p=0.065) and Sub (p=0.10) approached, but did not pass the level of significance. Volume averaged over all subregions, or total volume, was not significantly different between APOE groups and is compared to total cortical thickness results in Figure 3.
Discussion
In cognitively intact carriers of the APOE-4 allele, we found significantly reduced cortical thickness in ERC and Sub compared to non-carriers. While volumetric measurements are the more commonly used technique for assessing pathological differences in subjects with differing genotypes, we found no volumetric differences between APOE-4 subjects and non-carriers, though there was a trend towards reduced volume in ERC. Volume change within ERC is an early and distinguishing feature of AD and most likely occurs several years before the onset of symptoms (Schott et al., 2003). APOE is well-known as the most commonly known genetic risk factor for late-onset Alzheimer’s disease (AD) (Saunders et al., 1993). The subregional reduction in cortical thickness, however, cannot be interpreted to be either a direct manifestation of a disease process or predisposition to later development of AD without knowledge of which subjects will ultimately develop AD. Nonetheless, because the cortical thickness measurements in this study evaluated the three-dimensional laminar structure of cortex, these results reveal subtle differences in cortex among the genetic groups that were not significant using volumetric measurements. Longitudinal follow-up will determine how these morphological differences represent brain changes that may lead to a disease state.
Structural MRI studies of hippocampal damage have traditionally used volumetry to analyze cortical structure. The laminar organization of human cerebral cortex, however, and the specificity of neuronal loss within layers II and IV in early AD (Gomez-Isla et al., 1996; Hyman et al., 1984) favors the use of measures of cortical thickness over volume, especially in an asymptomatic population in whom cortical changes, if present, are likely to be extremely subtle. The affected cells in these layers connect the hippocampus with association cortices, thalamus, hypothalamus and basal forebrain – they are crucial to memory formation and the cause of early memory impairment in the disease (Hyman et al., 1984). Dynamic patterns of gray matter loss in AD have been more recently revealed in vivo using neuroimaging (Barnes et al., 2004; Thompson et al., 2003). Patients with AD had a total gray matter loss rate of 5% per year, on average, compared to healthy controls who lost only 1% gray matter per year (Thompson et al., 2003). Abnormalities in cortical thickness might reflect underlying neuropathological abnormalities in the intrinsic structure of cortical laminae (Kuperberg et al., 2003; von Economo, 1929).
Volumetric measurements are the most commonly used measures of structural change in AD. However, our volumetric measurements detected no significant differences between the two APOE groups, either in individual subregions or total volume within the MTL. In studies that have examined the hippocampal volume in cognitively-intact APOE-4 carriers, non-significant gray matter volume changes in the expected direction may suggest that with either more subjects or slightly older subjects significant differences would have been seen. Of the volumetric studies that have not found significant differences in the hippocampal volumes of APOE-4 subjects, many have reported trends towards lower hippocampal volumes in the at-risk group (Jack et al., 1998; Reiman et al., 1998; Schmidt et al., 1996; Tohgi et al., 1997). Schmidt and colleagues reported that while there were no significant differences in the hippocampal volume of APOE-4 carriers, they found the normalized hippocampal volumes in their at-risk group to be 7% smaller (Schmidt et al., 1996). Congruent with these findings, Tohgi and colleagues reported 9% reductions in their at-risk subjects (p=0.06) (Tohgi et al., 1997). There was a non-significant, 8% reduction in non-demented carriers of the APOE-4 allele in a study by Reiman and colleagues (Reiman et al., 1998). The study by Plassman and colleagues reported significantly lower hippocampal volumes in APOE-4 carriers and suggested that the at-risk allele may be associated with morphological differences in the absence of clinical symptoms (Plassman et al., 1997).
Our results also reveal a trend using volumetric measurements, although these differences in the genetic groups were not significant. Hippocampal volumes in our study were, on average, 2.7% lower in APOE-4 carriers. When we evaluated cortical thickness in these same cognitively intact subjects, the average for the entire MTL region was reduced by 6.8% (p=0.0015). However, on a subregional scale cortical thickness was reduced by 14.8% (p=1.0e−6) in ERC and 12.6% (p=6.83e−5) in the Sub. Because of the complex curvature of the MTL, which is “rolled,” traditional volumetric methods cannot easily differentiate the hippocampal subregions, which differ in how and when they are affected by incipient AD. Further, volumetric measures may be more variable as they are more sensitive to baseline differences in the size, and may measure the effects of intra-laminar cell loss less directly than cortical thickness. Our measurements of cortical thickness were made solely on the basis of gray matter and did not take into account white matter degeneration. Several studies have evaluated white matter loss versus gray matter loss in AD-related pathology and have reported gray matter to be more sensitive to AD-related pathology (Fotenos et al., 2005; Thompson et al., 2003). While white matter lesions have been found in both normal aging and in AD (Burns et al., 2005), Thompson and colleagues found no significant differences in white matter loss rates between AD patients relative to control subjects (Thompson et al., 2003).
There are several potential explanations for these results that should be addressed. Because volume is a product of thickness by area, there may be a large amount of variation in cortical surface area across subjects that may not be related to AD or genetic risk. This makes overall volumetric measures less sensitive as they include this type of area variation (which may not have a significant effect on cognition). It is worth noting that because the resolution of our images results in anisotropic voxels (0.4×0.4×3mm), it is possible that the highly elongated voxel length results in a lapse in our ability to observe gyral variations that take place within the 3 mm thick slices. However, because reducing slice thickness would require sacrificing in-plane resolution that was critical to our ability to visualize gray-white matter boundaries within the MTL, we advocate our choice of maximizing in-plane resolution as the most beneficial for this segmentation procedure. To compensate for this limitation, we did acquire and do recommend concomitant 3-D isotropic T1-weighted images with lower in-plane but higher through-plane resolution which aid in visualization and segmentation. Also, because thickness is a component of volume, one might expect that, keeping all else constant, a reduction in thickness should result in decreased volume. However, given the relative size of the average thickness within the hippocampus versus the total volume metrics, the impact of cortical thinning on total volume would be expected to be quite minimal. A significant difference in cortical thickness in a subregion would only minimally change the volume as a whole. Additionally, thinning might be quite localized and its effect washed out in a more global measure. This may explain the inconsistent results that volumetric studies have revealed in similar APOE-4 subjects in the past (Jack et al., 1998; Plassman et al., 1997; Reiman et al., 1998; Schmidt et al., 1996; Tohgi et al., 1997). Also, although we corrected for the size of individual subregions by weighting them according to the number of voxels, we did not correct for whole-brain cortical thickness or volume, thus these findings may not be limited to the MTL. Finally, it remains unclear from our data whether these differences reflect a baseline difference in the brains of APOE-4 carriers, and perhaps a risk factor for AD, or whether they actually reflect the beginnings of progressive cell loss that will eventually lead to AD.
The results of this study support the use of MRI to assess structural brain differences among genetic groups. Our findings reveal lower cortical thickness values in APOE-4 carriers compared to non-carriers in regions associated with early pathological changes in AD. However, only longitudinal follow-up of these subjects will reveal whether the cortical changes in this study represent pathological changes related to AD. We suggest measuring cortical thickness in addition to volume forms a more complete representation of the local nature of associations between this genetic variant and brain structure changes.
Acknowledgments
Supported by NIH grants P01-AG024831, AG13308, and P50-AG16570, and the John D. French Foundation for Alzheimer's Research. The authors also thank Ms. Andrea Kaplan, and Ms. Debbie Dorsey for help in subject recruitment, data management, and study coordination.
Footnotes
Publisher's Disclaimer: This is a PDF file of an unedited manuscript that has been accepted for publication. As a service to our customers we are providing this early version of the manuscript. The manuscript will undergo copyediting, typesetting, and review of the resulting proof before it is published in its final citable form. Please note that during the production process errors may be discovered which could affect the content, and all legal disclaimers that apply to the journal pertain.
Contributor Information
A. C. Burggren, University of California, Los Angeles Address: David Geffen School of Medicine at UCLA; Center for Cognitive Neurosciences; Semel Institute; 760 Westwood Plaza B8-169; Los Angeles, CA 90095, Phone: 310-794-9360, Fax: 310-794-7406
M. M. Zeineh, Stanford University Address: Stanford University Medical Center, 300 Pasteur Dr. Room S-092; Stanford, CA 94305-5105, Phone: 650-725-7296, Fax: 650-723-8316
A. D. Ekstrom, University of California, Los Angeles Address: David Geffen School of Medicine at UCLA; Center for Cognitive Neurosciences; Semel Institute; 760 Westwood Plaza B8-169; Los Angeles, CA 90095, Phone: 310-794-9360, Fax: 310-794-7406
M. N. Braskie, University of California, Berkeley Address: 132 Barker Hall, Mail Code #3190, Berkeley, CA 94720-3190, Phone: 510-643-6616, Fax: 510-642-3192
P. M. Thompson, University of California, Los Angeles Address: UCLA Neuro; BOX 957332; 635 Charles E. Young Dr. South, Ste 225; Los Angeles, CA 90095-7332, Phone: 310-206-2101, Fax: 310-206-5518
G. W. Small, University of California, Los Angeles Address: UCLA Department of Psychiatry and Biobehavioral Sciences/Med-Geri, Center on Aging, BOX 951759; 88-201 NPI/3119 PVUB; Los Angeles, CA 90095-1759, Phone: 310-825-0291, Fax: 310-825-3910
S. Y. Bookheimer, University of California, Los Angeles Address: David Geffen School of Medicine at UCLA; Center for Cognitive Neurosciences; Semel Institute; 740 Westwood Plaza; Los Angeles, CA 90095, Phone: 310-794-6386, Fax: 310-794-7406, Email:sbook@ucla.edu
References
- Amaral DG, Insausti R. Hippocampal Formation. In: G. Praxinos E, editor. The Human Nervous System. San Diego: Academic Press; 1990. pp. 711–755. [Google Scholar]
- Bleecker ML, Bolla-Wilson K, Kawas C, Agnew J. Age-specific norms for the Mini-Mental State Exam. Neurology. 1988;38:1565–1568. doi: 10.1212/wnl.38.10.1565. [DOI] [PubMed] [Google Scholar]
- Burns JM, Church JA, Johnson DK, Xiong C, Marcus D, Fotenos AF, et al. White Matter Lesions Are Prevalent but Differentially Related With Cognition in Aging and Early Alzheimer Disease. Arch Neurol. 2005;62:1870–1876. doi: 10.1001/archneur.62.12.1870. [DOI] [PubMed] [Google Scholar]
- Dale AM, Fischl B, Sereno MI. Cortical surface-based analysis. I. Segmentation and surface reconstruction. Neuroimage. 1999;9:179–194. doi: 10.1006/nimg.1998.0395. [DOI] [PubMed] [Google Scholar]
- Duvernoy HM. The Human Hippocampus: Functional Anatomy, Vascularization, and Serial Sections with MRI. Berlin: Springer; 1998. [Google Scholar]
- Engel SA, Glover GH, Wandell BA. Retinotopic organization in human visual cortex and the spatial precision of functional MRI. Cereb Cortex. 1997;7:181–192. doi: 10.1093/cercor/7.2.181. [DOI] [PubMed] [Google Scholar]
- Fischl B, Dale AM. Measuring the thickness of the human cerebral cortex from magnetic resonance images. Proc Natl Acad Sci U S A. 2000;97:11050–11055. doi: 10.1073/pnas.200033797. [DOI] [PMC free article] [PubMed] [Google Scholar]
- Fischl B, Sereno MI, Dale AM. Cortical surface-based analysis. II: Inflation, flattening, and a surface-based coordinate system. Neuroimage. 1999;9:195–207. doi: 10.1006/nimg.1998.0396. [DOI] [PubMed] [Google Scholar]
- Gomez-Isla T, Price JL, McKeel DW, Jr, Morris JC, Growdon JH, Hyman BT. Profound loss of layer II entorhinal cortex neurons occurs in very mild Alzheimer's disease. J Neurosci. 1996;16:4491–4500. doi: 10.1523/JNEUROSCI.16-14-04491.1996. [DOI] [PMC free article] [PubMed] [Google Scholar]
- Hughes CP, Berg L, Danziger WL, Coben LA, Martin RL. A new clinical scale for the staging of dementia. Br J Psychiatry. 1982;140:566–572. doi: 10.1192/bjp.140.6.566. [DOI] [PubMed] [Google Scholar]
- Hyman BT, Van Horsen GW, Damasio AR, Barnes CL. Alzheimer's disease: cell-specific pathology isolates the hippocampal formation. Science. 1984;225:1168–1170. doi: 10.1126/science.6474172. [DOI] [PubMed] [Google Scholar]
- MacDonald D, Kabani N, Avis D, Evans AC. Automated 3-D extraction of inner and outer surfaces of cerebral cortex from MRI. Neuroimage. 2000;12:340–356. doi: 10.1006/nimg.1999.0534. [DOI] [PubMed] [Google Scholar]
- Mai JK. Atlas of the Human Brain. San Diego: Academic Press; 1997. [Google Scholar]
- McKhann G, Drachman D, Folstein M, Katzman R, Price D, Stadlan EM. Clinical diagnosis of Alzheimer's disease: report of the NINCDS-ADRDA Work Group under the auspices of Department of Health and Human Services Task Force on Alzheimer's Disease. Neurology. 1984;34:939–944. doi: 10.1212/wnl.34.7.939. [DOI] [PubMed] [Google Scholar]
- Mueller SG, Stables L, Du AT, Schuff N, Truran D, Cashdollar N, et al. Measurement of hippocampal subfields and age-related changes with high resolution MRI at 4T. Neurobiol Aging. 2007;28:719–726. doi: 10.1016/j.neurobiolaging.2006.03.007. [DOI] [PMC free article] [PubMed] [Google Scholar]
- Plassman BL, Welsh-Bohmer KA, Bigler ED, Johnson SC, Anderson CV, Helms MJ, et al. Apolipoprotein E epsilon 4 allele and hippocampal volume in twins with normal cognition. Neurology. 1997;48:985–989. doi: 10.1212/wnl.48.4.985. [DOI] [PubMed] [Google Scholar]
- Saunders AM, Strittmatter WJ, Schmechel V, George-Hyslop PH, Pericak-Vance MA, Joo SH, et al. Association of apolipoprotein E allele epsilon 4 with late-onset familial and sporadic Alzheimer's disease. Neurology. 1993;43:1467–1472. doi: 10.1212/wnl.43.8.1467. [DOI] [PubMed] [Google Scholar]
- Schmidt H, Schmidt R, Fazekas F, Semmler J, Kapeller P, Reinhart B, et al. Apolipoprotein E e4 allele in the normal elderly: neuropsychologic and brain MRI correlates. Clin Genet. 1996;50:293–299. doi: 10.1111/j.1399-0004.1996.tb02377.x. [DOI] [PubMed] [Google Scholar]
- Schott JM, Fox NC, Frost C, Scahill RI, Janssen JC, Chan D, et al. Assessing the onset of structural change in familial Alzheimer's disease. Ann Neurol. 2003;53:181–188. doi: 10.1002/ana.10424. [DOI] [PubMed] [Google Scholar]
- Small SA, Nava AS, Perera V, Delapaz R, Stern Y. Evaluating the function of hippocampal subregions with high-resolution MRI in Alzheimer's disease and aging. Microsc Res Tech. 2000;51:101–108. doi: 10.1002/1097-0029(20001001)51:1<101::AID-JEMT11>3.0.CO;2-H. [DOI] [PubMed] [Google Scholar]
- Thompson PM, Dutton RA, Hayashi KM, Toga AW, Lopez OL, Aizenstein HJ, et al. Thinning of the cerebral cortex visualized in HIV/AIDS reflects CD4+ T lymphocyte decline. Proc Natl Acad Sci U S A. 2005a;102:15647–15652. doi: 10.1073/pnas.0502548102. [DOI] [PMC free article] [PubMed] [Google Scholar]
- Thompson PM, Lee AD, Dutton RA, Geaga JA, Hayashi KM, Eckert MA, et al. Abnormal cortical complexity and thickness profiles mapped in Williams syndrome. J Neurosci. 2005b;25:4146–4158. doi: 10.1523/JNEUROSCI.0165-05.2005. [DOI] [PMC free article] [PubMed] [Google Scholar]
- Tohgi H, Takahashi S, Kato E, Homma A, Niina R, Sasaki K, et al. Reduced size of right hippocampus in 39- to 80-year-old normal subjects carrying the apolipoprotein E epsilon4 allele. Neurosci Lett. 1997;236:21–24. doi: 10.1016/s0304-3940(97)00743-x. [DOI] [PubMed] [Google Scholar]
- Van Essen DC, Drury HA. Structural and functional analyses of human cerebral cortex using a surface-based atlas. J Neurosci. 1997;17:7079–7102. doi: 10.1523/JNEUROSCI.17-18-07079.1997. [DOI] [PMC free article] [PubMed] [Google Scholar]
- Wenham PR, Price WH, Blandell G. Apolipoprotein E genotyping by one-stage PCR. Lancet. 1991;337:1158–1159. doi: 10.1016/0140-6736(91)92823-k. [DOI] [PubMed] [Google Scholar]
- Zeineh MM, Engel SA, Bookheimer SY. Application of cortical unfolding techniques to functional MRI of the human hippocampal region. Neuroimage. 2000;11:668–683. doi: 10.1006/nimg.2000.0561. [DOI] [PubMed] [Google Scholar]
- Zeineh MM, Engel SA, Thompson PM, Bookheimer SY. Unfolding the human hippocampus with high resolution structural and functional MRI. Anat Rec. 2001;265:111–120. doi: 10.1002/ar.1061. [DOI] [PubMed] [Google Scholar]
- Zeineh MM, Engel SA, Thompson PM, Bookheimer SY. Dynamics of the hippocampus during encoding and retrieval of face-name pairs. Science. 2003;299(5606):577–580. doi: 10.1126/science.1077775. [DOI] [PubMed] [Google Scholar]