


Abstract
All RNA sequences that fold into hairpins possess the intrinsic potential to form intermolecular duplexes because of their high self-complementarity. The thermodynamically more stable duplex conformation is favored under high salt conditions and at high RNA concentrations, posing a challenging problem for structural studies of small RNA hairpin conformations. We developed and applied a novel approach to unambiguously distinguish RNA hairpin and duplex conformations for the structural analysis of a Xist RNA A-repeat. Using a combination of a quantitative HNN-COSY experiment and an optimized double isotope-filtered NOESY experiment we could define the conformation of the 26-mer A-repeat RNA. In contrast to a previous secondary structure prediction of a double hairpin structure, the NMR data show that only the first predicted hairpin is formed, while the second predicted hairpin mediates dimerization of the A-repeat by duplex formation with a second A-repeat. The strategy employed here will be generally applicable to identify and quantify populations of hairpin and duplex conformations and to define RNA folding topology from inter- and intra-molecular base-pairing patterns.
INTRODUCTION
All RNA sequences that fold into hairpins possess the intrinsic potential to form intermolecular duplexes because of their high self-complementarity. The thermodynamically more stable duplex conformation is favored under high salt and high RNA concentrations. This is a challenging problem for structural studies: crystallization for X-ray crystallography often requires high salt conditions and NMR structural studies require sample concentrations in the millimolar range. Unambiguous identification of sample stoichiometry under experimental conditions is essential as early as possible in RNA structural studies to ensure that the RNA is present in a biologically relevant conformation.
Xist (X inactivation specific transcript) RNA is a large non-coding RNA essential for the initiation of X-inactivation in mammalian females (1). Early in embryonic development it is expressed from the X-chromosome that will be silenced and coats it in cis, which coincides with transcriptional shutdown through an unknown mechanism (2). The conserved so-called ‘A-repeats’ at the 5′-end of Xist are essential for its silencing function, while several other regions are redundantly responsible for chromosome association (3) (Figure 1A). In humans, the A-repeats are constituted of 7.5 copies of a 26 nt motif, connected by long U-rich linkers. A Mfold secondary structure prediction of a single A-repeat suggested a double hairpin structure where the two hairpins possibly stack on top of each other (3) (Figure 1B). As no structural information on the A-repeats is available, we started NMR studies on a single A-repeat (Figure 1C) with the goal to solve its atomic structure and to obtain molecular insight into X-Inactivation. The construct used in our study shown in Figure 1C is identical to the 5th human A-repeat, apart from switching the positions of G and C in the third G–C base-pair to facilitate chemical shift assignments. Previous studies have shown that altering the sequence of the stem in hairpin 1 does not influence Xist activity as long as base pairing is not disrupted (3). During our structural studies we encountered difficulties completing NMR assignments of the second predicted hairpin. Signals from this hairpin were broad, and sometimes doubled (data not shown), which indicated possible dynamics or sample heterogeneity, although native gel analysis of the 26-mer A-repeat RNA suggested a homogenous monomeric population (Supplementary Material). The strategy described in this article was essential to characterize and distinguish the intramolecular and intermolecular base pairs in monomeric/dimeric forms of RNA at sample conditions required for structural biology. The approach provided valuable insight into the possible architecture of the A-repeats.
Figure 1.

Schematic structure and sequence of Xist RNA and its A-repeats (A) Xist RNA is a long (15 kb in mouse, 17 kb in human) noncoding RNA. The A-repeats located at the 5′-end are essential for silencing, while other regions are redundantly responsible for chromosome association. (B) The A-repeats consist of 7.5 copies of a conserved sequence predicted to fold into two hairpins, connected by long U-rich linkers. N = any nucleotide; Y = C/U. (C) The 26-mer A-repeat construct used containing both predicted hairpins. This construct is identical to the fifth human Xist RNA A-repeat apart from the reversed G4-C11 base pair as described in the Introduction section. (D) The 14-mer A-repeat construct used in this study, containing the first predicted hairpin with a novel tetraloop.
NMR structures are determined from proton–proton distance restraints derived from nuclear Overhauser effects (NOEs), dihedral angle restrains derived from J-coupling constants and Residual Dipolar Couplings (4–8). Since chemical shifts and the pattern of NOEs in NMR spectra of hairpin and duplex species of a given nucleic acid are very similar, standard NMR techniques do not normally suffice to distinguish between the two. Other methods to determine the stoichiometry of nucleic acids include native gel electrophoresis and UV melting (9). However, these experiments are carried out at low concentrations. Hydrodynamic measurements such as ultracentrifugation, light scattering and NMR diffusion (10) are also available, but can be difficult to interpret for elongated molecules like RNA and for low molecular weight systems.
Several NMR methods have been developed to unambiguously distinguish between monomers and dimers of nucleic acids under NMR conditions (11–14). All these use an equimolar mixture of isotope labeled and unlabeled RNA/DNA. In such a mixture, different populations will exist for a RNA hairpin conformation with intramolecular base-pairing or for a duplex involving intermolecular base pairs. If the RNA folds into a hairpin, 50% of the molecules will be labeled and 50% will be unlabeled (Figure 2A). If the RNA adopts a duplex form, 25% of the molecules will be labeled, 25% will be unlabeled and 50% of the duplexes will consist of one labeled and one unlabeled strand (Figure 2B). Nucleic acid duplexes are detected based on differences in NMR parameters such as chemical shifts (11), cross-hydrogen bond h2JNN coupling constants (12,13) or NOEs (14).
Figure 2.

Schematic representation of the relative populations of species present in a 1:1 mixture of isotope labeled (magenta) and unlabeled (black) nucleic acids for (A) a hairpin conformation and (B) full duplex formation. The sequence of the second predicted hairpin of the Xist RNA A-repeat is shown.
The chemical shift based method (11) requires the introduction of a mutation that shifts a G imino signal to a characteristic frequency in the case of duplex formation. An obvious drawback of this method is that a change in the RNA sequence can possibly alter the monomer–dimer equilibrium.
The method using scalar couplings (12,13) is based on the HNN-COSY experiment (15), which relies on the transfer of magnetization across the hydrogen bond in nucleic acid base pairs using the two-bond h2JNN coupling. RNA duplexes are detected through a difference in intensities between cross- and diagonal peaks in HNN-COSY spectra, as in a duplex species with one labeled and one unlabeled strand magnetization transfer over the hydrogen bond cannot take place. We have extended this method and demonstrate that the molar fractions of hairpin and duplex species in a mixed population can be determined.
The NOE based method uses isotope editing/filtering techniques to distinguish intermolecular and intramolecular NOEs (14). NOEs arising from pairs of protons where one is bound to 15N and the other one bound to 14N can only arise from a duplex species. This is a complementary approach if an efficient J-based magnetization transfer across the base pair is not possible, for example in G–U pairs. We have employed simultaneous filters for protons attached to nitrogens and to carbon. Thereby, intermolecular NOEs involving imino-imino (in G–U base pairs) and imino–amino (in G–C base pairs) can be discriminated from NOEs involving imino protons and H2s in A–U base pairs.
Here we present the combination of HNN-COSY and NOE based methods to distinguish between monomeric hairpin and duplex conformations of nucleic acids. The approach is demonstrated and was crucial for the determination of the architecture of the Xist RNA A-repeats in our structural studies.
MATERIALS AND METHODS
Sample preparation
13C,15N uniformly labeled and unlabeled r(GGCGC [AUCG] GCGCUUCGG [AUAC] CUGC) A-repeat 26-mer RNA (consisting of both predicted A-repeat hairpins, Figure 1C) and r(GGCGC [AUCG] GCGCC) A-repeat 14-mer RNA (containing only the first hairpin, Figure 1D) was prepared by in vitro transcription with T7 RNA polymerase (EMBL Protein Expression and Purification Core Facility, Heidelberg, Germany) using synthetic DNA oligos (MWG Biotech/Eurofins MWG Operon, Ebersberg, Germany) as a template (16) and either 13C,15N labeled (Silantes, Munich, Germany) or unlabeled (Sigma-Aldrich, Munich, Germany) NTPs. The positions of G and C in the fourth base pair of the first predicted hairpin were reversed to facilitate NMR assignment. 2′-O-methyl groups were incorporated into the two 5′-residues of the DNA template strand to reduce the amount of n + 1 transcription products (17). The RNA was purified on preparative denaturing 20% (w/v) polyacrylamide (19:1 acrylamide: bisacrylamide) gels. Gel bands were visualized by UV shadowing using fluorescent thin layer chromatography plates (Whatman) and the band corresponding to the full-length product was excised and electroeluted (Schleicher & Schuell/Whatman, Dassel, Germany). The RNA was precipitated, resuspended and extensively washed in 1K MWCO concentrators (Pall, Dreieich, Germany) with 10 mM NaH2PO4/Na2HPO4 buffer (pH 6.0) of progressively decreasing NaCl concentration (1–0 M). Finally the RNA was desalted (PD-10, Amersham/GE Healthcare, Freiburg, Germany) and lyophilized.
NMR samples were prepared in 10 mM NaH2PO4/Na2HPO4 buffer (pH 6.0), 100 mM NaCl, 0.02% Azide, 0.02 mM EDTA in 95% H2O, 5% D2O. The RNA concentration of the 13C,15N uniformly labeled sample for recording the HNN-COSY reference experiment was 0.8 mM. An equal amount of unlabeled RNA was added to this sample, mixed, lyophilized and resuspended in the same amount of H2O/D2O. Both the edited/filtered NOESY and HNN-COSY were run on this 1.6 mM sample. In addition, the HNN-COSY was repeated on the same sample diluted to a total RNA concentration of 0.8 mM. Just before the NMR measurements samples were heated to 95° for 5 min followed by snap-cooling on ice with the rationale to trap the kinetically favored intramolecular monomeric hairpin conformation over a possible intermolecular dimer. The stoichiometry of the NMR samples was initially checked with native PAGE (Supplementary Material).
NMR Spectroscopy
HNN-COSY
NMR experiments were recorded at 5°C on a Bruker DRX600 spectrometer equipped with a cryoprobe. HNN-COSY spectra were recorded with the pulse sequence described by Dingley & Grzesiek (15) shown in Supplementary Figure 1. The delay T for evolution of the h2JNN coupling was set to 20, 30 and 40 ms. One thousand and twenty-four complex points were collected in t2 with a sweep width of 12.5 kHz, and 140 complex points were recorded in t1 with a sweep width of 6.25 kHz. Two hundred and fifty-six scans were recorded for each complex t1 increment. The experiments were performed with the 1H carrier positioned at the H2O resonance and the 15N carrier at 175 p.p.m. The data were zero filled to 512 × 2K complex data points, followed by apodization using Lorentz-to-Gauss transformation and cosine functions in t2 and t1, respectively, before Fourier transformation.
Isotope-edited/filtered NOESY
The ω1, ω2 double isotope-filtered NOESY experiment employed is shown in Figure 3. Compared to the experiment proposed by Aboul-ela et al. (14) for discrimination between intra- and intermolecular NOEs we have added a 13C filter in ω1. This allows the discrimination of intermolecular imino–imino NOEs in G–U base pairs, and the identification of intermolecular imino-H2 NOEs in A–U base pairs. Moreover, the ω1 filter is combined with semi-constant time chemical shift evolution (18,19) in t1 to exploit the filter delay 2Δ simultaneously for chemical shift labeling and J-coupling evolution (20) for improved sensitivity. Editing/filtering for both 15N and 13C in ω1 is accomplished by a ‘jumping’ 180 pulse (Figure 3). The pulse is applied before or after a delay Δ and Δ′, 1/2JHN and 1/2JHC in which anti-phase magnetization is created for HN and HC proton spins, respectively. If the pulse is applied at position (1) in Figure 3, the signals of 15N/13C bound proton spins are effectively inverted and have an opposite phase compared to other spins. If it is applied at position (2) (Figure 3), evolution of heteronuclear coupling is completely refocused during the semi-constant time evolution period, and 15N/13C- and 14N/12C-bound protons have the same phase. Transients are stored separately for the two positions of the jumping 180° pulses in order to be able to separate the inter- and intramolecular NOEs. The sum of scans (1) and (2) selects 14N/12C bound protons in ω1, its difference 15N/13C bound protons. In ω2, editing is achieved by applying two consecutive 90 pulses on 15N. The first pulse is applied with phase x and the second with phase ψ alternating between x and –x (21) and the two transients are stored separately. When both pulses have the same phase the signal of 15N bound protons is inverted. Again, the sum of scans with ψ = x and ψ = –x selects 14N bound protons in ω2, its difference 15N bound protons. A total of four different FIDs are recorded as described in Table 1, which results in (i) inverting signals of 15N/13C bound protons in ω1 and 15N bound protons in ω2; (ii) inverting only 15N bound proton signals in ω2; (iii) inverting only 15N/13C bound protons in ω1; and (iv) without any signal inversion. Linear combinations of these four FIDs yield four subspectra I–IV as shown in Table 2. The NOESY mixing time was set to 300 ms. The experiment was performed with the 1H carrier positioned at the H2O resonance and the 15N and 13C carriers both at 150 p.p.m. Pulse lengths for the 15N and 13C 180° pulses were 84 and 30 μs, respectively. For the 15N and 13C spins of interest in the G–C and A-U base pairs these pulses achieve better than 98% inversion. Therefore, incomplete inversion which could degrade the editing/filtering performance should not be an issue. One thousand and twenty-four complex points were collected in t2 with a sweep width of 13.9 kHz, and 256 complex points were recorded in t1 with a sweep width of 13.9 kHz. Thirty-two scans of four separate FIDs were collected for each complex point in t1. The data was zero filled to 512 × 2K complex data points and apodized using Lorentz-to-Gauss and cosine functions in t2 and t1, respectively before Fourier transformation.
Figure 3.

Double (ω1, ω2)-filtered NOESY pulse sequence to distinguish intra- and intermolecular NOEs in nucleic acid base pairs. Δ = 5.4 ms, Δ′ = 2.5 ms. Narrow and wide bars denote 90° and 180° pulses, respectively, and are applied with phase x unless stated otherwise. 13C, 15N 180° pulses are applied at position (1) or (2) to distinguish 13C/15N and 12C/14N bound protons. The 15N 180° pulses are composite pulses of the form 90°y180°x90°y. ψ = x, −x for distinguishing 15N/14N bound protons. Phase cycle: φ1 = x, −x + TPPI; φ2 = x, x, −x, −x; φrec = x, −x, −x, x. Water suppression is accomplished by WATERGATE (25) combined with water flip back (26). Gradients of 800 μs length were applied with 30% (g1) and 50% of maximal power (g2).
Table 1.
Transfer amplitude factors for the signals in the four different FIDs of the double filtered NOESY experiment shown in Figure 3
| FID | a | b | c | d |
|---|---|---|---|---|
| Jumping pulse position | (1) | (2) | (1) | (2) |
| Phase ψ | x | x | −x | −x |
| Amplitude factor | ||||
| (ω1) 13C, 15N | − | + | − | + |
| 12C, 14N | + | + | + | + |
| (ω2) 15N | − | − | + | + |
| 12/13C, 14N | + | + | + | + |
| Overall amplitude factor | ||||
| 12C, 14N (ω1) −12/13C, 14N (ω2) | + | + | + | + |
| 13C, 15N (ω1) −15N (ω2) | + | − | − | + |
| 13C, 15N (ω1) −12/13C, 14N (ω2) | − | + | − | + |
| 12C, 14N (ω1) −15N (ω2) | − | − | + | + |
Table 2.
NOEs observed in the four subspectra that result from linear combinations of the four different FIDs recorded
| Subspectrum | Linear combination of FIDs | NOEs involving protons bound to |
NOEs observed |
||
|---|---|---|---|---|---|
| ω1 | ω2 | G–U | A–U | ||
| I | a + b + c + d | 12C, 14N | 12/13C, 14N | 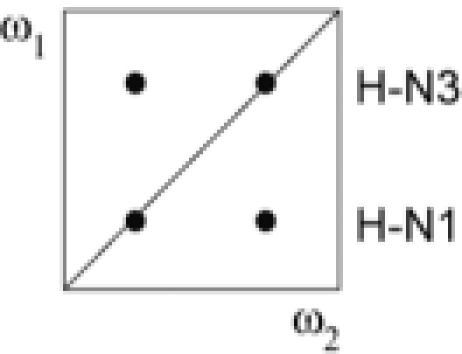 |
 |
| II | a − b − c + d | 13C, 15N | 15N | 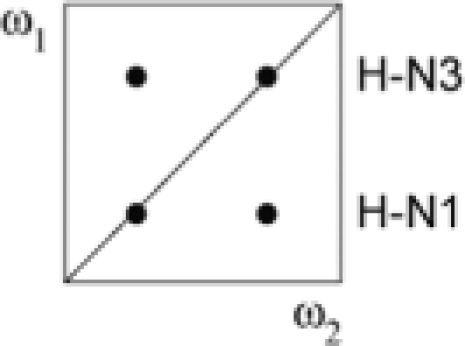 |
 |
| III | a − b + c − d | 13C, 15N | 12/13C, 14N | 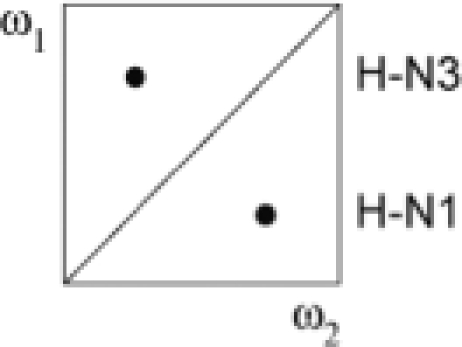 |
 |
| IV | a + b − c − d | 12C, 14N | 15N | 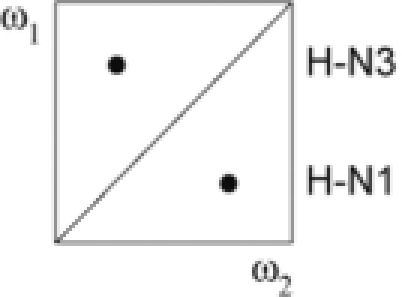 |
 |
Spectra were processed with NMRPipe (22) and analyzed using NMRVIEW (23). Imino protons were assigned with a combination of HNN-COSY (15) and a sequential walk in 2D NOESY spectra (300 ms mixing time) (24) (Duszczyk et al., in preparation). All pulse sequences use the WATERGATE sequence (25) and water flipback (26) for water suppression.
Quantitative analysis of HNN-COSY
A description of the magnetization transfer in the HNN-COSY pulse sequence is given in the Supplementary Material. The HNN-COSY spectrum shows cross and diagonal peaks at the chemical shifts of the 15N1 and 15N3 nuclei for each G–C, A–U, and some non-canonical base pairs. If both hydrogen bond acceptor and donor are isotope labeled, intensities of cross and diagonal peaks are proportional to sin2(πh2JNNT) and cos2(πh2JNNT) respectively.
Values of h2JNN coupling constants were calculated from Icross/Idiagonal extracted from the spectra recorded on the fully labeled RNA samples with:
Icross/Idiagonal was determined as the amplitude ratio of the time domain oscillations using the time domain fitting routine nlinLS contained in the NMRPipe package (15,22). Errors in the intensity ratio and couplings were calculated based on the effect of random noise for the peak height estimated by nlinLS. No correction for an underestimation of 10–20% due to the finite excitation bandwidth of the 15N radio frequency pulses (15) was made.
Discrimination between intra- and intermolecular hydrogen bonds can be accomplished by comparing the relative intensities of cross and diagonal peaks in HNN-COSY spectra of a fully labeled and 50% labeled, 50% unlabeled RNA sample. If the RNA forms monomeric hairpins, the relative intensities of the diagonal and crosspeaks (Idiagonal/Icross) will be equal in both samples, apart from an overall 50% loss of intensity as only the 50% labeled molecules contribute to the signal. In the case of duplex formation Idiagonal/Icross will increase as 50% of the RNA population of which one strand is labeled and the other unlabeled will only contribute to the diagonal peak intensity but not to the cross peak intensity.
The 1H and 15N chemical shifts of corresponding positions in hairpin and duplex conformations are usually degenerate. Therefore, if the interconversion between monomer and dimer species is either fast or slow on the time scale of the h2JNN couplings and if there is no significant population of a non-hydrogen bonded form, molar fractions in a mixed population of monomers and dimers can be derived from the intensity ratio of cross and diagonal peaks in a 50% labeled, 50% unlabeled sample. The requirements are: (i) corresponding h2JNN coupling constants are similar in the hairpin and duplex conformations; (ii) the size of the h2JNN couplings is known (for example from measurements on a 100% labeled sample) and (iii) transverse 15N T2 relaxation times of the monomer and dimer species are known. Then, the molar fractions of the hairpin (χmonomer) and that of the duplex conformations (χduplex = 1–χmonomer) in a 50% labeled, 50% unlabeled sample contribute to the intensities of diagonal and cross peaks as follows:
Note, that the transverse 15N relaxation has only a very small effect on Idiagonal/Icross. Moreover, in the case of a fully dimeric or fully monomeric conformation Idiagonal/Icross does not depend on the transverse relaxation time at all.
RESULTS AND DISCUSSION
Xist RNA A-repeat 26-mer assignment
Assignment of RNA usually starts with confirmation of the secondary structure by identifying Watson–Crick base pairs in A-form helical regions. In long mixing time NOESY spectra in H2O these cause a characteristic pattern of inter-base NOEs within base pairs and between consecutive stacked base pairs. With the latter a so-called ‘sequential walk’ through the stem is possible. Sequence specific assignment of the imino protons is facilitated with the HNN-COSY experiment where the imino proton shifts are correlated with base-specific chemical shifts of the nitrogens in the base pairs.
After recording these two experiments on our Xist 26-mer sample, imino assignment could be almost completed. However, we noticed an unusual downfield shifted signal, which did not show any imino–imino NOEs in the NOESY. In the HNN-COSY experiment this imino was correlated to a uridine N3 nitrogen and to a nitrogen at ∼222 p.p.m., indicative of either adenine N1, N3 or purine N7 nitrogens (27). A correlation to adenine N1 would correspond to a canonical A–U base pair, but such a base pair was not expected in the predicted 26-mer double hairpin. We considered two possibilities: either that this imino was involved in a non-canonical base contact in the second predicted loop, or that it was involved in an intermolecular base pair in a duplex species, although native gel analysis of the 26-mer A-repeat RNA suggested a homogenous monomeric population (Supplementary Figure 2).
Quantification of HNN-COSY
To rule out that our Xist samples are dimerizing under NMR conditions, we used the approach based on the quantitative HNN-COSY experiment (Figure 4). The HNN-COSY spectrum recorded on a 100% 15N-labeled sample of the 26-mer is shown in Figure 4C. Figure 4D shows slices through the maxima of cross- and diagonal peaks for two base pairs (G2–C13 in the first predicted stem and the base pair involving the U20 imino) from HNN-COSY spectra recorded on a fully labeled (blue) and 50% labeled, 50% unlabeled (green) 26-mer RNA. Corresponding spectra were recorded on a shorter 14-mer Xist RNA sample containing only the first predicted hairpin (Figure 1D) to compare measurements in the first hairpin within the 26-mer sample to the ones in a small and stable hairpin that provided superior spectral quality (data not shown). Only non-overlapped signals were used to measure intensities. All base pairs in the 14-mer could be analyzed except G1-C14, which is not visible presumably due to end-fraying. Measured intensities for diagonal and cross peaks for the base pairs in the 14-mer and the 26-mer are given in Table 3. It is clear that for the 14-mer Xist RNA Idiagonal/Icross ratios are comparable within error for the 100% labeled sample and the 50% labeled, 50% unlabeled sample. This confirms a monomeric state of the 14-mer hairpin. The non-overlapped signals in the 26-mer show different results for base pairs from the first and second predicted hairpin. For G2–C13, G12–C3 and G4–C11 no significant difference between Idiagonal/Icross is seen between the two samples. In contrast, for the base pair involving the U20 imino proton, Idiagonal/Icross increases four-fold in the 50% labeled, 50% unlabeled sample. This unambiguously shows that U20 is involved in an intermolecular base pair. The most probable partner in this intermolecular base pair is A21 in a second 26-mer molecule. Thus, A20-U21 is indeed a canonical Watson–Crick base pair, however, from an unexpected duplex RNA species. Although Idiagonal/Icross for the G18–C23, G10–C5 and G25–C16 base pairs could not be analyzed quantitatively due to spectral overlap, the signals involving G18–C23 and G25–C16 in the second predicted hairpin show a significant decrease in cross peak intensity in the 50% labeled sample (data not shown), consistent with intermolecular base pairs in the second predicted hairpin.
Figure 4.

Secondary structure assignment of the Xist RNA A-repeat (A) G–C, A–U and G–U base pairs with magnetization transfer in the HNN-COSY. (B) The predicted structure of the 26-mer A-repeat construct with sequential imino–imino NOE and HNN transfers as dotted and solid lines respectively, in magenta for the first predicted hairpin, in green for the second one (C, Top/middle) 600 MHz 1H,15N HNN-COSY spectrum recorded on a 100% 13C15N labeled sample in 95:5 H2O:D2O at 278 K. (Top) Intra-base imino-N1 correlations leading to diagonal peaks for the guanosines in the stem are shown in black and are connected by solid lines to the inter-base imino-N3 cross peak correlations of the cytosines they are base paired to. (Middle) The correlation for the A–U base pair is shown. (Bottom) A 2D 1H NOESY spectrum, recorded on an unlabeled sample in H2O under the same conditions, connects the iminos by a sequential walk through the stem as indicated by a dotted line. Connectivities for the first predicted stem are shown in magenta, for the second predicted stem in green as shown in (B). Signals arising from the U20 imino proton are boxed in magenta. (D) Diagonal and cross peak intensities in a fully labeled (blue) and 50% labeled, 50% unlabeled (green) Xist A-repeat 26-mer sample are compared for the intramolecular base pair G2-C13 (boxed in black) and the intermolecular base pair U20-A21 (boxed in magenta). The spectra have been normalized with respect to the diagonal peak height, as experimental times of the spectra recorded on the fully labeled and 50% labeled samples were different.
Table 3.
Experimental ratios between diagonal and cross peak intensities extracted from HNN-COSY spectra of fully labeled and 50% labeled, 50% unlabeled—Panel A: Xist RNA A-repeat 14-mer and Panel B: Xist RNA A-repeat 26-mer with calculated J-couplings for each base pair
| Base pair | Idiagonal/Icross, 100% labeled 1.2 mM | h2JNN coupling | Idiagonal/Icross, 50% labeled 50% unlabeled 1.2 mM each |
|---|---|---|---|
| Panel A: 14-mer | |||
| C5-G10 | 1.6 ± 0.1 | 5.3 ± 0.1 | 1.7 ± 0.1 |
| G4-C11 | 1.4 ± 0.1 | 5.6 ± 0.1 | 1.3 ± 0.1 |
| C3-G12 | 1.4 ± 0.1 | 5.6 ± 0.1 | 1.4 ± 0.1 |
| G2-C13 | 1.9 ± 0.1 | 5.0 ± 0.1 | 1.8 ± 0.1 |
| Base pair | Idiagonal/Icross, 100% labeled 0.8 mM | h2JNN coupling | Idiagonal/Icross, 50% labeled 50% unlabeled 0.8 mM each/0.4 mM each |
|---|---|---|---|
| Panel B: 26-mer | |||
| C5-G10 | ovl. | ND | ovl. |
| G4-C11 | 1.6 ± 0.1 | 5.4 ± 0.1 | 1.3 ± 0.1/1.3 ± 0.1 |
| C3-G12 | 1.4 ± 0.1 | 5.6 ± 0.1 | 1.8 ± 0.1/1.7 ± 0.1 |
| G2-C13 | 1.9 ± 0.1 | 5.0 ± 0.1 | 1.7 ± 0.1/1.4 ± 0.1 |
| C16-G25 | ovl. | ND | ovl. |
| G18-C23 | ovl. | ND | ovl. |
| U20-A21 | 2.0 ± 0.1 | 4.9 ± 0.1 | 8.5 ± 1/noise |
For the 26-mer calculated Idiagonal/Icross values are given for spectra recorded on samples with a total RNA concentration of 1.6 mM and 0.8 mM. Intensities that could not be analyzed because of overlap are labeled with ‘ovl’ for ‘overlapped’ and their calculated 2JNN couplings are labeled with ‘ND’ for ‘not determined’. Idiagonal/Icross for U20-A21 could not be determined for the sample with 0.4 mM labeled and unlabeled 26-mer each as the cross peak intensity was in the noise level. Errors in the intensity ratios and couplings were calculated based on the effect of random noise for the peak height estimated by the time-domain fitting routine nlinLS contained in the NMRPipe package.
Calculation of h2JNN coupling constants from a 100% isotope labeled RNA yielded values between 4.9 and 5.6 Hz (Table 3), which are at the lower end of the range of reported values of 6–7 Hz for Watson–Crick base pairs (15,28,29). Repetition of the experiment on a different spectrometer and with different transfer times for the N–N transfer resulted in the same range of couplings. Smaller couplings are usually observed in nonlinear H-bond geometries or due to fraying at the interfaces with non-regular secondary structure elements (30). Presumably, apart from a potential underestimation of the couplings due to imperfections of the 15N radio frequency pulses, the size of the couplings in our system is reduced by fraying and/or other conformational dynamics in the small hairpins investigated.
Figure 5 shows the correlation of Idiagonal/Icross with the transfer time for full monomeric and full duplex conformations, as well as for the case where only 90% of the sample is either monomeric or dimeric. Transverse 15N T2 relaxation times were estimated to be 50 ms for the dimer and 70 ms for the monomer based on reported values for RNAs of similar size (31) and considering that the experiments were recorded at 5°C. For a transfer time T of 40 ms and a h2JNN coupling of 5 Hz Idiagonal/Icross is calculated to be 7.6 for a pure duplex and 1.9 for a pure hairpin conformation. Thus, a four-fold increase in the ratio is expected for a full duplex species upon mixing with unlabeled RNA. If a mixed population exists, the Idiagonal/Icross ratios shift closer together. Variations in the 15N T2 relaxation times also lead to an increase/decrease of Idiagonal/Icross for monomer/dimer species, but the effects are negligible (data not shown). By comparing the experimentally measured Idiagonal/Icross values with the simulated curves it is clear that all base pairs in the first hairpin of the 26-mer A-repeat RNA are consistent with a fully monomeric conformation, while the A–U base pair in the second predicted hairpin exists in a fully dimeric form.
Figure 5.

Expected ratio of diagonal and cross peak intensities (Idiagonal/Icross) as a function of the transfer time T in the HNN-COSY experiment for duplex (magenta) and monomer (green) conformations in a 50% labeled, 50% unlabeled sample, calculated for h2JNN = 5/5.5 Hz (thin/thick lines) and 15N T2 relaxation times of 70 and 50 ms for the monomer and dimer, respectively. Curves for fully monomeric and dimeric species are shown as lines, mixed populations (90% monomer/10% dimer and vice versa) are shown as dotted lines. Experimentally measured intensity ratios on the 26-mer RNA are indicated as squares with error bars based on random noise in the spectra. The trans-hydrogen bond coupling for the U20–A21 base pair is h2JNN = 4.9 Hz, while the couplings for the G–C base pairs are 5.0–5.5 Hz.
With an A-U base pair originating from a dimeric conformation two possibilities exist for the A-repeat topology. Dimerization could involve a kissing hairpin with two equivalent intermolecular A–U base pairs (Figure 6B), or correspond to a duplex conformation with full base pairing with the second part of another A-repeat (Figure 6C). To distinguish between these two conformations information on the state of the G–U base pair in the second predicted stem would be useful. In a kissing hairpin complex this base pair would be intramolecular while in a duplex this base pair would be intermolecular. Unfortunately, the analysis of J-couplings across hydrogen bonds is not applicable to G–U base pairs due to a lack of sizable J-couplings (Figure 4A).
Figure 6.

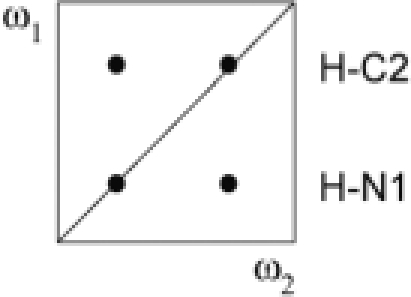
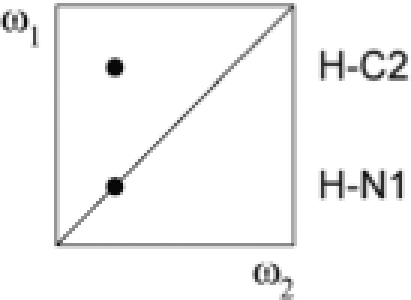
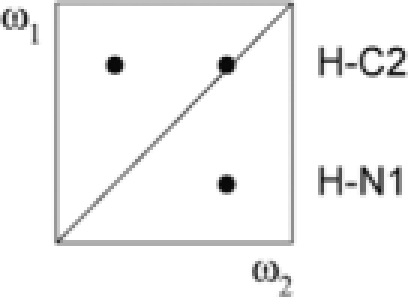
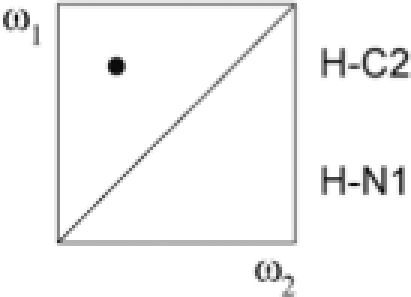
(A–C) Secondary structure of the Xist RNA A-repeat: (A) Stem-loop conformation, (B) kissing hairpin and (C) dimerization of the second predicted hairpin. Our results show that the conformation of the 26-mer corresponds to the form shown in (C). (D) Doubly-filtered and doubly-edited subspectra and (E) edited/filtered subspectra derived from the double filtered NOESY. In (E) NOEs between pairs of protons where one is attached to an isotope labeled heteroatom and the other one to an unlabeled one are observed. These NOEs can only originate from a duplex RNA species. The corresponding NOE transfers are indicated schematically for G–U and A–U base pairs in D and E, respectively. Zoomed-in views of the NOEs involving the intermolecular G17–U24 and U20–A21 base pairs are shown.
Analysis of the double-isotope-filtered NOESY spectra
As a characteristic and strong NOE pattern is visible between the G and U imino protons in a G-U base pair we analyzed the 50% labeled, 50% unlabeled sample following the approach first proposed by Aboul-ela et al. (14) based on NOEs in base pairs with optimizations and extensions as described in the Materials and Methods section.
Linear combinations of the four FIDs a–d (Table 1) recorded in the double-filtered NOESY experiment yield four NOESY subspectra I–IV (Table 2). The imino-amino regions of these four spectra are shown in Figure 6D and E. In Figure 6D the spectra with NOEs between the unlabeled protons (spectrum I in black) and NOEs between the labeled protons (spectrum II in red) are superimposed. In Figure 6E the two spectra with NOEs between labeled and unlabeled protons are shown. These NOEs can only originate from a duplex RNA species. NMR signals of special interest are highlighted: the U20 imino to A21 H2 cross peaks, and the two imino–imino NOEs in the G17–U24 base pair. The latter demonstrate that not only U20–A21, but also the G17–U24 base pair in the second predicted stem of the 26-mer Xist construct is intermolecular. For the G1–U14 base pair in the first stem no imino–imino cross peaks are seen in Figure 6E, which confirms that the first predicted hairpin is intramolecular. The intensities of the imino to imino NOEs in the G–U base pair are symmetrical in spectra III and IV (considering that spin-diffusion in the long mixing time NOESY can differentially effect the peak intensities of the symmetric cross peaks). In contrast, the imino-H2 NOEs in the A–U base pair are only symmetric in spectrum III since the 13C filter is applied only in ω1. This asymmetric NOE pattern is only consistent for an intermolecular NOE involving an imino proton and a proton attached to carbon, which independently confirms that these NOEs correspond to an A-U base pair.
The architecture of the Xist RNA-repeat
The combined data from the HNN-COSY and double-isotope-filtered NOESY experiments are in agreement with an architecture of the A-repeats as shown in Figure 6C with a fully dimerized second stem. The fact that the imino–imino NOEs for the G17–U24 base pair in the spectra shown in Figure 6D and E have comparable intensities indicates that the 26-mer RNA exists in a fully dimeric form in solution. If an equilibrium would exist between the kissing hairpin and duplex forms shown in Figure 6B and C, the G-U imino–imino NOEs in Figure 6E should have lower intensities than those in Figure 6D.
The question remains if the dimerization seen in vitro under NMR conditions is significant in vivo, or if it is merely an artifact of the high concentrations used in the experimental conditions. In this respect, we note that the imino signal of U20, which is involved in the intermolecular basepair, is visible in 1D NMR spectra even at concentrations as low as 50 µM. In addition, analytical ultracentrifugation data of a 0.1 mM sample show that the A-repeat 26-mer exists as a dimer in solution (Duszczyk et al., in preparation). It should also be considered that in vivo there is a high local concentration of the A-repeats as they are connected by relatively short linkers and are localized to the X chromosome. Thus, it is possible that the second region of the A-repeat may function as a multimerization platform for several A-repeats, either within a single Xist RNA molecule, or between different ones. Further experiments to address these issues are underway.
CONCLUSION
We developed and applied a novel approach to unambiguously define the stoichiometry of the NMR sample for the structural analysis of a Xist RNA A-repeat. Using a combination of quantitative HNN-COSY and a novel double isotope-filtered NOESY experiment we could define the conformation of the 26-mer A-repeat RNA. We show that in a single 26-mer A-repeat only the first predicted hairpin is formed, while the second predicted stem-loop forms a RNA duplex and mediates dimerization of the 26-mer A-repeat. Our strategy will be generally applicable to identify and quantify populations of hairpin and duplex conformations in RNAs and to define RNA folding topology from inter- and intra-molecular base-pairing patterns.
SUPPLEMENTARY DATA
Supplementary data are available at NAR Online.
FUNDING
‘E-STAR’ fellowship funded by the EC's FP6 Marie Curie Host fellowship for Early Stage Research Training (contract MEST-CT-2004-504640 to M.M.D.); EU STREP FSG-V-RNA (contract LSHG-CT-2004-503455). Funding for open access charge: Helmholtz Zentrum München, Central Library.
Conflict of interest statement. None declared.
Supplementary Material
ACKNOWLEDGEMENTS
We thank Bernd Simon for help with NMR experiments and Stephan Grzesiek for assistance with the nlinLS analysis.
REFERENCES
- 1.Penny GD, Kay GF, Sheardown SA, Rastan S, Brockdorff N. Requirement for Xist in X chromosome inactivation. Nature. 1996;379:131–137. doi: 10.1038/379131a0. [DOI] [PubMed] [Google Scholar]
- 2.Sheardown SA, Duthie SM, Johnston CM, Newall AE, Formstone EJ, Arkell RM, Nesterova TB, Alghisi GC, Rastan S, Brockdorff N. Stabilization of Xist RNA mediates initiation of X chromosome inactivation. Cell. 1997;91:99–107. doi: 10.1016/s0092-8674(01)80012-x. [DOI] [PubMed] [Google Scholar]
- 3.Wutz A, Rasmussen TP, Jaenisch R. Chromosomal silencing and localization are mediated by different domains of Xist RNA. Nat. Genet. 2002;30:167–174. doi: 10.1038/ng820. [DOI] [PubMed] [Google Scholar]
- 4.Wüthrich K. NMR of Proteins and Nucleic Acids. New York: Wiley; 1986. [Google Scholar]
- 5.Varani G, Aboul-ela F, Allain FH-T. NMR investigation of RNA structure. Progr. NMR Spectrosc. 1996;29:51–127. [Google Scholar]
- 6.Wijmenga S, van Buuren B. The use of NMR methods for conformational studies of nucleic acids. Prog. Nucl. Magn. Reson. Spectrosc. 1998;32:287–387. [Google Scholar]
- 7.Fürtig B, Richter C, Wöhnert J, Schwalbe H. NMR spectroscopy of RNA. Chembiochem. 2003;4:936–962. doi: 10.1002/cbic.200300700. [DOI] [PubMed] [Google Scholar]
- 8.Latham MP, Brown DJ, McCallum SA, Pardi A. NMR methods for studying the structure and dynamics of RNA. Chembiochem. 2005;6:1492–1505. doi: 10.1002/cbic.200500123. [DOI] [PubMed] [Google Scholar]
- 9.Marky LA, Breslauer KJ. Calculating thermodynamic data for transitions of any molecularity from equilibrium melting curves. Biopolymers. 1987;26:1601–1620. doi: 10.1002/bip.360260911. [DOI] [PubMed] [Google Scholar]
- 10.Lapham J, Rife JP, Moore PB, Crothers DM. Measurement of diffusion constants for nucleic acids by NMR. J. Biomol. NMR. 1997;10:255–262. doi: 10.1023/a:1018310702909. [DOI] [PubMed] [Google Scholar]
- 11.Cabello-Villegas J, Nikonowicz EP. Discriminating duplex and hairpin oligonucleotides using chemical shifts: application to the anticodon stem-loop of Escherichia coli tRNAPhe. Nucleic Acids Res. 2000;28:e74. doi: 10.1093/nar/28.15.e74. [DOI] [PMC free article] [PubMed] [Google Scholar]
- 12.Zanier K. Ph.D. Thesis. 2001. Regulation of histone gene expression: solution structure determination by NMR of the 3′ histone mRNA hairpin and implications for specific protein-RNA recognition. [Google Scholar]
- 13.Sotoya H, Matsugami A, Ikeda T, Ouhashi K, Uesugi S, Katahira M. Method for direct discrimination of intra- and intermolecular hydrogen bonds, and characterization of the G(:A):G(:A):G(:A):G heptad, with scalar couplings across hydrogen bonds. Nucleic Acids Res. 2004;32:5113–5118. doi: 10.1093/nar/gkh849. [DOI] [PMC free article] [PubMed] [Google Scholar]
- 14.Aboul-ela F, Nikonowicz EP, Pardi A. Distinguishing between duplex and hairpin forms of RNA by 15N-1H heteronuclear NMR. FEBS Lett. 1994;347:261. doi: 10.1016/0014-5793(94)00564-8. [DOI] [PubMed] [Google Scholar]
- 15.Dingley AJ, Grzesiek S. Direct observation of hydrogen bonds in nucleic acid base pairs by internucleotide 2JNN couplings. J. Am. Chem. Soc. 1998;120:8293–8297. [Google Scholar]
- 16.Milligan JF, Uhlenbeck OC. Synthesis of small RNAs using T7 RNA-Polymerase. Methods Enzymol. 1989;180:51–62. doi: 10.1016/0076-6879(89)80091-6. [DOI] [PubMed] [Google Scholar]
- 17.Kao C, Zheng M, Ruedisser S. A simple and efficient method to reduce nontemplated nucleotide addition at the 3′ terminus of RNAs transcribed by T7 RNA polymerase. Journal Article. 2000;5:1268–1272. doi: 10.1017/s1355838299991033. [DOI] [PMC free article] [PubMed] [Google Scholar]
- 18.Grzesiek S, Bax A. Amino acid type determination in the sequential assignment procedure of uniformly 13C/15N-enriched proteins. J. Biomol. NMR. 1993;3:185–204. doi: 10.1007/BF00178261. [DOI] [PubMed] [Google Scholar]
- 19.Logan TM, Olejniczak ET, Xu RX, Fesik SW. A general method for assigning NMR spectra of denatured proteins using 3D HC(CO)NH-TOCSY triple resonance experiments. J. Biomol. NMR. 1993;3:225. doi: 10.1007/BF00178264. [DOI] [PubMed] [Google Scholar]
- 20.Sattler M, Schleucher J, Griesinger C. Heteronuclear multidimensional NMR experiments for the structure determination of proteins in solution employing pulsed field gradients. Prog. Nucl. Magn. Reson. Spectrosc. 1999;34:93–158. [Google Scholar]
- 21.Wörgötter E, Wagner G, Wüthrich K. Simplification of two-dimensional H-1-NMR spectra using an X-filter. J. Am. Chem. Soc. 1986;108:6162–6167. [Google Scholar]
- 22.Delaglio F, Grzesiek S, Vuister GW, Zhu G, Pfeifer J, Bax A. NMRPipe – A multidimensional spectral processing system based on Unix pipes. J. Biomol. NMR. 1995;6:277–293. doi: 10.1007/BF00197809. [DOI] [PubMed] [Google Scholar]
- 23.Johnson BA, Blevins RA. NMR View – A computer program for the visualization and analysis of NMR data. J. Biomol. NMR. 1994;4:603–614. doi: 10.1007/BF00404272. [DOI] [PubMed] [Google Scholar]
- 24.Kumar A, Ernst RR, Wüthrich K. A two-dimensional nuclear Overhauser enhancement (2D NOE) experiment for the elucidation of complete proton-proton cross-relaxation networks in biological macromolecules. Biochem. Biophys. Res. Commun. 1980;95:1. doi: 10.1016/0006-291x(80)90695-6. [DOI] [PubMed] [Google Scholar]
- 25.Piotto M, Saudek V, Sklenář V. Gradient-tailored excitation for single-quantum NMR spectroscopy of aqueous solutions. J. Biomol. NMR. 1992;2:661. doi: 10.1007/BF02192855. [DOI] [PubMed] [Google Scholar]
- 26.Grzesiek S, Bax A. The importance of not saturating H2O in protein NMR - application to sensitivity enhancement and NOE measurements. J. Am. Chem. Soc. 1993;115:12593–12594. [Google Scholar]
- 27.Sklenář V, Peterson RD, Rejante MR, Feigon J. Correlation of nucleotide base and sugar protons in a 15N-labeled HIV-1 RNA oligonucleotide by 1H-15N HSQC experiments. J. Biomol. NMR. 1994;4:117. doi: 10.1007/BF00178339. [DOI] [PubMed] [Google Scholar]
- 28.Wöhnert J, Dingley AJ, Stoldt M, Görlach M, Grzesiek S, Brown LR. Direct identification of NH … N hydrogen bonds in non-canonical base pairs of RNA by NMR spectroscopy. Nucleic Acids Res. 1999;27:3104–3110. doi: 10.1093/nar/27.15.3104. [DOI] [PMC free article] [PubMed] [Google Scholar]
- 29.Pervushin K, Ono A, Fernandez C, Szyperski T, Kainosho M, Wüthrich K. NMR scalar couplings across Watson-Crick base pair hydrogen bonds in DNA observed by transverse relaxation-optimized spectroscopy. Proc. Natl. Acad. Sci. USA. 1998;95:14147–14151. doi: 10.1073/pnas.95.24.14147. [DOI] [PMC free article] [PubMed] [Google Scholar]
- 30.Grzesiek S, Cordier F, Jaravine V, Barfield M. Insights into biomolecular hydrogen bonds from hydrogen bond scalar couplings. Prog. Nucl. Magn. Reson. Spectrosc. 2004;45:275. [Google Scholar]
- 31.Zhang Q, Stelzer AC, Fisher CK, Al-Hashimi HM. Visualizing spatially correlated dynamics that directs RNA conformational transitions. Nature. 2007;450:1263. doi: 10.1038/nature06389. [DOI] [PubMed] [Google Scholar]
Associated Data
This section collects any data citations, data availability statements, or supplementary materials included in this article.