

Abstract
Protein–protein interactions are critical to most biological processes, and locating protein–protein interfaces on protein structures is an important task in molecular biology. We developed a new experimental strategy called the ‘absence of interference’ approach to determine surface residues involved in protein–protein interaction of established yeast two-hybrid pairs of interacting proteins. One of the proteins is subjected to high-level randomization by error-prone PCR. The resulting library is selected by yeast two-hybrid system for interacting clones that are isolated and sequenced. The interaction region can be identified by an absence or depletion of mutations. For data analysis and presentation, we developed a Web interface that analyzes the mutational spectrum and displays the mutational frequency on the surface of the structure (or a structural model) of the randomized protein†. Additionally, this interface might be of use for the display of mutational distributions determined by other types of random mutagenesis experiments. We applied the approach to map the interface of the catalytic domain of the DNA methyltransferase Dnmt3a with its regulatory factor Dnmt3L. Dnmt3a was randomized with high mutational load. A total of 76 interacting clones were isolated and sequenced, and 648 mutations were identified. The mutational pattern allowed to identify a unique interaction region on the surface of Dnmt3a, which comprises about 500−600 Å2. The results were confirmed by site-directed mutagenesis and structural analysis. The absence-of-interference approach will allow high-throughput mapping of protein interaction sites suitable for functional studies and protein docking.
Keywords: protein–protein interaction, structure prediction, directed evolution, yeast two-hybrid, random mutagenesis
Introduction
It has been estimated that, on average, each cellular protein interacts with 10 partners.1,2 Protein–protein interactions are essential for the formation of cellular macromolecular structures and enzymatic complexes involved in regulation, signaling, and metabolic pathways.3 In addition, protein interaction sites are potentially important drug targets,4 because manipulation of protein–protein interaction will allow for a specific interference with cellular metabolism and regulation. Structural methods provide atomic resolution of the structure of protein complexes, but only a minority of the possible complex structures are available in the Protein Data Bank (PDB). For example, a search in the Protein Quaternary Structure database‡25 provided 51,382 entries, but only 9921 of them were complexes with interfaces larger than 400 Å2. Thus, while 10 times more complexes than protein structures would be expected, the number of protein complex structures is less than 20% of the number of protein structures, which leaves a wide gap. Docking of proteins with known structures is an attractive alternative to obtain models of protein complexes, which is becoming more powerful with the refinement of algorithms and growing computer power.6,7 However, the de novo prediction of interaction sites through docking remains difficult (in particular if conformational changes are taking place). The success rate of docking can be improved by experimental analysis of the interaction surface region by biochemical, genetic, or phylogenetic approaches, one example of which is presented here.
Biochemical methods for interaction surface mapping include various strategies of covalent cross-linking followed by mass spectrometric analysis of the modification pattern8 or synthesis of peptides on cellulose membranes and in vitro interaction analysis.9 However, these methods require purified proteins and are usually of low throughput. Genetic methods are often based on the yeast two-hybrid (Y2H) system,10,11 which makes use of the modular nature of transcription factors and provides a convenient assay for the study of protein–protein interactions occurring within eukaryotic cells. Such systems have been established for thousands of pairs of interacting proteins during various high-throughput projects aiming to identify protein–protein interaction networks by Y2H.12,13 The reverse Y2H system is a variation of Y2H that was developed to identify mutations that disrupt protein interactions to allow for mapping the interface.14 However, reverse Y2H also selects for random mutagenesis artifacts, and the selected missense mutations that prevent interaction might disrupt protein folding as well. Phylogenetic methods explore the variability within multiple sequence alignments to define evolutionary conserved surface spots, which often coincide with protein–protein interaction sites.15,16 However, these methods suffer from the generality of the information obtained from natural evolution, where all influences on the functionality of a protein (such as ligand binding, folding, stability, enzymatic activity, etc.) are integrated into one evolutionary parameter, namely, the conservation of certain residues, which is read out in multiple sequence alignments. Furthermore, the number of sequences available for such analysis and their sequence divergence are often limited.
We developed a new approach for positive display of protein–protein interaction sites on the surface of proteins called ‘absence of interference.’ The approach was applied for mapping the interface of the catalytic domain of the DNA methyltransferase Dnmt3a (CD-Dnmt3a) and its regulatory factor Dnmt3L. DNA methylation is an important epigenetic signal that silences gene expression. In mammals, it has a variety of important functions including control of gene expression, cellular differentiation and development, preservation of chromosomal integrity, parental imprinting, and X-chromosome inactivation.17,18 The DNA methyltransferase Dnmt3a is responsible for de novo methylation of DNA.19 Its isolated C-terminal catalytic domain is active20,21 and becomes catalytically stimulated by interaction with Dnmt3L,22,23 which acts as a regulatory factor involved in gametogenesis.24,25
Results
The absence-of-interference approach for mapping of protein–protein interaction sites on the surface of proteins is based on directed evolution (i.e., the combination of random mutagenesis and selection)26,27 (Fig. 1). It aims to accelerate natural evolution and generate sufficient amount of protein variants to localize protein–protein interaction sites on the surface of proteins. As a first step, a Y2H construct is prepared for the pair of proteins to be analyzed. If a structure or structural model is available for at least one of the proteins, this protein is subjected to high-level randomization and the library selected by Y2H for clones that still do interact. These clones are then isolated and sequenced. Since the amino acid exchanges observed in the selected clones did not interfere with protein–protein interaction, they provide a negative footprint of the interaction region, where mutations are excluded. In the last step, the distribution of mutations is analyzed and displayed on the surface of the structure or structural model of the protein. This step is supported by a Web interface presented here as well§.
Fig. 1.
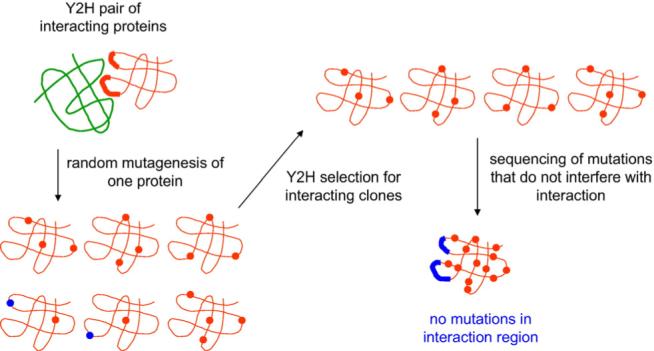
Principle of the absence-of-interference approach for structural mapping of protein–protein interaction surfaces. Amino acid exchanges that do not interfere with the interaction are shown as red dots, and mutations that disrupt the interaction are shown as blue dots.
Mapping the interface of Dnmt3a and Dnmt3L
We have employed the absence-of-interference approach to map the Dnmt3a/Dnmt3L interaction site on the surface of the catalytic domain of Dnmt3a. In agreement with published findings,23 we observed a strong interaction of CD-Dnmt3a and Dnmt3L in the Y2H system as indicated by the appearance of dark blue color in the β-galactosidase filter assay after less than 30 min (Fig. 2a). The Y2H signal of the interaction between CD-Dnmt3a and Dnmt3L was specific since both the protein constructs failed to interact with their corresponding partner's empty vector control (Fig. 2a). The interaction was unaffected by swapping the proteins between the vector systems (data not shown).
Fig. 2.
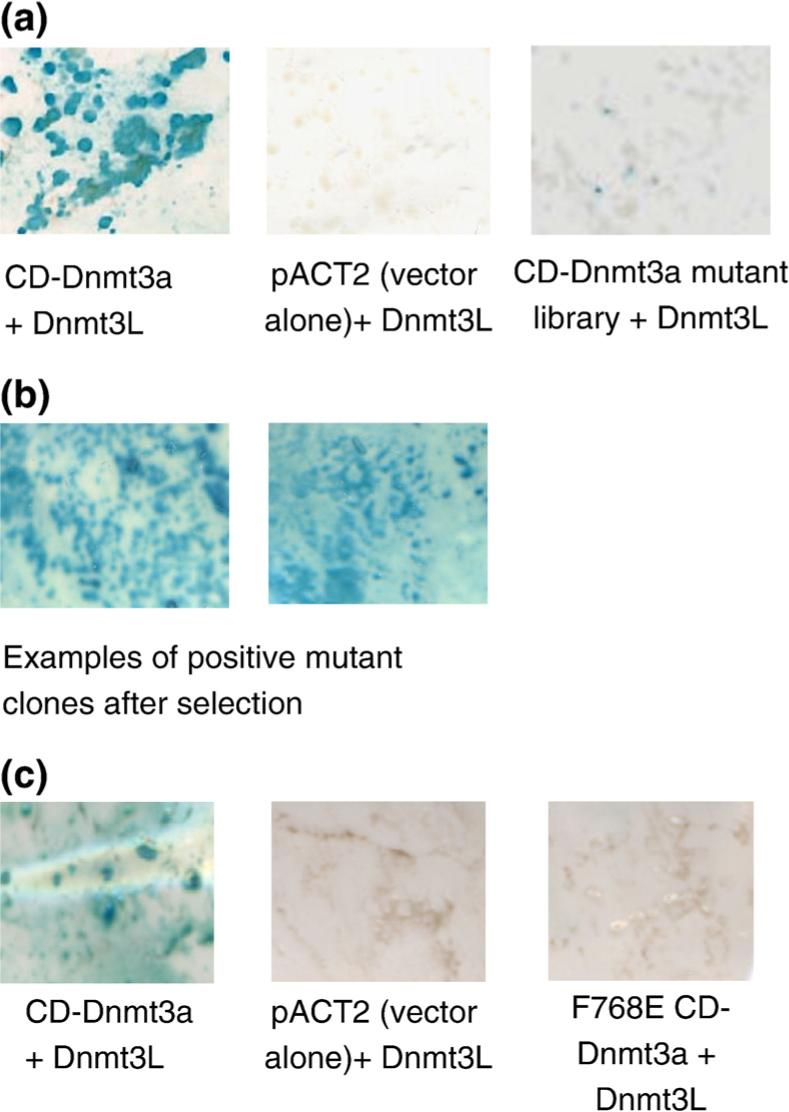
Y2H interaction analysis of wild-type CD-Dnmt3a and its variants with Dnmt3L. In the Y2H system, the CD-Dnmt3a/Dnmt3L interaction induces expression of HIS3 and lacZ reporter genes. HIS3 expression was tested by growing the yeast clones in a selective medium lacking histidine, and lacZ expression was analyzed by the β-galactosidase filter assay that is shown here. (a) Interaction of wild-type CD-Dnmt3a and Dnmt3L. All yeast colonies were positive in the β-galactosidase filter assay (indicating interaction of CD-Dnmt3a and Dnmt3L). Control experiments with the pACT2 vector and Dnmt3L did not show a β-galactosidase signal. Only a few clones were positive, that is, if the interaction of the CD-Dnmt3a random mutant library and Dnmt3L was tested. (b) Two examples of β-galactosidase filter assays performed with the interacting clones obtained after randomization and selection. (c) The CD-Dnmt3a F768E mutant disrupted the interaction with Dnmt3L as shown by the absence of β-galactosidase signal indicated by the absence of blue coloring.
Random mutagenesis of CD-Dnmt3a was performed by error-prone (ep) PCR.28 In total, 7500 colonies were pooled together for the preparation of a mutant library. Nine independent clones were sequenced to verify the mutational load and diversity. We found 194 mutations in 7180 sequenced bases (mutational frequency = 2.7%). The distribution of mutations was relatively equal (Table 1). The mutant library was probed for interaction with Dnmt3L in the Y2H system to assess the influence of the mutations introduced into CD-Dnmt3a. Of 300 colonies, 20 were positive for β-galactosidase reporter gene expression. This result indicates that only a small fraction of the mutant library (approximately 6%) was able to interact with wild-type Dnmt3L (Fig. 2a). The disruption of the CD-Dnmt3a/Dnmt3L interaction in most clones of the library was a prerequisite before proceeding to the next phase of the experiment and selecting those CD-Dnmt3a mutant clones that still interacted with Dnmt3L.
Table 1.
Mutational spectrum of CD-Dnmt3a after ep PCR before Y2H screening
| Exchange to |
||||
|---|---|---|---|---|
| Original base | A | T | C | G |
| A | NA | 15.4 | 5.6 | 13.4 |
| T | 18 | NA | 16.4 | 6.7 |
| C | 3.6 | 6.7 | NA | 0.5 |
| G | 8.7 | 2.5 | 2 | NA |
Values are expressed as percentages. NA, not applicable.
The mutant library of CD-Dnmt3a was allowed to interact with wild-type Dnmt3L in the Y2H system, and the interaction-positive clones were selected on the basis of their histidine reporter gene expression. In total, 76 such positive mutant clones were picked and counterchecked for the β-galactosidase expression as an independent readout of the Y2H interaction assay to eliminate false positives, if any. All the selected clones were found to be positive for β-galactosidase expression. We retrieved the CD-Dnmt3a plasmids from 20 positive mutant clones and reconfirmed the interaction of each mutant plasmid (Fig. 2b). An additional 56 interacting CD-Dnmt3a mutant clones were retrieved by colony PCR. In total, sequencing of the 76 selected CD-Dnmt3a genes revealed 648 mutations. The selection pressure for interacting clones in our system was manifested by the reduction of the overall mutational load from 2.7% in the unselected library to 1.0% after selection. In addition, the distribution of mutations changed: before selection, many insertions, deletions, and stop-codon mutations were observed throughout the protein, which led to frame shifting and/or premature termination of translation and, thereby, inactivation of the protein. In contrast, after selection, stop codons were observed only after amino acid position 801 of CD-Dnmt3a. We therefore conclude that the N-terminal part of the CD-Dnmt3a protein domain (amino acids 630−800 of full length Dnmt3a) is sufficient for the interaction with Dnmt3L.
Data analysis and presentation
To analyze and evaluate the distribution of mutations observed in interacting CD-Dnmt3a clones, we loaded all sequencing results into one multiple sequence alignment. As a consequence of the experimental approach, in this alignment, the conservation at each amino acid position is high, because only a few mutations are observed at each site. Since conventional programs that display sequence conservation in the structure of proteins are developed to deal with conservation levels as observed in alignments of related proteins, they are not applicable for our approach. Therefore, a Web interface called Prima (Protein Interaction Mapper) was developed to display the identified mutations on the surface of the target protein∥ (Fig. 3). Prima allows uploading of structure files and alignments in standard data formats: multiple sequence alignments are read in FASTA format, and the protein model should be provided in the PDB format. Prima permits to classify an amino position as variable even if a mutation is observed in only one mutant clone. Alternatively, the program displays the model colored by the mutational density at each residue according to parameters defined by the user. Links to the alignment file containing all sequences of the selected clones and to the structural model file of CD-Dnmt3a29 are given on the help site of the Prima program. As an output, the Prima program provides a PDB file, in which the mutational load is encoded in the B-factor field of the structural coordinates, such that it can be displayed in any structure visualization program. We believe that this program could be of use also for the analysis of mutational distributions determined in other experimental approaches involving random mutagenesis.
Fig. 3.
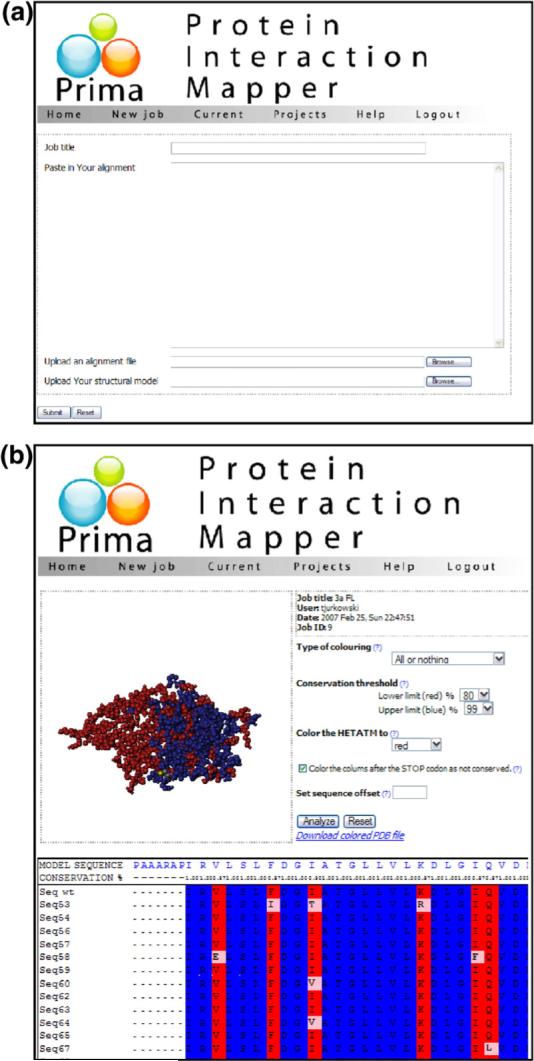
Screenshots taken from the Prima Web interface for the display of mutations identified in an absence-of-interference experiment on the surface of the target protein structure. (a) Data submission page. (b) Screenshot of the program after submission of a structure and alignment file.
Display of the mutational frequency on the surface of CD-Dnmt3a
Using the Prima interface, we mapped the 194 mutations on the surface of a CD-Dnmt3a model29 (Fig. 4). Mutations identified in interacting clones and the protein part of the C-terminal to residue 801 are colored red, because the C-terminal part of CD-Dnmt3a is not involved in the interaction with Dnmt3L as shown by the presence of stop codons at position 802 in some of the interacting clones. As shown in Fig. 4a, the largest mutation-free surface patch of CD-Dnmt3a comprises approximately 500−600 Å2. This region is much larger than any other mutation-free surface spot observed (e.g., the size of the second largest surface region was only about 150 Å2). The presumptive Dnmt3L interaction site is distinctively different from the cofactor binding pocket and the DNA binding site of the enzyme.
Fig. 4.

Display of conserved surface regions on a structural model29 of CD-Dnmt3a. (a) Different views of the structural model of CD-Dnmt3a in complex with DNA. Mutations that did not disrupt interaction with Dnmt3L and the C-terminal part of the protein (that is not important for interaction) are colored red. The single large surface region free of mutations that is highlighted by a green circle indicates the putative interacting region. (b) Surface of the structural model of CD-Dnmt3a colored as shown in (a). The yellow area indicates the position of residues whose exchange disrupted the interaction of CD-Dnmt3a with Dnmt3L. (c) Structure of the CD-Dnmt3a in complex with CD-Dnmt3L.30 Coloring of CD-Dnmt3a is the same as in (b). CD-Dnmt3L is shown as a green ribbon model.
Verification of the mapped interface
Interface residues were exchanged by site-directed mutagenesis in order to verify the mapped putative interface region of CD-Dnmt3a with Dnmt3L (Fig. 4b). The CD-Dnmt3a F768E mutant gene was constructed, and it was shown that the corresponding mutant protein fails to interact with Dnmt3L in Y2H (Fig. 2c). In addition, F728E had been identified independently to disrupt the CD-Dnmt3a/Dnmt3L interface.30 After the experiments described here were finished, the structure of CD-Dnmt3a in complex with the C-terminal fragment of Dnmt3L became available.30 As shown in Fig. 4c, the interface region mapped by absence of interference almost perfectly coincides with the interface observed in the X-ray structure, which confirms the practicability of the absence-of-interference approach for mapping protein–protein interfaces.
Discussion
Determining the interfaces of interacting proteins is an important task in structural biology. We introduce here the absence-of-interference approach as an experimental strategy for rapid structural mapping of protein–protein interaction surfaces. The approach is based on random mutagenesis, Y2H selection, and DNA sequencing. One of its advantages is that the essential interaction analysis takes place in vivo. The procedure requires only standard lab equipment and inexpensive reagents. In addition, we provide a Web platform for convenient and rapid data analysis and presentation of absence-of-interference experiments, which could be useful for data presentation of other random mutagenesis experiments as well.
Since the absence-of-interference approach starts with a well-characterized Y2H interaction pair and its goal is to retain this interaction, there is a low risk of obtaining false-positive interactions. One possible source of false-positive signals is if the corresponding empty vector of the randomized protein construct interacted with the partner fusion protein. Therefore, nonappearance of such an interaction signal has to be confirmed prior to performing an absence-of-interference study. We observed with some published Y2H pairs that there was a weak Y2H signal also with the empty vector. Most of the time, this signal was much weaker than the interaction signal of the proteins, but it was strong enough to invalidate this Y2H pair for our approach. Another important restriction is that the interface must not be bipartite, because, then, mutations might appear in one part while the other part still supports the Y2H interaction. In order to avoid this situation, we have used the isolated catalytic domain of Dnmt3a for our experiments.
Since the experimental steps necessary for mapping a protein–protein interface by absence of interference are prone to automation, a high-throughput analysis of a large number of interacting protein pairs is possible using this strategy. This method has several important applications: (a) Identification of protein interaction sites approach will help with the functional and structural characterizations of multiprotein complexes. (b) Knowledge of interface regions will allow to decide whether a target protein could interact with different partners simultaneously, which adds additional information to genome-wide protein–protein interaction maps.31 (c) Identification of interaction sites can assist the docking of proteins of known structures to derive structural models of protein complexes. (d) Surface cavities at mapped interaction sites could be employed for drug development.
Currently, sequencing technology is developing rapidly,32 and reading length of deep sequencing methods is expected to increase. Under such circumstances, we foresee an even more simplified and rapid setup of the absence-of-interference interaction region mapping, because after random mutagenesis and selection, the whole pool of interacting variants could be subjected to deep sequencing without subcloning. One single deep sequencing run would identify thousands of mutations and should identify the interaction region precisely.
Materials and Methods
Plasmid constructs
Murine CD-Dnmt3a (amino acid residues 630−908 of National Center for Biotechnology Information entry o88508) was cloned in pACT2 (Clontech) as a fusion protein with Gal4 activation domain and served as prey construct (pAC3a). Human Dnmt3L (National Center for Biotechnology Information entry BAA95556) was cloned in pBTM117.c.1 as a fusion protein with the LexA DNA binding domain and used as bait (pB3L). Both constructs were obtained from Prof. H. Leonhardt (Ludwig-Maximilians-Universität Munich, Germany).23
Y2H assays
Yeast strain L40 [MATahis3 Δ200trp1−901 leu2−3112 ade2 LYS2::(4lexAop-HIS3) URA3::(8lexAop-lacZ) GAL4, Invitrogen] was transformed with the corresponding plasmids to leucine and tryptophan auxotrophy. If the protein partners cloned in two different vectors interact with each other, they reconstitute the active transcription factor, which drives the expression of the HIS3 and lacZ reporter genes. The HIS3 expression was tested by growing the transformants in a selective medium lacking histidine (minimal SD base medium with added -His/-Leu/-Trp DO supplement, Clontech). The lacZ expression was analyzed by β-galactosidase filter assay.33 Positive interactions were confirmed by the growth of the transformants at 30 °C in a selective medium lacking histidine, as well as by the appearance of dark blue color in the β-galactosidase filter assay. Negative controls were carried out with each construct cotransformed with the other appropriate empty vector.
Generation of a random mutant library
Random mutagenesis of CD-Dnmt3a in pACT2 was performed using ep PCR28 by employing biased nucleotide composition of the PCR buffer and high Mg2+ and by the addition of Mn2+. In order to get a high mutational load, we used 1 pg of template DNA and carried out 35 cycles of ep PCR reaction. The ep PCR reaction mixture (50 μl) contained 10 mM Tris–HCl, 50 mM KCl, 7 mM MgCl2, 0.5 mM MnCl2, 0.2 mM each of deoxyadenosine triphosphate and deoxyguanosine triphosphate, 1 mM each of deoxycytidine triphosphate and deoxythymidine triphosphate, 25 pmol each of the oligonucleotide primers (CTA TTC GAT GAT GAA GAT ACC CCA CCA AAC CC and GTG AAC TTG CGG GGT TTT TCA GTA TCT ACG A), 1 pg of template DNA, 1% dimethyl sulfoxide, and 2.5 U of Taq DNA polymerase (NEB). PCR conditions were 1× 94 °C for 4 min, 35× 94 °C for 45 s, 60 °C for 35 s, 72 °C for 3 min, and, finally, 1× 72 °C for 10 min. The ep PCR product was excised from agarose gel and reamplified by normal seminested PCR using 100 pg ep PCR product (100 pg in 50 μl) as template, forward primer (TTA CGC TAG CTT GGG TGG TC) and reverse primer (GTG AAC TTG CGG GGT TTT TCA GTA TCT ACG A) (25 pmol each), deoxyribonucleotide triposhpate (0.2 mM each), 10× ThermoPol buffer (NEB) (5 μl), and Taq DNA polymerase (NEB) (2.5 U). PCR conditions were 1× 94 °C for 4 min, then 30× 94 °C for 45 s, 60 °C for 35 s, 72 °C for 1 min, and, finally, 1× 72 °C for 10 min. The PCR product was digested with BamHI and XhoI and ligated into the pACT2 vector digested with the same restriction enzymes. The resulting plasmid was transformed into Escherichia coli XL1 blue MRF7′ electrocompetent cells (Stratagene) to generate a random mutant library of CD-Dnmt3a.
Sequencing of positive mutant clones of CD-Dnmt3a
The plasmids were isolated from the positive yeast mutant clones by plasmid preparation and were transformed into E. coli XL1 blue electrocompetent cells. The E. coli transformants were screened by colony PCR for the desired plasmid. The plasmids were purified from the positive clones and sequenced with two sets of primer pairs (primer pair 1: For1 TTA CGC TAG CTT GGG TGG TC and Rev1 ATT CAC AGT GGA TGC CAA AG; primer pair 2: For2 TTG AGT TCT ACC GCC TCC TG and Rev2 TGC GGG GTT TTT CAG TAT CT). Alternatively, colony PCR was performed using the positive yeast mutant clones and sequenced as described above.
Site-directed mutagenesis
The F768E mutations were introduced in CD-Dnmt3a using a PCR-megaprimer mutagenesis method as previously described.34 Mutagenesis was confirmed by restriction marker site analysis and DNA sequencing.
Mapping and displaying of mutations on the surface of the protein
The Prima Web interface was developed to facilitate the mapping of the mutations on the surface of the proteins¶ The program was written in Perl. Its use is free for academic users after registration. System requirements are that Java Runtime Environment is installeda and cookies management is enabled in the Internet browser.
The user needs to provide a sequence alignment file (in FASTA format) of the interacting mutants and a protein structure or model file (in PDB format). Sample data files showing the results of this study are given on the program page for download. After uploading of the protein model and alignment file, Prima checks if the start of the protein sequence in the PDB file and in the alignment matches. Prima tries to find the corresponding positions of the sequences in the structure and alignment files automatically. If this procedure fails, the user can manually align both sequences by modifying the sequence offset parameter.
Prima adds the information about the conservation of each of the residue extracted from the alignment in the B-factor field in the protein model. The program displays a colored multiple sequence alignment and an interactive structural model, colored according to the conservation score. Two modes of coloring are available, ‘All or nothing’ and ‘Conservation: Percentage.’ The ‘All or nothing’ mode colors the protein residues that are fully conserved in blue and the residues that were exchanged in at least one of the clones in red. The ‘Conservation: Percentage’ coloring mode uses a gradient of colors (blue–green–yellow–orange–red from most conserved to least conserved) within user-defined conservation ranges. If a nonsense mutation appears in the sequence of any of the mutant clones, this could mean that the part of the protein that is C-terminal to the stop codon is not essential for the interaction. Therefore, the user has the option to color that part of the protein as not conserved.
The protein coloring is immediately visualized in the JAVA applet using the new parameters after the data are resubmitted. Additionally, the colored protein model can be downloaded from the Prima Web site and the visualization of the conservation map can be done in any of the most popular 3D visualization programs that can read the information stored in the B-factor field, such as DeepViewb,35 RasMolc,36 or PyMOLd. A more detailed description of the visualization procedure and of the user-defined parameters, as well as a short guide on how to visualize the protein coloring in the external 3D visualization programs, is available in the help section of the Prima Web site.
Acknowledgements
We are thankful to Prof. H. Leonhardt for providing the pAC3a and pB3L plasmids. This work has been supported by a Deutsche Forschungsgemeinschaft grant (JE 252/5-1), by the BMBF BioFuture and NGFN-2 programs to A.J., and by a National Institutes of Health grant (GM 049245) to D.J. and X.C.
Abbreviations used
- PDB
Protein Data Bank
- ep
error prone
Footnotes
Downloadable from http://www.java.com/en/download/index.jsp
References
- 1.Kumar A, Snyder M. Protein complexes take the bait. Nature. 2002;415:123–124. doi: 10.1038/415123a. [DOI] [PubMed] [Google Scholar]
- 2.von Mering C, Krause R, Snel B, Cornell M, Oliver SG, Fields S, Bork P. Comparative assessment of large-scale data sets of protein–protein interactions. Nature. 2002;417:399–403. doi: 10.1038/nature750. [DOI] [PubMed] [Google Scholar]
- 3.Russell RB, Alber F, Aloy P, Davis FP, Korkin D, Pichaud M, et al. A structural perspective on protein–protein interactions. Curr. Opin. Struct. Biol. 2004;14:313–324. doi: 10.1016/j.sbi.2004.04.006. [DOI] [PubMed] [Google Scholar]
- 4.Fry DC. Protein–protein interactions as targets for small molecule drug discovery. Biopolymers. 2006;84:535–552. doi: 10.1002/bip.20608. [DOI] [PubMed] [Google Scholar]
- 5.Henrick K, Thornton JM. PQS: a protein quaternary structure file server. Trends Biochem. Sci. 1998;23:358–361. doi: 10.1016/s0968-0004(98)01253-5. [DOI] [PubMed] [Google Scholar]
- 6.Gray JJ. High-resolution protein–protein docking. Curr. Opin. Struct. Biol. 2006;16:183–193. doi: 10.1016/j.sbi.2006.03.003. [DOI] [PubMed] [Google Scholar]
- 7.Schueler-Furman O, Wang C, Bradley P, Misura K, Baker D. Progress in modeling of protein structures and interactions. Science. 2005;310:638–642. doi: 10.1126/science.1112160. [DOI] [PubMed] [Google Scholar]
- 8.Vasilescu J, Figeys D. Mapping protein–protein interactions by mass spectrometry. Curr. Opin. Biotechnol. 2006;17:394–399. doi: 10.1016/j.copbio.2006.06.008. [DOI] [PubMed] [Google Scholar]
- 9.Landgraf C, Panni S, Montecchi-Palazzi L, Castagnoli L, Schneider-Mergener J, Volkmer-Engert R, Cesareni G. Protein interaction networks by proteome peptide scanning. PLoS Biol. 2004;2:E14. doi: 10.1371/journal.pbio.0020014. [DOI] [PMC free article] [PubMed] [Google Scholar]
- 10.Legrain P, Selig L. Genome-wide protein interaction maps using two-hybrid systems. FEBS Lett. 2000;480:32–36. doi: 10.1016/s0014-5793(00)01774-9. [DOI] [PubMed] [Google Scholar]
- 11.Uetz P. Two-hybrid arrays. Curr. Opin. Chem. Biol. 2002;6:57–62. doi: 10.1016/s1367-5931(01)00288-5. [DOI] [PubMed] [Google Scholar]
- 12.Stelzl U, Wanker EE. The value of high quality protein–protein interaction networks for systems biology. Curr. Opin. Chem. Biol. 2006;10:551–558. doi: 10.1016/j.cbpa.2006.10.005. [DOI] [PubMed] [Google Scholar]
- 13.Parrish JR, Gulyas KD, Finley RL., Jr Yeast two-hybrid contributions to interactome mapping. Curr. Opin. Biotechnol. 2006;17:387–393. doi: 10.1016/j.copbio.2006.06.006. [DOI] [PubMed] [Google Scholar]
- 14.Vidal M, Braun P, Chen E, Boeke JD, Harlow E. Genetic characterization of a mammalian protein–protein interaction domain by using a yeast reverse two-hybrid system. Proc. Natl. Acad. Sci. USA. 1996;93:10321–10326. doi: 10.1073/pnas.93.19.10321. [DOI] [PMC free article] [PubMed] [Google Scholar]
- 15.Valdar WS, Thornton JM. Conservation helps to identify biologically relevant crystal contacts. J. Mol. Biol. 2001;313:399–416. doi: 10.1006/jmbi.2001.5034. [DOI] [PubMed] [Google Scholar]
- 16.Glaser F, Pupko T, Paz I, Bell RE, Bechor-Shental D, Martz E, Ben-Tal N. ConSurf: identification of functional regions in proteins by surface-mapping of phylogenetic information. Bioinformatics. 2003;19:163–164. doi: 10.1093/bioinformatics/19.1.163. [DOI] [PubMed] [Google Scholar]
- 17.Hermann A, Gowher H, Jeltsch A. Biochemistry and biology of mammalian DNA methyltransferases. Cell. Mol. Life Sci. 2004;61:2571–2587. doi: 10.1007/s00018-004-4201-1. [DOI] [PMC free article] [PubMed] [Google Scholar]
- 18.Klose RJ, Bird AP. Genomic DNA methylation: the mark and its mediators. Trends Biochem. Sci. 2006;31:89–97. doi: 10.1016/j.tibs.2005.12.008. [DOI] [PubMed] [Google Scholar]
- 19.Okano M, Bell DW, Haber DA, Li E. DNA methyltransferases Dnmt3a and Dnmt3b are essential for de novo methylation and mammalian development. Cell. 1999;99:247–257. doi: 10.1016/s0092-8674(00)81656-6. [DOI] [PubMed] [Google Scholar]
- 20.Gowher H, Jeltsch A. Molecular enzymology of the catalytic domains of the Dnmt3a and Dnmt3b DNA methyltransferases. J. Biol. Chem. 2002;277:20409–20414. doi: 10.1074/jbc.M202148200. [DOI] [PubMed] [Google Scholar]
- 21.Reither S, Li F, Gowher H, Jeltsch A. Catalytic mechanism of DNA-(cytosine-C5)-methyltransferases revisited: covalent intermediate formation is not essential for methyl group transfer by the murine Dnmt3a enzyme. J. Mol. Biol. 2003;329:675–684. doi: 10.1016/s0022-2836(03)00509-6. [DOI] [PubMed] [Google Scholar]
- 22.Gowher H, Liebert K, Hermann A, Xu G, Jeltsch A. Mechanism of stimulation of catalytic activity of Dnmt3A and Dnmt3B DNA-(cytosine-C5)-methyltransferases by Dnmt3L. J. Biol. Chem. 2005;280:13341–13348. doi: 10.1074/jbc.M413412200. [DOI] [PubMed] [Google Scholar]
- 23.Margot JB, Ehrenhofer-Murray AE, Leonhardt H. Interactions within the mammalian DNA methyltransferase family. BMC Mol. Biol. 2003;4:7. doi: 10.1186/1471-2199-4-7. [DOI] [PMC free article] [PubMed] [Google Scholar]
- 24.Hata K, Okano M, Lei H, Li E. Dnmt3L cooperates with the Dnmt3 family of de novo DNA methyltransferases to establish maternal imprints in mice. Development. 2002;129:1983–1993. doi: 10.1242/dev.129.8.1983. [DOI] [PubMed] [Google Scholar]
- 25.Bourc'his D, Xu GL, Lin CS, Bollman B, Bestor TH. Dnmt3L and the establishment of maternal genomic imprints. Science. 2001;294:2536–2539. doi: 10.1126/science.1065848. [DOI] [PubMed] [Google Scholar]
- 26.Bloom JD, Meyer MM, Meinhold P, Otey CR, MacMillan D, Arnold FH. Evolving strategies for enzyme engineering. Curr. Opin. Struct. Biol. 2005;15:447–452. doi: 10.1016/j.sbi.2005.06.004. [DOI] [PubMed] [Google Scholar]
- 27.Yuan L, Kurek I, English J, Keenan R. Laboratory-directed protein evolution. Microbiol. Mol. Biol. Rev. 2005;69:373–392. doi: 10.1128/MMBR.69.3.373-392.2005. [DOI] [PMC free article] [PubMed] [Google Scholar]
- 28.Cadwell RC, Joyce GF. Randomization of genes by PCR mutagenesis. PCR Methods Appl. 1992;2:28–33. doi: 10.1101/gr.2.1.28. [DOI] [PubMed] [Google Scholar]
- 29.Gowher H, Loutchanwoot P, Vorobjeva O, Handa V, Jurkowska RZ, Jurkowski TP, Jeltsch A. Mutational analysis of the catalytic domain of the murine Dnmt3a DNA-(cytosine C5)-methyltransferase. J. Mol. Biol. 2006;357:928–941. doi: 10.1016/j.jmb.2006.01.035. [DOI] [PubMed] [Google Scholar]
- 30.Jia D, Jurkowska RZ, Zhang X, Jeltsch A, Cheng X. Structure of Dnmt3a bound to Dnmt3L suggests a model for de novo DNA methylation. Nature. 2007;449:248–251. doi: 10.1038/nature06146. [DOI] [PMC free article] [PubMed] [Google Scholar]
- 31.Kim PM, Lu LJ, Xia Y, Gerstein MB. Relating three-dimensional structures to protein networks provides evolutionary insights. Science. 2006;314:1938–1941. doi: 10.1126/science.1136174. [DOI] [PubMed] [Google Scholar]
- 32.Bentley DR. Whole-genome re-sequencing. Curr. Opin. Genet. Dev. 2006;16:545–552. doi: 10.1016/j.gde.2006.10.009. [DOI] [PubMed] [Google Scholar]
- 33.Staudinger J, Perry M, Elledge SJ, Olson EN. Interactions among vertebrate helix–loop–helix proteins in yeast using the two-hybrid system. J. Biol. Chem. 1993;268:4608–4611. [PubMed] [Google Scholar]
- 34.Jeltsch A, Lanio T. Site-directed mutagenesis by polymerase chain reaction. Methods Mol. Biol. 2002;182:85–94. doi: 10.1385/1-59259-194-9:085. [DOI] [PubMed] [Google Scholar]
- 35.Guex N, Peitsch MC. SWISS-MODEL and the Swiss-PdbViewer: an environment for comparative protein modeling. Electrophoresis. 1997;18:2714–2723. doi: 10.1002/elps.1150181505. [DOI] [PubMed] [Google Scholar]
- 36.Sayle RA, Milner-White EJ. RASMOL: biomolecular graphics for all. Trends Biochem. Sci. 1995;20:374. doi: 10.1016/s0968-0004(00)89080-5. [DOI] [PubMed] [Google Scholar]