

Abstract
Objective
We evaluated three methodologies - a calcium sodium alginate compound (CSAC), polyacrylate beads (PAB), and Whatman paper (WPR) - for the ability to recover synovial fluid from mouse knees in a manner that facilitated biochemical marker analysis.
Methods
Pilot testing of each of these recovery vehicles was conducted using small volumes of waste human synovial fluid. CSAC emerged as the method of choice, and was used to recover and quantify SF from the knees of C57BL/6 mice (n=12), six of which were given left-knee articular fractures. Synovial fluid concentrations of Cartilage Oligomeric Matrix Protein (COMP) were measured by ELISA.
Results
The mean concentration ratio ([COMP left knee] / [COMP right knee]) was higher in the mice subjected to articular fracture when compared to the non-fracture mice (p=0.026). The mean total COMP ratio (taking into account the quantitative recovery of synovial fluid) best discriminated between fracture and non-fracture knees (p=0.004).
Conclusions
Our results provide the first direct evidence of accelerated joint tissue turnover in a mouse model responding to acute joint injury. These data strongly suggest that mouse synovial fluid recovery is feasible and that biomarker analysis of collected synovial fluid samples can augment traditional histological analyses in mouse models of arthritis.
Keywords: biomarkers, synovial fluid, osteoarthritis, arthritis, alginate, polyacrylate, mouse
Introduction
Osteoarthritis (OA) is a degenerative disease estimated to affect 70 to 90 percent of the population aged 75 years and older.1 Although radiographic grading is the current standard for the diagnosis and tracking of OA2, a variety of biological markers, or “biomarkers”, in the serum, urine, or synovial fluid (SF) have also shown correlations with OA severity3-7. Recently, the sparse availability of diseased human tissue and the inherent difficulty of finding a relatively homogenous sample group have prompted continuing research in animal models of OA to provide repeatable and cost-effective models of disease progression.8-13 In particular, mouse models of OA, based on transgenic and knock-in/knock-out modification, provide novel insights into the mechanistic pathways of disease14; however, the ability to evaluate the relationships between OA severity and molecular biomarkers in mouse models has been limited to analysis of serum or urine by the small volume and inaccessibility of the SF in the synovial joints of mice15. Concordantly, the primary obstacle preventing use of mouse SF in biomarker studies is the lack of a repeatable method for harvesting and quantifying the very small amounts of fluid, estimated to be ∼1 μL, in the murine knee joint.
In other animal models such as the canine meniscectomy model of OA, joint lavage with saline has been used to retrieve the relatively large volumes of SF (50-200 μL)16-20, and the dilution effect of the lavage has been corrected by normalization to serum urea21; however, this method cannot provide accurate SF retrieval of small volumes. Likewise, the Whatman Paper Recovery method has been used to recover SF from joints with small SF volumes (∼5 μL), e.g. from guinea pig knees22, but the liquid, biomarker, and cytokine recovery efficiencies of this method have not previously been reported.
Thus, the aim of this study was to develop and validate a method for recovery of small volumes of SF from mouse joints. We investigated three means of SF recovery for their applicability to mouse studies – Whatman Paper Recovery (WPR), Polyacrylate Bead (PAB) recovery, and calcium sodium alginate compound (CSAC) recovery. We hypothesized that either PAB or CSAC recovery would provide a means of harvesting a measurable volume of SF from the knee of a mouse in a manner that allows quantitative analysis of biomarkers. The measurements of total protein, COMP, and KS were explored.
Methods
Measuring Sample Volume
Three methods of SF harvest were explored. Two methods (PAB and CSAC described below) relied on accurate volume measurements with a pipette, which we refer to here as the ‘pipette-dialing’ technique. The ‘pipette-dialing’ technique is applicable to any standard Gilson micropipette sized 2 μL through 1000 μL. First, the pipette was set to 5 μL higher than the approximate amount of sample. The sample of indeterminate size was captured using an appropriately-sized low-retention micropipette tip (Genesee Scientific Cat. No. 24-150RL). Caution was taken to ensure that the resultant air pocket at the tip was clearly separated from the liquid. Finally, the micropipette's volume determination wheel was dialed-down until the sample filled the very tip without any overflow. The value on the side of the pipette was recorded as the volume of the sample.
PAB Absorbance
Polyacrylate beads were the first of three materials evaluated for their capability to serve as a vehicle for small volume SF recovery. The fluid absorption capacity of Poly(acrylic acid) partial sodium salt [Sigma Aldrich Cat No 436364], a lightly cross-linked PAB (PAB-L), was assessed by adding 1000 μL of deionized H2O to 10 lightly cross-linked PABs. The amount of fluid absorbed per bead was measured by recording ΔV (change in volume) every 5 minutes using the pipette-dialing method on the unabsorbed liquid and dividing this value by 10. This procedure was repeated 3 times. Additionally, the effect of agitation on short-term liquid absorbance efficiency was investigated by agitating samples with a titer plate shaker (Lab-Line Industries, Model #4625; Melrose Park, IL) set on level 6 in between ΔV measurements [6 repetitions – 3 with agitation, 3 without]. The time a given sample spent on the shaker (ton shaker) was varied and plotted against volumetric recovery.
PAB Recovery
1000 μL of deionized H2O was added to 10 PABs. The beads were then allowed to absorb water for 15 minutes, at which point ΔV was recorded and the excess water discarded. 1000 μL of room temperature, saturated NaCl solution was added, and ΔV was assessed at 5 minute intervals. Measurements ceased 90 minutes after the recovery liquid was added. Lastly, the optimal time for recovery was identified by examining the data collected through these repetitions. This protocol was performed 3 times.
The effect of preswelling PABs on SF recovery was determined by adding 3 μL of dH2O to each of three lightly cross-linked PABs. A total of 1 μL of human knee waste SF was then added to each of the preswollen PABs as well as 3 non-swollen PABs. Each bead was then placed in a separate well of a 96-well polystyrene microplate. A total of 100 μL of saturated NaCL solution was added to each well, and the entire plate was placed on the shaker for 5 minutes at level 7. After agitation, ΔV was determined for each group of beads. The recovered fluid and an aliquot of the initial SF sample (1:100 dilution in deionized H2O) were assayed for protein (BCA Protein, Pierce, #23225).
CSAC Recovery
The second of three materials evaluated for its capability to serve as a vehicle for small volume SF recovery was Melgisorb (Tendra, REF 250600; Göteborg, Sweden), a calcium sodium alginate compound (CSAC) used as a dressing on wounds to absorb heavy exudate. Small, circular pieces of the 2-inch × 2-inch dressings were cut using a hole-punch with a 3/16-inch diameter. After absorbing the target liquid, a total of 35 μL of Alginate Lyase in H2O (1-unit/mL concentration ≃ 55.04-g/mL; derived from Flavobacterium, Sigma-Aldrich A1603-100MG) was added, and the resultant mixture was vortexed briefly and incubated at 34°C for 30 minutes. Following this brief digestion period, 15 μL of 1.0M Sodium Citrate (C6H5Na3O7) was added to each sample to lower the viscosity of the solution by chelating the alginate's Ca2+ ions. The sample volume was then recorded using the pipette-dialing method. For experiments in mouse knees, small, circular pieces of 2 mm were used satisfactorily in conjunction with the same procedure outlined above.
WPR Related Methods
The third and final SF harvesting method to be evaluated involved Whatman paper (Whatman Cat. No. 3030 917) referred to here as the Whatman paper recovery method. WPR was included as a reference method because it has been used successfully to measure biomarkers in the ∼5 μL of synovial fluid estimated to be present in guinea pig knee joints 22. For determination of absorptive capacity and recovery efficiency, large volumes (100 μl) were tested. A total of 100 μL of 0.15 M saline was added to each piece of Whatman paper of 3/16-inch diameter in a 1.8 mL tube and the samples were allowed to sit overnight at 4°C. The next morning the sample was centrifuged (13,000 rpm for 1 min) and the liquid was aspirated from each sample and frozen for later use.
Proof of concept in vitro experiments with human synovial fluid
Each of the three SF harvest methods was optimized using small volumes (1μl) of human SF. Both total protein, and keratan sulfate (KS) recovery were assessed. PABs were available in a range of cross-linked forms ranging from low to high. We harvested SF with three levels of PAB cross-linkage: the previously mentioned PAB-L representing light cross-linkage; poly(acrylic acid) partial sodium salt-graft-poly(ethylene oxide) [Sigma Aldrich Cat No 432784-250G] representing medium cross-linkage (PAB-M); and poly(2-hydroxyethylmethacrylate) [Sigma Aldrich Cat No 192066-1G] representing high cross-linkage (PAB-H). Triplicate experiments were performed with each type of PAB, preswollen with 3 μL of H2O before being used to collect 1μL of SF.
During tests on human SF, Whatman paper pieces 3/16-inch in diameter were cut with a hole-punch, and 1 μL of human knee SF was added to each. The CSAC method was used to collect these samples via the procedure outlined above. An additional 3 samples were collected by CSAC, substituting 35 μL of 1.0M Sodium Citrate for the specified 35 μL of alginate lyase. Although it was necessary to add lyase during CSAC recovery in order to ensure that the viscosity of the recovered sample was not prohibitive to ΔV measurements, this latter set of CSAC samples was collected in order to investigate the effect of the lyase on the measurement of biochemical markers (protein, and KS). To summarize, the final list of methodologies tested in triplicate for recovery of total protein and KS from human SF consisted of: PAB-L, PAB-M, PAB-H, CSAC with lyase, CSAC without lyase, and WPR.
Proof of concept experiments in vivo with mouse synovial fluid
Upon animal sacrifice, SF was collected using CSAC from both knees of twelve adult male C57BL/6 mice, six of which had undergone left knee articular fractures as has been previously described23. All of these mice were raised on a high fat (60%) diet. Each target joint was opened by suprapatellar tendonotomy within approximately 2 hours of sacrifice, and the 2 mm piece of CSAC was swabbed in each joint cavity. Following SF absorption (1 to 3 minutes), the piece of CSAC was removed and placed in a Nunc tube. All CSAC samples collected from mouse knees underwent lyase digestion within 4 hours of initial SF absorption. Some preliminary experiments using this procedure were done with sentinel C57BL/6 mice to examine the feasibility of the CSAC recovery method in a mouse model
Protein, KS and COMP assays
To correct for non-specific background potentially contributed by the vehicles (WPR, PAB or CSAC), appropriate negative controls were always included that consisted of the vehicle incubated with saline to control for non-specific effects.
Bradford Protein Assay
Unless otherwise stated, total protein levels were measured using the Bradford Micro-Protein Determination. A total of 1 μL of each sample was added to 99 μL of deionized H2O in respective wells of an optically-clear, polystyrene 96-well microtiter plate. Bradford reagent was added at a 1:1 volumetric ratio to each well, and, after 10 minutes, the optical absorbance at 595 nm was recorded using a GENios Plate Reader (Tecan, A-5082, Austria).
KS Competitive ELISA
KS levels were measured in all human SF samples using the monoclonal antibody 5-D-4 (supplied by Dr. Bruce Caterson, Cardiff, Wales) in a quantitative inhibition enzyme-linked immunosorbent assay24. Synovial fluid samples were assayed at a final dilution of 1:500. Levels of 5D4-keratan sulfate epitope were reported in terms of equivalents (expressed in ng/ml) of a chondroitinase treated A1D1 preparation of bovine nasal cartilage. For purposes of conversion, a 1.0 ng protein sample of our aggrecan standard is equivalent to 0.12 ng of purified keratan sulfate-2 international standard (provided by Dr Eugene Thonar, Chicago, IL).
COMP Competitive ELISA
COMP was quantified by a competitive ELISA using monoclonal antibody 12C4 which recognizes an epitope of the carboxyl-terminal globular domain of human COMP25, and cross-reacts with both guinea pig and mouse COMP. A total of 60 μL of 12C4 diluted 1:150,000 in Tris IB was added to 60 μL of diluted sample during the primary binding step of the ELISA. On-plate dilution of samples was recovery-dependent, and ranged from 3:560 to 1:1,020 in Tris IB. Otherwise, the assay was performed as previously described26. A blank of each recovery method was run on each applicable plate to account for potential background readings. Samples that were not detectable at tested concentration levels due to background noise were assigned a stand-in value of one-half of the lowest detectable sample concentration equal to 39.81 ng.
Statistical Analyses
The volumetric recovery data were found to be approximately normally distributed via histogram-based analysis, and it also passed Levine's Test for Homogeneity of Variance. Thus, Independent Samples T-tests were used to analyze those results. The data on effects of preswelling on protein recovery had too few observations to be analyzed with a non-parametric comparison between means, e.g., Mann-Whitney U Test, as such a test is incapable of detecting significance when the number of observations per group is ≤3. Furthermore, since no compelling evidence suggested that each methodology's protein percent recovery population distribution would be non-normal, the T-test was the best tool available.
ANOVA was not performed on total protein and KS recovery data because the level of procedural differences between the tested methodologies is not uniform. In other words, many method-specific variables separate the 3 different classes (PAB, CSAC, WPR) of recovery while only one class-specific variable (extent of cross-linkage or presence/absence of lyase) separated the particular instances within each class. Modeling this degree of intricacy with ANOVA was impossible given the small number of samples analyzed; therefore, ANOVA was only used to compare the 3 types of tested PABs. This parametric analysis was chosen because the data collected from these 3 methods passed Levine's Test for Homogeneity of Variance. In the case of KS recovery, the means of the 3 PAB methodologies were compared with the Kruskal-Wallace Test. This non-parametric equivalent to ANOVA was used because the KS percent recovery data for the 3 PAB methodologies failed Levine's Test for Homogeneity of Variance.
Non-parametric comparisons for related (Wilcoxon Signed-Rank) and unrelated (Mann-Whitney U) samples were used for comparisons between knees of the same animals and between knees of different animals respectively. These data sets were small enough to discourage use of parametric comparisons (n≤30), but not small enough to negate the effectiveness of the non-parametric equivalents; therefore, the two tests chosen were ideal for our testing purposes.
Results
Liquid Absorption and Recovery
The average fluid absorption capacity of a single PAB-L was found to be 24.3 μL of deionized H2O (dH2O) after 5-minutes, and a maximum of 35.5 μL after 90-minutes of unaided absorption (Figure 1a). Introducing shaker plate agitation increased the 5-minute average liquid absorbance to 26.4 μL (n=10 per group; p=0.029, Two-tailed Independent Samples T-test; Figure 1b). No formal absorption data were collected on CSAC or WPR because each material was able to quickly absorb over 10 μL of dH2O in 15 seconds under empirical observation. PAB-L were used as our practical paradigm for these initial measurements since they theoretically absorb fluid more quickly than PAB-M and PAB-H in spite of the higher total absorptive capacity enjoyed by the more highly cross-linked beads.
Figure 1.

Polyacrylate absorbance and recovery. (a, b) Mean volume of dH2O absorbed by a single polyacrylate bead (PAB) (n=30) over time; (c) mean volume of dH2O recovered from a single PAB (n=30). (d) Preswelling PAB-L increased the amount of protein recovered, n=3 per group (p=0.004, Independent Samples T-test). Error bars represent a single standard deviation.
To optimize liquid recovery, the amount of deionized H2O (dH2O) recovered using the PAB methodology the pipette-dialing technique method was plotted against elapsed time (Figure 1c). In so doing, the recovery curve was found to peak 5 minutes after the PABs were immersed in saturated NaCl solution, at which point the average liquid recovered was 28.0 μL per bead (Figure 1c). To evaluate liquid recovery efficiency of PAB-L, we attempted to recover 3 μL of dH2O. The average recovery ratio (Vrecovered/Vabsorbed) was 0.987±0.367 (Mean±SD) obtained from 45 trials. This compared to an average recovery ration of 1.00±0.502 over 30 trials for CSAC.
Protein Recovery - Human SF
An increase in protein recovery efficiency was observed when preswelling each PAB-L with 3 μL of deionized H2O (n=3 per group; p=0.004, Two-tailed Independent Samples T-test; Figure 1d); therefore, all three types of PAB were preswollen during the subsequent inter-method comparison of protein recovery. The six methodologies (PAB-L, PAB-M, PAB-H, CSAC with lyase, CSAC without lyase, and WPR) were tested for their ability to recover protein from 1 μL of human SF (n=3 per method, Figure 2a). CSAC without lyase was the most unreliable of protein recovery methodologies. WPR was found to be more efficient at protein recovery than CSAC with lyase (p=0.002, Two-tailed Independent Samples T-test). The degree of cross-linkage was found to be responsible for the rank-order amongst the 3 PAB methods: PAB-L>PAB-M>PAB-H (p=0.011, One-Way ANOVA). This particular order was expected because the long-term advantage in liquid absorptivity of the beads with more cross-links was rendered moot by the 5-minute time limit imposed to mimic the constraints of a manageable SF recovery procedure in mice.
Figure 2.
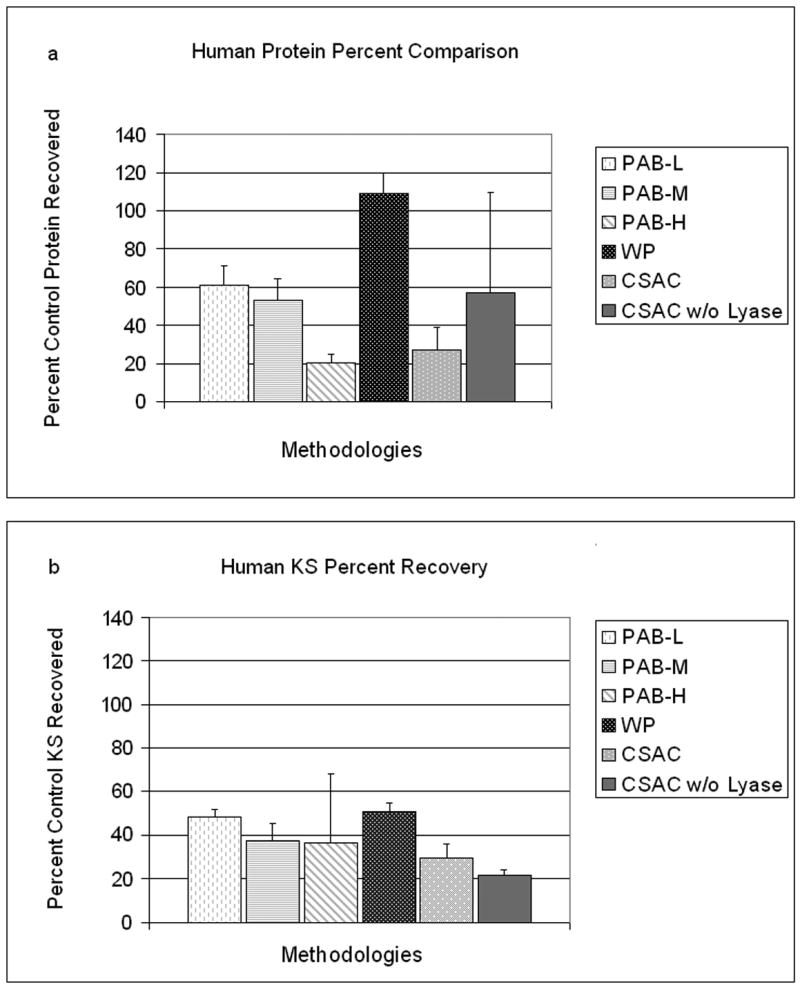
Percent recovery comparison. (a, b) Comparisons between all six evaluated methodologies on percent recovery of total protein and keratan sulfate (KS) respectively. WPR was more efficient at protein recovery (a) and KS recovery (b) than CSAC with lyase (p=0.002, p=0.015, Independent Samples T-test). Error bars represent a single standard deviation.
KS Recovery – Human SF
The six methodologies were tested for their ability to recover KS from human SF in order to evaluate each method's ability to recover a biochemical marker more specific to joint tissue. The efficiency of KS recovery was assessed using the same human SF samples that were used in protein testing (n=3 per method, Figure 2b). No difference due to cross-linkage was detected between the 3 PAB methodologies (p=0.430, Kruskal-Wallace Test). WPR was found to be more efficient than CSAC with lyase at recovering KS (p=0.015, Independent Samples T-test).
COMP Recovery – Mouse SF
CSAC was chosen for testing in mice due to: 1) its ability to precisely and accurately quantify the volume of liquid recovered, 2) a lower, non-specific background of CSAC control in the 5D4 KS and 12C4 COMP ELISA assays compared with PAB control (data not shown), and 3) the fact that it was easier than polyacrylate to physically manipulate in small joint spaces. To investigate proper dilution levels, both ELISAs were run on SF samples collected with CSAC from 3 C57BL/6 sentinel mice. Unfortunately, the 5D4 ELISA was not able to detect any KS in these samples, however, given that COMP was detectable with the 12C4 ELISA in the CSAC-collected SF samples from sentinel mice, the KS 5D4 assay was abandoned in favor of further COMP testing.
In total, twelve C57BL/6 mice fed a high-fat diet were used for testing – six with articular fractures of the left knee (HFD-f) and six without (HFD-nonf). The overall average volume (Mean±SD) of SF recovered from an individual joint with the CSAC method was 3.30±1.31 μL. More specifically, the mean volume recovered from the left, fractured knees of the HFD-f mice (3.78±0.93 μL) was higher than the mean volume recovered from the right non-fractured knees of the same animals (2.75±1.13 μL), and this difference approached significance (p=0.079, Mann-Whitney U Test).
The mean COMP concentration of the fractured left knees was higher than that of the contralateral non-fractured right knees (3444±1515 ng/μL versus 2924±1302 ng/μL), and this difference too approached significance (p=0.075, Wilcoxon Signed-Rank Test). The mean concentration ratio ([COMPleft knee] / [COMPright knee]) was higher (p=0.026, Mann-Whitney U Test) in the mice subjected to articular fracture (52.1±62.2) when compared to the non-fracture mice (0.89±0.76).
Total recovered COMP from each sample was assessed by multiplying each computed concentration by the total volume recovered from that knee (Table 1). Mean total COMP was higher in the fractured knees (5676.2±2906.6 ng) than the non-fractured knees (961.9±1153.4 ng) in the six fracture mice (p=0.046, Wilcoxon Signed-Rank Test) (Figure 3). Furthermore, the mean total COMP ratio (|total left knee COMP (ng)| / |total right knee COMP (ng)|) was higher (p=0.004, Mann-Whitney U Test) for the six fracture mice (55.6±58.2) compared to their non-fracture counterparts (0.87±0.51) (Table 1 and Figure 3).
Table 1. Synovial fluid COMP and volume recovery in vivo from mouse knees.
| Group | Mouse | Total COMP (L) (ng) | Total COMP (R) (ng) | Total COMP (L/R) Ratio | SF vol (L) (μl) | SF vol (R) (μl) | COMP (L) (ng/μl) | COMP (R) (ng/μl) | COMP (L/R) Ratio |
|---|---|---|---|---|---|---|---|---|---|
| HFD-fracture | 1 | 6268.81 | 39.81 | 157.47 | 5.0 | 5.0 | 1253.76 | 7.96 | 157.45 |
| 2 | 8153.25 | 79.63 | 102.39 | 2.6 | 3.0 | 3135.87 | 26.54 | 118.14 | |
| 3 | 10235.61 | 2800.45 | 3.65 | 3.0 | 2.4 | 3411.87 | 1166.85 | 2.92 | |
| 4 | 4768.83 | 476.23 | 10.01 | 3.3 | 2.6 | 1445.10 | 183.16 | 7.89 | |
| 5 | 2289.19 | 2335.52 | 0.98 | 3.8 | 1.6 | 602.42 | 1459.70 | 0.41 | |
| 6 | 2341.56 | 39.81 | 58.82 | 5.0 | 2.2 | 468.31 | 18.10 | 25.88 | |
| Mean | 5676.21 | 961.91 | 55.55 | 3.78 | 2.8 | 1719.56 | 477.05 | 52.12 | |
| HFD-non-fracture | 7 | 721.80 | 10287.67 | 0.07 | 3.2 | 3.8 | 225.56 | 2707.28 | 0.08 |
| 8 | 2598.94 | 1427.61 | 1.82 | 2.0 | 2.6 | 1299.47 | 549.08 | 2.37 | |
| 9 | 2793.16 | 3357.39 | 0.83 | 1.8 | 2.9 | 1551.76 | 1157.72 | 1.34 | |
| 10 | 2710.52 | 2954.26 | 0.92 | 2.8 | 1.2 | 968.04 | 2461.89 | 0.39 | |
| 11 | 3236.96 | 4407.80 | 0.73 | 5.1 | 3.1 | 634.70 | 1421.87 | 0.45 | |
| 12 | 2507.48 | 2977.30 | 0.84 | 6.2 | 5.2 | 404.43 | 572.56 | 0.71 | |
| Mean | 2428.14 | 4235.34 | 0.87 | 3.52 | 3.13 | 847.33 | 1478.40 | 0.89 |
HFD = high fat diet fed; vol = volume; SF = synovial fluid
L = left knee (fracture or sham fracture); R = right knee (control)
COMP = cartilage oligomeric matrix protein
Figure 3.
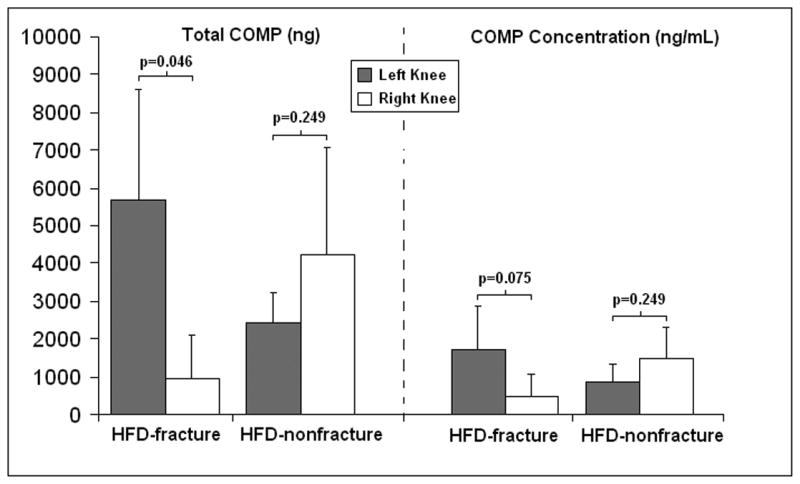
Mean synovial fluid COMP levels in mouse knees. Total COMP (left panel) and COMP concentration (right panel) were highest in fractured left knees compared with non-fractured right knees in high fat diet (HFD) fed mice. This difference in the fracture mice was statistically significant for total COMP (p=0.046).
Discussion
We tested three different materials for their utility as vehicles for small volume SF harvest. We first undertook pilot studies with human SF followed by proof of concept experiments in mouse knees. Based on the insights gleaned through handling each of the three recovery vehicles (WPR, PAB, CSAC), CSAC with lyase clearly emerged as the preferred method for recovering small volumes of SF.
We were able to quantify mouse knee SF COMP concentrations and SF total COMP, as well as calculate left/right ratios of both measures. Overall, the total COMP left/right ratio, best discriminated between fracture and non-fracture knees (post/pre comparison), showing the strongest statistically significant difference between fracture and non-fracture mice. The validity of total SF COMP depends on the degree to which one can assume that all available volume was recovered; however, this assumption appeared to be reasonable in our experiments based on visual observations during the CSAC recovery procedure. Furthermore, in addition to total COMP left/right ratio (that provided a control for biological variability between animals), the difference between total COMP remained significant in spite of the small sample population (n=12). This underscores the primary benefit of the CSAC method, e.g., the ability to know how much volume was recovered from each knee. Given the results approaching significance for the difference between groups for absolute COMP concentration, a slightly larger sample size would be needed for this measure to overcome inter-animal variability. The promising results of our mouse in vivo pilot study (using CSAC with lyase method) supported our hypothesis that precise, quantitative recovery of mouse SF was possible.
Although WPR was most efficient for total protein and KS recovery, the weights obtained from the available analytical balance pre- and post- SF addition were too unreliable to be of any use due to the light paper chads and limited synovial fluid volume (1 μL), which precluded accurate volume measurement via mass-subtraction. Thus, we found that the inability to measure ΔV ≤ 3 μL with this method prevented accurate biomarker measurements in samples collected from mouse joints because biomarker concentrations could not be calculated without knowing the volume of fluid retrieved. Similarly, ΔV could not be measured reliably in CSAC samples collected without the use of lyase due to the resultant liquid's viscosity. The high variances of the protein recovery results for CSAC samples collected without lyase suggested that biomarker measurement in such samples would be inaccurate as well.
Though PABs were found to exhibit potential for liquid and biomarker recovery, further development of specific iterations of the material are needed before it can be useful for mouse SF recovery. For instance, in accordance with the properties of the polyacrylate, the elastic capacity and the elastic limit of PABs increase as cross-linkage increases. Thus, the absorption/oscillation curve of more extensively cross-linked PABs would likely be characterized by a longer wave length and smaller slope due to the stronger elastic influence on the system (Figure 4); however, the decrease in initial, short-term absorptivity is detrimental to the use of PAB constructs with higher cross-linkage in mouse SF recovery applications. Pre-swelling ameliorated some of the negative effects of higher cross-linkage; however, preswelling to a degree that the bead would still fit inside a mouse knee joint (∼3 μL) was most helpful to PAB-L in protein recovery applications. This is likely because the added 3 μL represented a higher percentage of the absorptive capacity of a PAB-L, producing a proportionally greater increase in surface area. This increase in surface area contributed to the relatively efficient protein recovery of PAB-L while also being the source of the enhancement to the oscillation curve. Notably, it is likely that a PAB created especially for SF recovery could bypass these discussed limitations. Without such a specially constructed polyacrylate though, CSAC stands alone as the material of choice for small volume SF recovery.
Figure 4.
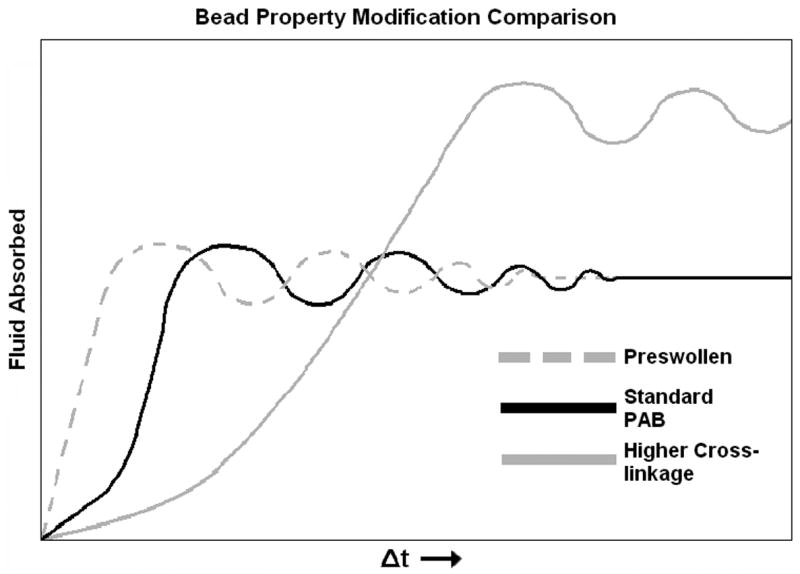
Effects of cross-linkage on polyacrylate bead properties. Varying levels of cross-linkage and their theoretically approximated effects on the absorption/oscillation curve of a polyacrylate bead (PAB).
To date, COMP in serum and SF has been repeatedly validated as a marker of cartilage turnover that correlates with OA progression in human27, 28 and guinea pig12, 29 systems, as well as with OA progression and therapeutic response in canine systems19,30. Serum COMP has been one of the few markers that has been evaluated in a mouse model of OA31; however, this study represents the first known SF biomarker analyses in a mouse model system, namely for SF COMP. Being able to measure COMP levels in mouse SF provides a promising window into OA pathology due to the relatively inexpensive, reproducible, and time efficient nature of mouse models of OA. Although mice are reported to have detectable levels of KSI (KS N-linked to Asn residues in the core protein; typically found in the cornea),32 and mouse aggrecan has putative KSII binding sites,33,34 KSII was not detectable in mouse SF using the 5D4 ELISA.
In summary, the CSAC methodology utilizing lyase unquestionably emerged as the optimal protocol for SF recovery from mice. Given the elevations of SF COMP detected in the mouse knee fracture group of this study using a relatively small number of animals, CSAC recovery of mouse SF is clearly feasible, reliable, and able to provide valuable information indicative of metabolic turnover in the joint. We believe some troubleshooting would need to be done to evaluate the optimal processing for each analyte one would want to measure, but with the appropriate optimization, this method could prove very useful to the field as an adjunctive measure to complement histological evaluation of mouse models of arthritis.
Acknowledgments
We would like to extend our thanks to Dr. Vladimir Vilim for the kind gift of the 12C4 monoclonal antibody, and to Dr. Bruce Caterson for his gift of the 5D4 monoclonal antibody.
Supported by NIH/NIAMS P01 AR50245 and U01 AR050898
Footnotes
Publisher's Disclaimer: This is a PDF file of an unedited manuscript that has been accepted for publication. As a service to our customers we are providing this early version of the manuscript. The manuscript will undergo copyediting, typesetting, and review of the resulting proof before it is published in its final citable form. Please note that during the production process errors may be discovered which could affect the content, and all legal disclaimers that apply to the journal pertain.
References
- 1.Hinton R, Moody RL, Davis AW, Thomas SF. Osteoarthritis: diagnosis and therapeutic considerations. Am Fam Physician. 2002;65:841–848. [PubMed] [Google Scholar]
- 2.Cibere J. Do we need radiographs to diagnose osteoarthritis? Best Pract Res Clin Rheumatol. 2006;20:27–38. doi: 10.1016/j.berh.2005.08.001. [DOI] [PubMed] [Google Scholar]
- 3.Birmingham JD, Vilim V, et al. Collagen biomarkers for arthritis applications. Biomarker Insights. 2006:61–76. [PMC free article] [PubMed] [Google Scholar]
- 4.Criscione LG, Elliott AL, Stabler T, Jordan JM, Pieper CF, Kraus VB. Variation of serum hyaluronan with activity in individuals with knee osteoarthritis. Osteoarthritis Cartilage. 2005;13:837–840. doi: 10.1016/j.joca.2005.05.004. [DOI] [PubMed] [Google Scholar]
- 5.Kraus VB. Biomarkers in osteoarthritis. Curr Opin Rheumatol. 2005;17:641–646. doi: 10.1097/01.bor.0000174195.15421.17. [DOI] [PubMed] [Google Scholar]
- 6.Kong SY, Stabler TV, Criscione LG, Elliott AL, Jordan JM, Kraus VB. Diurnal variation of serum and urine biomarkers in patients with radiographic knee osteoarthritis. Arthritis Rheum. 2006;54:2496–2504. doi: 10.1002/art.21977. [DOI] [PubMed] [Google Scholar]
- 7.Rousseau JC, Delmas PD. Biological markers in osteoarthritis. Nat Clin Pract Rheumatol. 2007;3:346–356. doi: 10.1038/ncprheum0508. [DOI] [PubMed] [Google Scholar]
- 8.Ameye LG, Young MF. Animal models of osteoarthritis: lessons learned while seeking the “Holy Grail”. Curr Opin Rheumatol. 2006;18:537–547. doi: 10.1097/01.bor.0000240369.39713.af. [DOI] [PubMed] [Google Scholar]
- 9.Carlson CS, Guilak F, Vail TP, Gardin JF, Kraus VB. Synovial fluid biomarker levels predict articular cartilage damage following complete medial meniscectomy in the canine knee. J Orthop Res. 2002;20:92–100. doi: 10.1016/S0736-0266(01)00066-3. [DOI] [PubMed] [Google Scholar]
- 10.Laprade RF, Wentorf FA, Olson EJ, Carlson CS. An in vivo injury model of posterolateral knee instability. Am J Sports Med. 2006;34:1313–1321. doi: 10.1177/0363546506286785. Epub 2006 Mar 1327. [DOI] [PubMed] [Google Scholar]
- 11.Lindhorst E, Wachsmuth L, Kimmig N, Raiss R, Aigner T, Atley L, et al. Increase in degraded collagen type II in synovial fluid early in the rabbit meniscectomy model of osteoarthritis. Osteoarthritis Cartilage. 2005;13:139–145. doi: 10.1016/j.joca.2004.10.017. [DOI] [PubMed] [Google Scholar]
- 12.Huebner JL, Kraus VB. Assessment of the utility of biomarkers of osteoarthritis in the guinea pig. Osteoarthritis Cartilage. 2006;14:923–930. doi: 10.1016/j.joca.2006.03.007. [DOI] [PubMed] [Google Scholar]
- 13.Mapp PI, Avery PS, McWilliams DF, Bowyer J, Day C, Moores S, et al. Angiogenesis in two animal models of osteoarthritis. doi: 10.1016/j.joca.2007.05.017. [DOI] [PubMed] [Google Scholar]
- 14.Glasson SS. In vivo osteoarthritis target validation utilizing genetically-modified mice. Curr Drug Targets. 2007;8:367–376. doi: 10.2174/138945007779940061. [DOI] [PubMed] [Google Scholar]
- 15.Ma HL, Blanchet TJ, Peluso D, Hopkins B, Morris EA, Glasson SS. Osteoarthritis severity is sex dependent in a surgical mouse model. Osteoarthritis Cartilage. 2007;15:695–700. doi: 10.1016/j.joca.2006.11.005. Epub 2007 Jan 2003. [DOI] [PubMed] [Google Scholar]
- 16.Ratcliffe A, Beauvais PJ, Saed-Nejad F. Differential levels of synovial fluid aggrecan aggregate components in experimental osteoarthritis and joint disuse. J Orthop Res. 1994;12:464–473. doi: 10.1002/jor.1100120403. [DOI] [PubMed] [Google Scholar]
- 17.Ratcliffe A, Shurety W, Caterson B. The quantitation of a native chondroitin sulfate epitope in synovial fluid lavages and articular cartilage from canine experimental osteoarthritis and disuse atrophy. Arthritis Rheum. 1993;36:543–551. doi: 10.1002/art.1780360416. [DOI] [PubMed] [Google Scholar]
- 18.Ratcliffe A, Azzo W, Saed-Nejad F, Lane N, Rosenwasser MP, Mow VC. In vivo effects of naproxen on composition, proteoglycan metabolism, and matrix metalloproteinase activities in canine articular cartilage. J Orthop Res. 1993;11:163–171. doi: 10.1002/jor.1100110203. [DOI] [PubMed] [Google Scholar]
- 19.Lindhorst E, Vail TP, Guilak F, Wang H, Setton LA, Vilim V, et al. Longitudinal characterization of synovial fluid biomarkers in the canine meniscectomy model of osteoarthritis. J Orthop Res. 2000;18:269–280. doi: 10.1002/jor.1100180216. [DOI] [PubMed] [Google Scholar]
- 20.Goranov NV. Serum markers of lipid peroxidation, antioxidant enzymatic defense, and collagen degradation in an experimental (Pond-Nuki) canine model of osteoarthritis. Vet Clin Pathol. 2007;36:192–195. doi: 10.1111/j.1939-165x.2007.tb00208.x. [DOI] [PubMed] [Google Scholar]
- 21.Kraus VB, Huebner JL, Fink C, King JB, Brown S, Vail TP, et al. Urea as a passive transport marker for arthritis biomarker studies. Arthritis Rheum. 2002;46:420–427. doi: 10.1002/art.10124. [DOI] [PubMed] [Google Scholar]
- 22.Huebner JL, Hanes MA, Beekman B, TeKoppele JM, Kraus VB. A comparative analysis of bone and cartilage metabolism in two strains of guinea-pig with varying degrees of naturally occurring osteoarthritis. Osteoarthritis Cartilage. 2002;10:758–767. doi: 10.1053/joca.2002.0821. [DOI] [PubMed] [Google Scholar]
- 23.Furman BD, Strand J, Hembree WC, Ward BD, Guilak F, Olson SA. Joint degeneration following closed intraarticular fracture in the mouse knee: a model of posttraumatic arthritis. J Orthop Res. 2007;25:578–592. doi: 10.1002/jor.20331. [DOI] [PubMed] [Google Scholar]
- 24.Bello AE, Garrett WE, Jr, Wang H, Lohnes J, DeLong E, Caterson B, et al. Comparison of synovial fluid cartilage marker concentrations and chondral damage assessed arthroscopically in acute knee injury. Osteoarthritis Cartilage. 1997;5:419–426. doi: 10.1016/s1063-4584(97)80046-5. [DOI] [PubMed] [Google Scholar]
- 25.Vilim V, Voburka Z, Vytasek R, Senolt L, Tchetverikov I, Kraus VB, et al. Monoclonal antibodies to human cartilage oligomeric matrix protein: epitope mapping and characterization of sandwich ELISA. Clin Chim Acta. 2003;328:59–69. doi: 10.1016/s0009-8981(02)00375-3. [DOI] [PubMed] [Google Scholar]
- 26.Clark AG, Jordan JM, Vilim V, Renner JB, Dragomir AD, Luta G, et al. Serum cartilage oligomeric matrix protein reflects osteoarthritis presence and severity: the Johnston County Osteoarthritis Project. Arthritis Rheum. 1999;42:2356–2364. doi: 10.1002/1529-0131(199911)42:11<2356::AID-ANR14>3.0.CO;2-R. [DOI] [PubMed] [Google Scholar]
- 27.Sharif M, Kirwan JR, Elson CJ, Granell R, Clarke S. Suggestion of nonlinear or phasic progression of knee osteoarthritis based on measurements of serum cartilage oligomeric matrix protein levels over five years. Arthritis Rheum. 2004;50:2479–2488. doi: 10.1002/art.20365. [DOI] [PubMed] [Google Scholar]
- 28.Momohara S, Yamanaka H, Holledge MM, Mizumura T, Ikari K, Okada N, et al. Cartilage oligomeric matrix protein in serum and synovial fluid of rheumatoid arthritis: potential use as a marker for joint cartilage damage. Mod Rheumatol. 2004;14:356–360. doi: 10.1007/s10165-004-0323-4. [DOI] [PubMed] [Google Scholar]
- 29.Kraus VB, Huebner JL, Stabler T, Flahiff CM, Setton LA, Fink C, et al. Ascorbic acid increases the severity of spontaneous knee osteoarthritis in a guinea pig model. Arthritis Rheum. 2004;50:1822–1831. doi: 10.1002/art.20291. [DOI] [PubMed] [Google Scholar]
- 30.Fujiki M, Shineha J, Yamanokuchi K, Misumi K, Sakamoto H. Effects of treatment with polysulfated glycosaminoglycan on serum cartilage oligomeric matrix protein and C-reactive protein concentrations, serum matrix metalloproteinase-2 and -9 activities, and lameness in dogs with osteoarthritis. Am J Vet Res. 2007;68:827–833. doi: 10.2460/ajvr.68.8.827. [DOI] [PubMed] [Google Scholar]
- 31.Salminen H, Perala M, Lorenzo P, Saxne T, Heinegard D, Saamanen AM, et al. Up-regulation of cartilage oligomeric matrix protein at the onset of articular cartilage degeneration in a transgenic mouse model of osteoarthritis. Arthritis Rheum. 2000;43:1742–1748. doi: 10.1002/1529-0131(200008)43:8<1742::AID-ANR10>3.0.CO;2-U. [DOI] [PubMed] [Google Scholar]
- 32.Chakravarti S, Magnuson T, Lass JH, Jepsen KJ, LaMantia C, Carroll H. Lumican regulates collagen fibril assembly: skin fragility and corneal opacity in the absence of lumican. J Cell Biol. 1998;141:1277–1286. doi: 10.1083/jcb.141.5.1277. [DOI] [PMC free article] [PubMed] [Google Scholar]
- 33.Funderburgh JL. Keratan sulfate: structure, biosynthesis, and function. Glycobiology. 2000;10:951–958. doi: 10.1093/glycob/10.10.951. [DOI] [PubMed] [Google Scholar]
- 34.Barry FP, Neame PJ, Sasse J, Pearson D. Length variation in the keratan sulfate domain of mammalian aggrecan. Matrix Biol. 1994;14:323–328. doi: 10.1016/0945-053x(94)90198-8. [DOI] [PubMed] [Google Scholar]