

Abstract
The purpose of our study was to determine the specific subtypes of protein kinase C involved in the neuroprotection afforded by retinal ischemic preconditioning (IPC), their relationship to the opening of mitochondrial KATP (mKATP) channels, and their role in apoptosis after preconditioning and ischemia. Rats were subjected to retinal ischemia after IPC, or retinas were rendered ischemic after pharmacological opening of mKATP channels. Using immunohistochemistry and image analysis, we determined cellular localization of PKC subtypes. We blocked PKC-δ and -ε to study the effect on protection with IPC or with IPC-mimicking by the opening of mKATP channels. PKC subtypes were inhibited pharmacologically or with interfering RNA. Electroretinography assessed functional recovery after ischemia. IPC was effectively mimicked by injection of diazoxide to open the mKATP channel. IPC and/or its mimicking were attenuated by the PKC-δ inhibitor rottlerin and by interfering RNA targeting PKC-δ or -ε. Using TUNEL staining and Western blotting for caspase-3 and fodrin breakdown we assessed apoptosis. The injection of interfering RNA to PKC-δ and -ε before preconditioning significantly enhanced TUNEL staining as well as the cleavage of caspase-3 and fodrin after ischemia. In summary, our experiments have shown that both PKC-δ and -ε subtypes are involved in the cellular signaling that results in neuroprotection from IPC and that both are downstream of the opening of mKATP channels.
Keywords: electroretinography, ischemic preconditioning, potassium ATP channels, protein kinase C, retinal ischemia
1. Introduction
Ischemic preconditioning (IPC) protects the rat retina against the deleterious effects of a severe ischemic event (Li and Roth, 1999; Li et al., 2000; Li et al., 2003; Roth et al., 1998). We have previously demonstrated that binding of adenosine to its receptors is a trigger for IPC (Li and Roth, 1999) and that downstream signal transduction factors, including mitochondrial KATP channels (mKATP), protein kinase C (PKC), reactive O2 species (ROS), nitric oxide synthase (NOS), and erythropoietin, are components of this neuroprotection (Junk et al., 2002; Roth et al., 2006). More recently, microarray analysis of different paradigms of retinal preconditioning show a number of retinal genes undergoing changes in gene expression (Kamphuis et al., 2007; Thiersch et al., 2008). However, the role of specific PKC isoforms in neuroprotection by IPC in the retina has not been examined, and the mechanisms linking opening of the mKATP channel and PKC have not been defined.
Rat retina has seven known PKC isoforms: α, β, δ, ε, θ, ζ, and λ (Wood et al., 1997). Their localization to distinct populations of retinal neurons (Fujisawa et al., 1992) implies that they serve specific functions. PKCα is associated with bipolar cells (Osborne et al., 1991) where it interacts with glutamate. PKCβ affects vascular perturbations in diabetic retinopathy (Aiello, 2002). Relatively little is known about localization of other PKCs. PKC-ζ has been localized to photoreceptors (Ghalayini et al., 1994) and -δ possibly to Müller cells (Osborne et al., 1995), but data are conflicting (Ghalayini et al., 1994; Moriarty et al., 2000). PKCδ may affect outgrowth of retinal ganglion cell (RGC) neurites (Rosdahl et al., 2002).
PKC-δ and -ε have been implicated in neuroprotection by IPC in cerebral cortex (Bright et al., 2004; Chou et al., 2004; Koponen et al., 2000; Kurkinen et al., 2001; Miettinen et al., 1996) and in myocardium (Dorn et al., 1999; Hassouna et al., 2004; Kawamura et al., 1998; Liu et al., 1999; Ping et al., 1997). IPC exerts its protective effect in part by attenuating apoptosis during reperfusion after ischemia (Zhang et al., 2002). Paradoxically, PKCδ activation has been associated with apoptosis in neutrophils via capase-3 activation (Pongracz et al., 1999) and in vivo after rat brain ischemia and reperfusion (Bright et al., 2004). Activation of PKCε has been associated with protection from apoptosis in myocardium and in glioma cells, in part by activation of the survival factor protein kinase B (Akt) (Malhotra et al., 2005; Okhrimenko et al., 2005; Tanaka et al., 2004). Our experiments tested the hypothesis that PKC-δ and -ε are integral components in retinal IPC protection from ischemic damage and in IPC-mimicking that is induced by the opening of mKATP channels.
2. Materials and methods
2.1 Immunohistochemistry
To examine cellular localization of PKC subtypes, eyes were removed from euthanized rats after IPC and evaluated using immunohistochemistry as previously described (Junk et al., 2002; Roth et al., 2006). Enucleated eyes were fixed at room temperature in 4% paraformaldehyde for 3 h. After removal of the anterior segment, the posterior portion of the eye was post-fixed in the same fixative overnight at 4°C before being placed in 25% sucrose for a second overnight period at 4°C for cryoprotection. Eyecups were embedded in OCT compound (Sakura Finetec, Torrance, CA) and were cut into 10-µm thick cryosections.
Primary antibodies (1:50 concentration) included rabbit polyclonal anti- PKCδ (Santa Cruz Biotechnology, Santa Cruz, CA), rabbit polyclonal anti- PKCε (Santa Cruz Biotechnology), mouse polyclonal GFAP (Sigma, St. Louis, MO), mouse polyclonal OX-42 (BD Pharmingen, San Diego, CA), mouse polyclonal syntaxin (Sigma), mouse polyclonal calbindin (Sigma), and biotin anti-rat Thy-1 (BD Pharmingen; (Roth et al., 2006). Sections were then exposed to the appropriate secondary antibodies: goat anti-rabbit IgG rhodamine-conjugate (1:500; Jackson ImmunoResearch, West Grove, PA), goat anti-mouse IgG fluorescein-conjugate (1:500; Southern Biotechnology, Birmingham, AL) or FITC-conjugated egg white avidin (1:500; Jackson Immunoresearch). Antifade mounting media containing DAPI (EMC Biosciences, La Jolla, CA) was applied and sections were cover-slipped. The antibody processing was standardized by utilizing standard antibody concentrations and antibody exposure times, of both the primary and secondary antibodies, in order to allow for the quantification of fluorescent intensities.
2.2 Ischemia methodology
Procedures (Roth et al., 2003; Roth et al., 2006) conformed to the Association for Research in Vision and Ophthalmology Resolution on the Use of Animals in Research and were approved by our Animal Care Committee. Sprague–Dawley rats (200–250 g) purchased from Harlan (Indianapolis, IN) were maintained on a 12 h on/12 h off light cycle and were dark adapted for at least 2 h before experiments. Before ischemia was induced, rats were anesthetized with choral hydrate, 450 mg/kg i.p. For baseline and postischemic follow-up electroretinograms, rats were injected i.p. with ketamine 35 mg/kg (Parke–Davis, Morris Plains, NJ) and xylazine 5 mg/kg (Miles, Shawnee Mission, KS). Corneal analgesia was achieved with 1–2 drops of 0.5% proparacaine (Allergan, Puerto Rico). Pupils were dilated with 0.5% tropicamide (Alcon, Humacao, Puerto Rico) and cyclomydril (0.2% cyclopentolate HCl and 1% phenylephrine HCl; Alcon, Fort Worth, TX). Body temperature was maintained at 36.5–37.0°C with a servo-controlled heating blanket (Harvard Apparatus, Natick, MA).
For preconditioning, the intraocular pressure (IOP) was increased to 160 mm Hg for 8 min using a pressurized 1000-ml plastic bag of sterile normal saline (Baxter, North Chicago, IL) connected to a 27-g needle placed in the anterior chamber of the eye. For ischemia, the IOP was increased to 110 mm Hg by elevating the saline reservoir above the eye for 45 min. The degree of IOP elevation differed for IPC and ischemia because in previous studies (Zhang et al., 2002) IPC protection was more consistently produced with a higher pressure for the required brief ischemic stimulus.
2.3 Electroretinography
Procedures used have been described in detail previously (Roth et al., 2003; Roth et al., 2006). In brief, the scotopic electroretinogram (ERG) was recorded from rats dark-adapted for at least 1 h before the experiments by placing platinum needle EEG electrodes (Grass, Providence, RI) in contact with the corneal surfaces of both eyes and a reference electrode on the tongue. Needles were bent to provide maximum longitudinal contact between the metal and cornea, completely avoiding contact between the sharp tip of the needle and the cornea. Electrode wires were embedded in putty, shaped specially for each rat, thus enabling recording of responses from the same contact point in the cornea throughout the experiment. The cornea was intermittently irrigated with a balanced salt solution (Alcon, Fort Worth, TX) to maintain adequate electrical contact and to prevent exposure keratopathy. Responses to 10-µs flashes of white light from a Nicolet Ganzfeld stimulator (Madison, WI) with the rat’s head centered 6 in from it were recorded on a Nicolet Spirit 486 system. The intensity of the unattenuated light flash was 0.75 log cd.s/m2, the high pass filter 1 kHz, and the low pass 1 Hz. Baseline b-wave amplitudes in both eyes were 800 to 1100 µV. Data presented are the average of three flashes delivered at least 2 min apart. ERG wave amplitudes were measured 7 days after ischemia and reported as a percentage of the baseline non-ischemic wave amplitude.
Stimulus-intensity ERG analysis was achieved on a UTAS-E 4000 ERG system with a full-field Ganzfeld stimulator (LKC Technologies, Gaithersburg, MD). The rat’s head was centered 7 in from the stimulator. The low pass filter was 0.05 Hz and the high pass 1500 Hz. Flash intensity was changed electronically from −3.39 log cd.s/m2 to 1.89 log cd.s/m2. Flash intensity settings were confirmed by photometric measurement using an EG & G Model 550 photometer (Electro-Optics, Boulder, CO). Responses were averaged for 10 to 3 flashes delivered 4 to 60 s apart depending upon flash intensity (lowest to highest intensities, respectively). Flashes were progressively delivered from the lowest intensity to the highest to prevent possible effect upon dark adaptation, and at least 1 min elapsed between the series of flashes for the three highest intensity settings. In preliminary experiments this timing was effective in preventing attenuation of dark adaptation.
2.4 RNA interference
The target sequences for the interfering RNA (siRNA) against PKCδ and PKCδ (Qiagen, Valencia, CA) are listed in Table 1. siRNAs were designed using neural-network technology as described previously (Huesken et al., 2005). Using BLAST, we found the siRNAs were 100% homologous to the mRNA sequence of the respective PKC subtypes. siRNA design was then checked for homology to all other sequences of the genome, 3’ UTR/seed analysis, single nucleotide polymorphisms, and interferon motif avoidance (Farh et al., 2005; Hornung et al., 2005; Judge et al., 2005); http://www1.qiagen.com/Products/GeneSilencing/HPOnGuardsiRNADesign.aspx). Sequences of the introduced siRNA are uniquely specific to the targeted gene (see reviews for more details; (Dorsett and Tuschl, 2004; Genc et al., 2004; Lehner et al., 2004; Mello and Conte, 2004). For in vivo experiments, a 2-µl mixture of four siRNA to PKCδ or PKCε, or a single negative control, non-silencing siRNA not corresponding to any known rat gene (Qiagen) in RPMI media (Invitrogen, Carlsbad, CA) and RNAiFect transfection reagent (Qiagen) at a final concentration of 3 µM was injected into the mid-vitreous of both eyes of the rats with a microsyringe (Hamilton, Reno, NV) as previously described (Roth et al., 2006).
Table 1.
siRNA Sequences Injected into the Vitreous
| PKCδ siRNA Target Sequences | PKCε siRNA Target Sequences |
|---|---|
| CCG ATT CAA GCT CTA TAA CTA | CGC GGA AAC ACC CTT ATC TAA |
| AAC GCT GCC ATC CAT AAG AAA | CCC GAC CAT GGT AGT GTT CAA |
| CCG GGT GGA CAC ACC ACA CTA | CCG GAA GGC CTT GTC ATT TGA |
| CGG CAT GAA TGT GCA CCA CAA | CCC GGG AAG AGC CAA TAC TTA |
2.5 Cell culture and immunocytochemistry
The PC12-T cell line was cultured in RPMI-1640 media supplemented with 10% heat-inactivated horse serum, 5% fetal bovine serum, Glutamax, penicillin, and streptomycin (Invitrogen) in a humidified 10% CO2 incubator at 37°C. Cells were differentiated for 48 h with the same culture medium that contained nerve growth factor (NGF) 100 ng/ml (Invitrogen). The cells were exposed to 400 nM siRNA in RPMI media with RNAiFect transfection reagent (Qiagen) for 48 h. Expression of the targeted proteins was then examined using immunocytochemical techniques. Cultured PC12-T cells plated on collagen-coated glass coverslips were fixed on ice with 4% paraformaldehyde/4% sucrose solution for 15 min. Cells were washed with ice-cold PBS and stored at 4°C in PBS with 10 mM sodium azide until immunostaining.
Primary antibodies used (at 1:2000 concentration) included rabbit polyclonal anti- PKCδ and rabbit polyclonal anti- PKCε (both from Santa Cruz Biotechnology). Cells were then exposed to goat anti-rabbit IgG fluorescein-conjugate (Invitrogen) secondary antibody (1:1000). Antifade mounting media with DAPI (EMC Biosciences) was applied and coverslips were sealed with nail polish and stored at 4°C.
2.6 Western blotting
Procedures were those we used in previous studies (Junk et al., 2002; Roth et al., 2003; Zhang et al., 2002). Retinas were rapidly dissected and frozen in liquid N2, and then crushed with a tissue pulverizer (Beckman, Fullerton, CA) on dry ice. Retinas were solubilized in 9 M urea, 4% Nonidet P-40, and 2% 2-mercaptoethanol (pH 9.5). Protease inhibitor cocktail (P8340; Sigma) consisting of 4-(2-aminoethyl) benzenesulfonyl fluoride, pepstatin A, bestatin, leupeptin, E-64, and aprotinin was added to prevent protease activity. Samples were centrifuged at 10,000g for 10 min. The supernatant was used for SDS-PAGE and the pellet was discarded. Protein concentration was determined using a modified Bradford assay (Bio-Rad, Hercules, CA).
Equal amounts of retinal protein per lane (40 µg) were diluted with SDS sample buffer and loaded onto gels for SDS-PAGE (4%–20% or 16%; Invitrogen). Proteins were electroblotted to polyvinylidene difluoride membranes (Immobilon-P; Millipore, Bedford, MA) and the efficiency of transfer confirmed by staining the membrane with Ponceau S red (Sigma). Non-specific binding was blocked with 5% nonfat dry milk in Tween-Tris-buffered saline (TTBS). Membranes were incubated overnight at 4°C with rabbit polyclonal anti- PKCδ (Santa Cruz), rabbit polyclonal anti- PKCε (Santa Cruz), rabbit polyclonal anti-caspase-3 (Stressgen, Ann Arbor, MI), and mouse monoclonal anti-fodrin (Chemicon, San Diego, CA) primary antibodies. Antibodies were prepared in 5% nonfat dry milk solution in TTBS.
Anti-rabbit horseradish peroxidase (HRP)-conjugated (goat IgG; Jackson ImmunoResearch) or anti-mouse HRP-conjugated (sheep IgG; Amersham, Buckinghamshire, England) secondary antibodies were applied at 1:20,000. Chemiluminescence was developed with a kit (Super Signal West Pico; Pierce, Rockford, IL). Protein bands were digitally imaged with a commercial system (CCDBIO 16SC Imaging System; Hitachi Genetic Systems/MiraiBio, Alameda, CA) and quantitated by densitometry (Gene Snap and Gene Tools software; Hitachi). Equal protein loading was checked by Ponceau S red staining of gels or by immunoblotting with mouse monoclonal anti-rhodopsin (clone Rho4D2 at 1:1500; a gift from Robert Molday, University of British Columbia, Victoria, British Columbia, Canada), or rabbit polyclonal anti-ERK (1:1000, Cell Signaling).
2.7 Fluorescent TUNEL staining
Fluorescent TUNEL staining was performed using a Fluorescein FragEL DNA Fragmentation Detection Kit (Calbiochem, La Jolla, CA) on frozen retinal sections as described previously (Singh et al., 2001; Zhang et al., 2002). Briefly, frozen tissue was fixed and hydrated in 4% formaldehyde followed by TBS immersion. After permeabilization with proteinase K in 10 mM Tris pH=8 (1:100), tissue was labeled using a TdT enzymatic reaction.
2.8 Imaging
For imaging of the fluorescently stained frozen retinal sections (immunohistochemistry and TUNEL) and PC12-T cells, we utilized a fluorescence microscope (Olympus IX81 inverted microscope), a Fast firewire Retiga EXi chilled CCD camera, and a 40X oil lens. Excitation/dichroic/emission settings were 480/40 nm-505LP-535/30 nm for rhodamine and 530–550 nm – 570DM-590LP for greens (FITC and fluorescein). Confocal microscopy was performed on an Olympus IX70 inverted microscope with dual scanning from 488 nm Ar and 543 nm He-Ne lasers. TUNEL positive cells were identified as previously reported (Singh et al., 2001; Zhang et al., 2002).
2.9 Image analysis
Quantification of the immunohistochemical and immunocytochemical fluorescent intensities was performed using NIH ImageJ v.1.33, adapted from our previous methods (Roth et al., 2003). The immunohistochemical results in retinal cryosections were quantitated by measuring the mean fluorescent intensity for the RGC, inner plexiform layer, inner nuclear and photoreceptor layers. Three 40X images, taken 200 µm apart in the same region of the retina, were measured and found to be repetitive. These measurements were thus averaged for the quantification. All measurements were obtained at the same laser intensity and time exposure for all paired experiments. For the PC12 cells, the mean intensity was determined for all single isolated cells in four random fields. The quantification of the TUNEL staining was achieved by averaging the percentage of TUNEL positive cells, via manual cell counts, in the RGC layer in three different images of the same retinal cryosections, as described for the fluorescent intensity measurements. The mean intensities and percentage of TUNEL positive cells were normalized to the fluorescent exposure levels of control non-silencing siRNAs.
2.10 Studies
To examine the role of PKCδ in retinal IPC, a dose-response study was performed using the relatively specific PKCδ antagonist rottlerin at 300 nM, 30 µM and 300 µM (Sigma, St. Louis, MO) (Corbit et al., 1999; Fryer et al., 2001) and a 0.5% DMSO control, injected into the vitreous of both eyes 15 min before IPC, followed by 45 min of ischemia in one eye 24 h later, using procedures described previously (Roth et al., 2006).
The roles of both PKC-δ and -ε were specifically examined using RNA interference. Specific siRNAs for PKC-δ or -ε, or a negative control siRNA (all at 3 µM concentration) were injected into the vitreous of both eyes 6 h before IPC, followed by 45 min of ischemia in one eye 24 h later.
In our previous study (Roth et al., 2006) we determined that opening mKATP channels by systemic injection of diazoxide mimics IPC. We injected diazoxide (Sigma, St. Louis, MO) at 40 mg/kg i.p. 24 h before 45 min of ischemia. To examine the role of specific PKC isoforms downstream from the mKATP channel, we injected the specific PKC siRNAs (see above for IPC experiments) 6 h before diazoxide administration.
2.11 Statistical analysis
Data (expressed as mean ± SEM) were analyzed as previously described, with ANOVA and post–hoc t testing using Stata version 6.0 (College Station, TX) (Roth et al., 2003; Roth et al., 2006). Results between paired eyes were compared using paired t tests, and between time-matched groups from different rats using an unpaired t test. P< 0.05 was used for statistical significance.
3. Results
3.1 PKC-δ and -ε cellular localization in the retina
To explore the cellular localization of PKCδ and PKCε in the retina, frozen sections of rat retina were studied by immunohistochemistry. We co-stained with the following antibodies to specific protein markers, along with the two PKC subtypes, for the co-localization study: 1) Thy1 for RGC’s, 2) GFAP for Műller cells, 3) syntaxin for amacrine cells, 4) OX-42 for microglial cells, and 5) calbindin for horizontal cells. Fig. 1 shows the co-localization of PKCδ with amacrine cells in the inner nuclear layer and displaced amacrine cells in the RGC layer (D), microglial cells (E), and horizontal cells (F). PKCε co-localized with Müller cells (I), amacrine cells (J), microglia (K), and horizontal cells (L). There was some co-localization in the RGCs (B,H) for both subtypes. Control sections for primary antibodies incubated with non-immune serum demonstrated no staining (not shown).
Fig. 1.

Co-localization of PKC subtype (red) and retinal cell markers (green) IPC, in the RGC and INL (white arrows). The orientation of retinal layers is indicated in A and G with the labeling of the cells by DAPI (blue). The fluorescent images utilized 40X oil magnification.
3.2 Pharmacological blockade of PKCδ by rottlerin blocks IPC
Intravitreal injection of rottlerin significantly attenuated the neuroprotective effect of IPC (Fig. 2). For control rats (n = 10) injected with vehicle (0.5% DMSO in PBS), functional recovery after IPC was 80 ± 4% (SEM) for the ERG a-wave and 68 ± 4% for the b-wave. Rottlerin at 300 nM (n = 4) produced a trend to blunt the protective effect on the recovery of both the a- and b-waves (a-wave 52 ± 10% and b-wave 42 ± 10%). Injection of 30 µM (n = 5) tended to attenuate the a-wave recovery (48 ± 18%), while significantly blunting the b-wave recovery (29 ± 10%, p < 0.02). Rottlerin 300 µM (n = 8) significantly inhibited IPC neuroprotection (a-wave 47 ± 8%, p < 0.005 vs vehicle and b-wave 35 ± 11%, p < 0.02 vs vehicle). However, the highest rottlerin dose, 300 µM, had deleterious effects on the non-ischemic control eye, decreasing the control a-wave amplitude to 68 ± 4% of baseline (p < 0.0001 vs DMSO- injected control) and the b-wave amplitude to 65 ± 4% of baseline (p < 0.00001 vs DMSO-injected control). At 300 nM and 30 µM, there was no effect of rottlerin on the control eyes.
Fig. 2.

The specific PKCδ antagonist, rottlerin, diminishes IPC neuroprotection in a dose-dependent manner. A. Representative ERG traces for the baseline and 7 days after ischemia. B. For the vehicle control (0.5% DMSO in PBS) injected rats (n = 10), functional recovery after IPC was 80 ± 4% (SEM) for the ERG a-wave and 68 ± 4% for the b-wave. Rottlerin at 300 nM produced a trend to blunt the protective effect on the recovery of both the a- and b-wave (a-wave 52 ± 10% and b-wave 42 ± 10%, n = 4). Injection of 30 µM tended to attenuate the a-wave recovery (48 ± 18%, n = 5), while significantly blunting the b-wave recovery (29 ± 10%, p < 0.02). Rottlerin at a dose of 300 µM significantly inhibited IPC neuroprotection (a-wave recovery 47 ± 8%, p < 0.005 vs vehicle and b-wave recovery 35 ± 11%, p < 0.02 vs vehicle; n = 8).
3.3 Retinal penetration of siRNA
Using a non-silencing rhodamine-labeled siRNA, we found widespread distribution of siRNA 24 h after injection and incorporation into specific retinal cells, including RGCs (Fig. 3). Moreover, co-localization with the green nuclear stain, sytox, showed that the labeled siRNA associated with RNA (Fig. 3B–D).
Fig. 3.
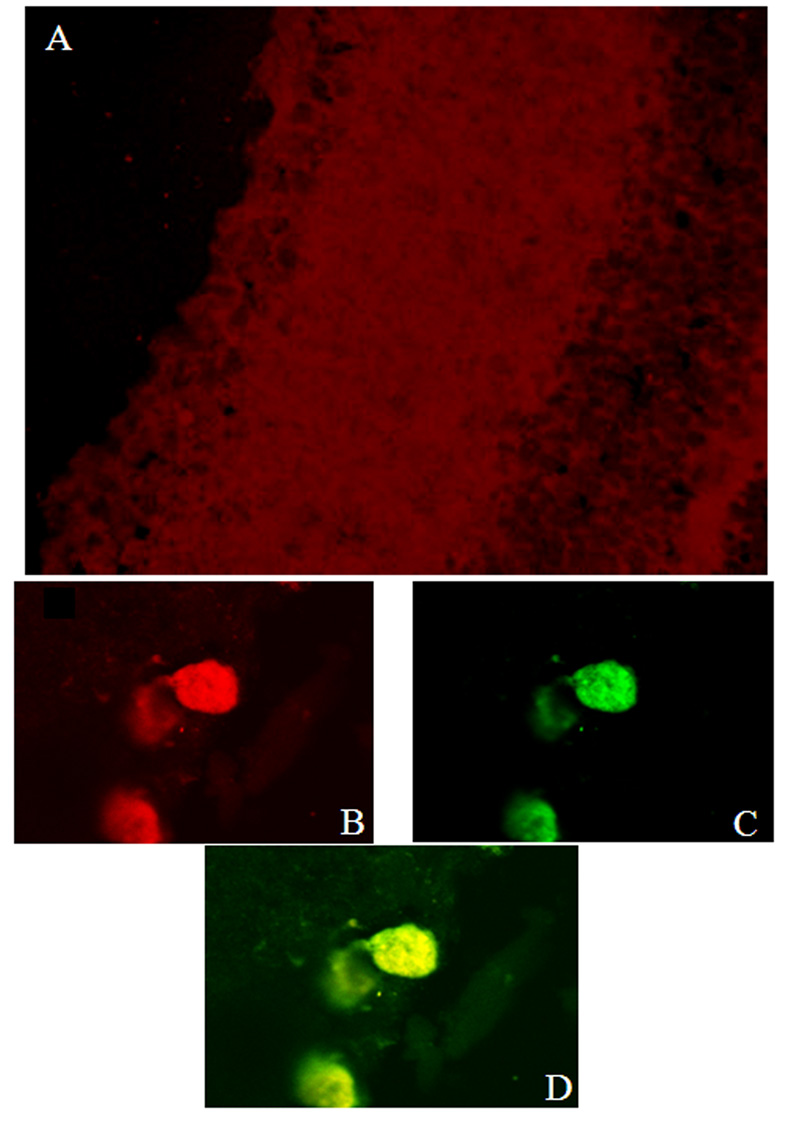
Confocal imaging of retina showing siRNA incorporation, 24 h after intravitreal injection of rhodamine-labeled siRNA. A. Rhodamine uptake can be seen throughout the inner retina, indicating extensive distribution of intravitreally injected siRNA. Sections were also exposed to sytox, a nucleic acid stain labeling DNA and RNA. The three lower images are digital zoom images of RGCs: B = rhodamine-labeled siRNA, C = sytox, D = combined. Yellow in D indicates siRNA in association with RNA in the RGCs.
3.4 siRNA to PKC-δ and -ε attenuate IPC
The injection of PKCδ siRNA (n = 11) significantly blunted the ERG recovery after IPC and ischemia in comparison to a non-silencing siRNA sequence (a- wave 24 ± 6% vs 87 ± 6%, p < 0.00001, and b-wave 21 ± 6% vs 60 ± 5%, p < 0.0001; Fig. 4). PKCε siRNA (n = 17) decreased recovery after IPC and ischemia, but to a lesser degree than PKCδ siRNA (a-wave 52 ± 8%, p < 0.003 vs non-silencing control siRNA and b-wave 41 ± 6%, p < 0.02 vs non-silencing control siRNA). Fig. 5A shows that the averaged ERG stimulus-intensity plots were consistent with the results of the single high intensity flash results.
Fig. 4.

PKC subtype siRNA attenuates IPC recovery. A. Representative ERG traces for the baseline and 7 days after ischemia. B. The injection of PKCδ siRNA significantly blunted the ERG recovery after IPC and ischemia in comparison to a non-silencing siRNA sequence (a-wave 24 ± 6% vs 87 ± 6%, p < 0.00001 and b-wave 21 ± 6% vs 60 ± 5%, p < 0.0001; both n = 11). PKCε siRNA decreased recovery after IPC and ischemia (a-wave 52 ± 8%, p < 0.005 vs non-silencing control siRNA and b-wave 41 ± 6%, p < 0.05, n = 17).
Fig. 5.
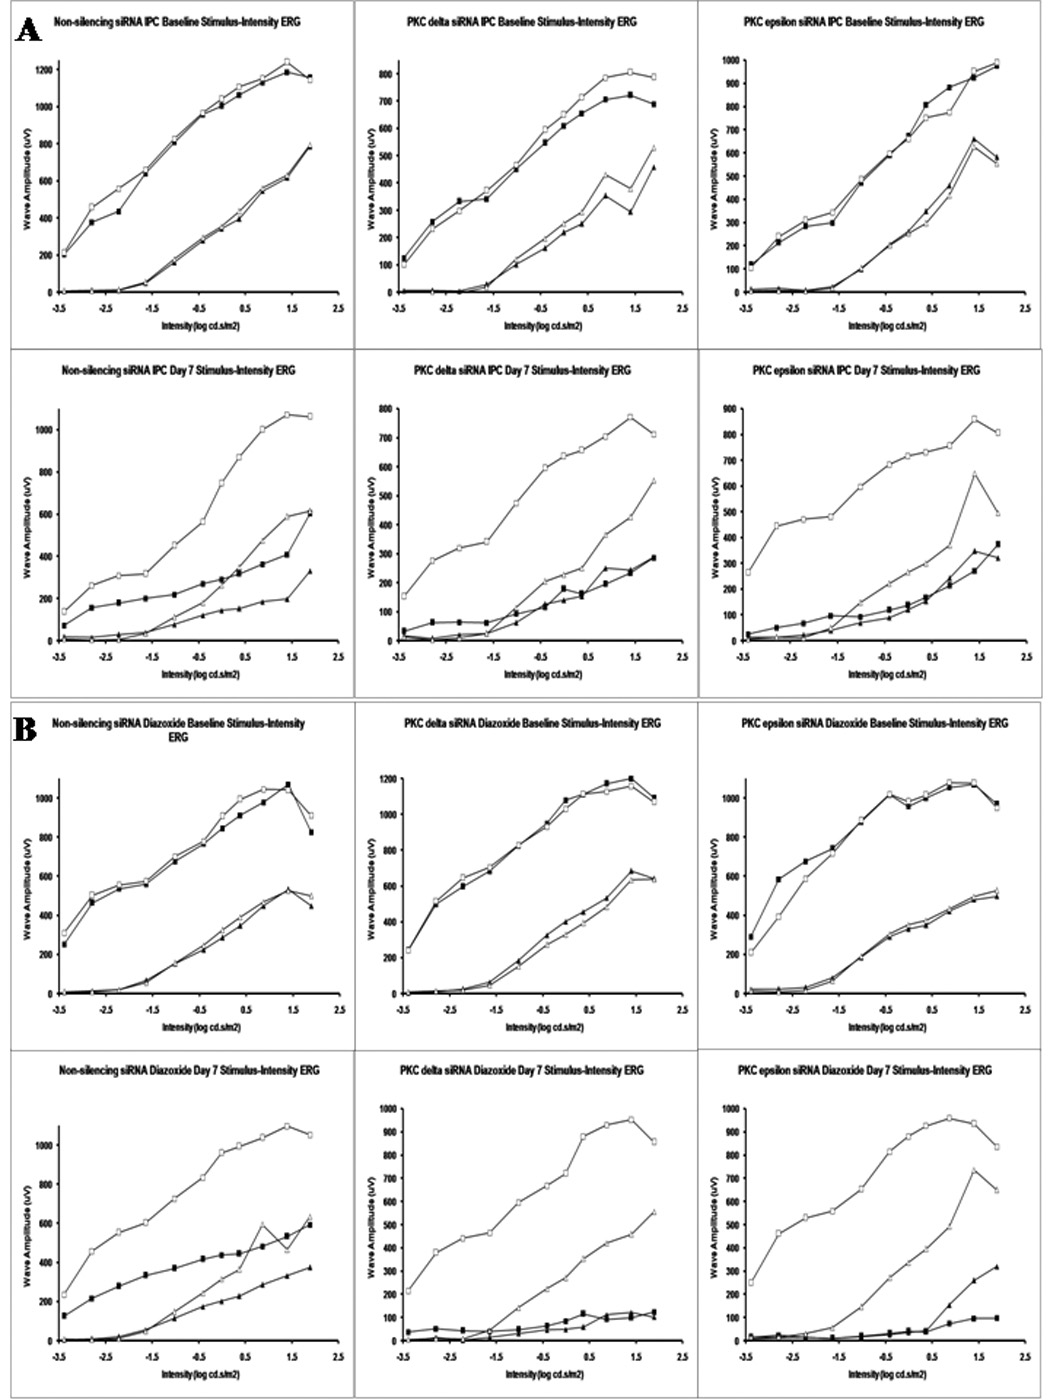
Stimulus-intensity ERG plots for PKC subtype siRNA. The open squares denote normal eye baseline a-waves and the open triangles the normal eye baseline b-waves. The filled squares denote the ischemic eye a-wave and the filled triangles the ischemic eye b-waves on day 7. A. shows the averaged stimulus intensity plots (n = 3) for the effect of the PKC subtype siRNA on IPC recovery. B. shows the averaged stimulus intensity plots (n = 3) for the effect of the PKC subtype siRNA on the recovery of IPC-mimicking by diazoxide.
3.5 siRNA to PKC-δ and -ε attenuate IPC-mimicking by diazoxide
PKCδ siRNA significantly inhibited the recovery of the ERG a- and b-waves after IPC-mimicking by diazoxide (40 mg/kg; i.p.) and ischemia (a-wave 45 ± 5%, p < 0.01, and b-wave 35 ± 4%, p < 0.05; n = 15) in comparison to a non-silencing control siRNA sequence ( a-wave 63 ± 4% and b-wave 46 ± 3%, n = 13, Fig. 6). PKCε siRNA also similarly decreased recovery after diazoxide injection and ischemia (a-wave 44 ± 6%, p < 0.05 and b-wave 31 ± 5%, p < 0.05, n = 10) in comparison to non-silencing control. The simultaneous injection of both PKCδ and PKCε siRNA did not further inhibit the recovery (a-wave 40 ± 6%, p < 0.01 and b-wave 31 ± 5%, p < 0.05, n = 10) in an additive/synergistic manner as compared to the non-silencing siRNA. Fig. 5B shows that the averaged ERG stimulus intensity plots for the non-silencing siRNA, PKCδ siRNA, and PKCε siRNA groups, both baseline and day 7 after ischemia, were consistent with the data derived from single high-intensity flashes.
Fig. 6.

PKC subtype siRNA attenuates IPC-mimicking by diazoxide. A. Representative ERG traces for the baseline and 7 days after ischemia. B. The injection of PKCδ siRNA significantly inhibited the recovery of the ERG a- and b-waves after IPC-mimicking by diazoxide (40 mg/kg; i.p.) and ischemia (a-wave 45 ± 5%, p <0.01 and b-wave 35 ± 4%, p<0.05; n = 15) in comparison to a non-silencing control siRNA sequence (a-wave 63 ± 4% and b-wave 46 ± 3%, n = 13). PKCε siRNA decreased recovery after diazoxide injection and ischemia (a-wave 44 ± 6%, p < 0.05 and b-wave 31 ± 5%, p<0.05, n = 10) in comparison to non-silencing control. The injected combination of siRNA for both PKC subtypes resulted in significant decrease in recovery for both the a-wave (40 ± 6%, 28 p < 0.01) and the b-wave (31 ± 5%, p < 0.05; n = 10), but was not greater than either siRNA alone. As a comparison the bar on the far right is the recovery of the DMSO vehicle control.
3.6 PKC-δ and -ε siRNA specificity
Western blotting for PKCε showed a doublet band at the expected 89 kD molecular weight. At 24 h after siRNA intravitreal injection, only the PKCε protein expression decreased (Fig. 7A), normalized to its paired eye, which had been injected with the non-silencing siRNA (25 ± 4% for one PKCε band and 47 ± 6% for the second Western blot band, p < 0.001; n = 4). We immunostained frozen retinal cryosections derived from paired retina in which one eye was injected with the non-silencing siRNA and the other with PKCδ siRNA. The PKCδ expression after 24 h was significantly decreased to 68 ± 11% of the values in the control group in the combined RGC and inner plexiform layers (p < 0.04; Fig. 7B).
Fig. 7.

PKC subtype siRNA efficacy. A. A Western blot of PKCε expression 24 h after intravitreal injection of PKCε siRNA showed a 25 and 47% decrease for the two PKCε bands. Expression of rhodopsin served as the control. B. Representative images of paired eyes injected with either the non-silencing siRNA or PKCδ siRNA. Quantification of the combined RGC and inner plexiform layers found that the PKCδ expression after 24 h was significantly decreased to 68 ± 11% of the non-silencing siRNA control group. C. The efficacy of gene targeting in PC12 cells by the PKC subtype-specific siRNA is depicted for PKCδ (I and II) and PKCε (III and IV). Decreased immunostaining with subtype-specific siRNA is shown (II and IV) as compared to non-silencing control siRNA (I and III) in PC12-T cells. Quantification of mean fluorescent intensities showed that PKCδ siRNA reduced protein levels by 22% and PKCε siRNA by 23% versus control siRNA.
The specificity of the PKC subtype specific siRNA was additionally examined in a PC12-T cell line by immunocytochemical analysis. PKCδ siRNA significantly decreased PKCδ protein expression to 78 ± 8% (p < 0.05, n = 6), normalized to non-silencing control siRNA after 48 h incubation. Similarly, PKCε siRNA attenuated expression to 77 ± 3% (p < 0.001, n = 4) versus the control siRNA. Representative images of the siRNA inhibition are shown in Fig. 7C.
3.7 PKC subtypes and apoptosis
The percentage of TUNEL positive cells in the RGC layer (Fig. 8 and Table 1) was significantly increased in the non-silencing siRNA sham IPC and ischemia group (4.3 ± 1.3% in normal retina to 24.3 ± 3.8% in ischemic retina, p = 0.0004), in the PKC subtype siRNA groups with IPC and ischemia from 1.8 ± 1.0% to 7.7 ± 2.6% for PKCδ (p = 0.05) and 2.5 ± 1.2% to 18.2 ± 5.7% for PKCε (p = 0.02). The non-silencing siRNA with IPC followed by ischemia showed the protective effect of IPC on apoptosis. Normal retinas had 7.7 ± 1.4% TUNEL positive cells as compared to 4.6 ± 1.5% for the ischemic retinas (NS).
Fig. 8.
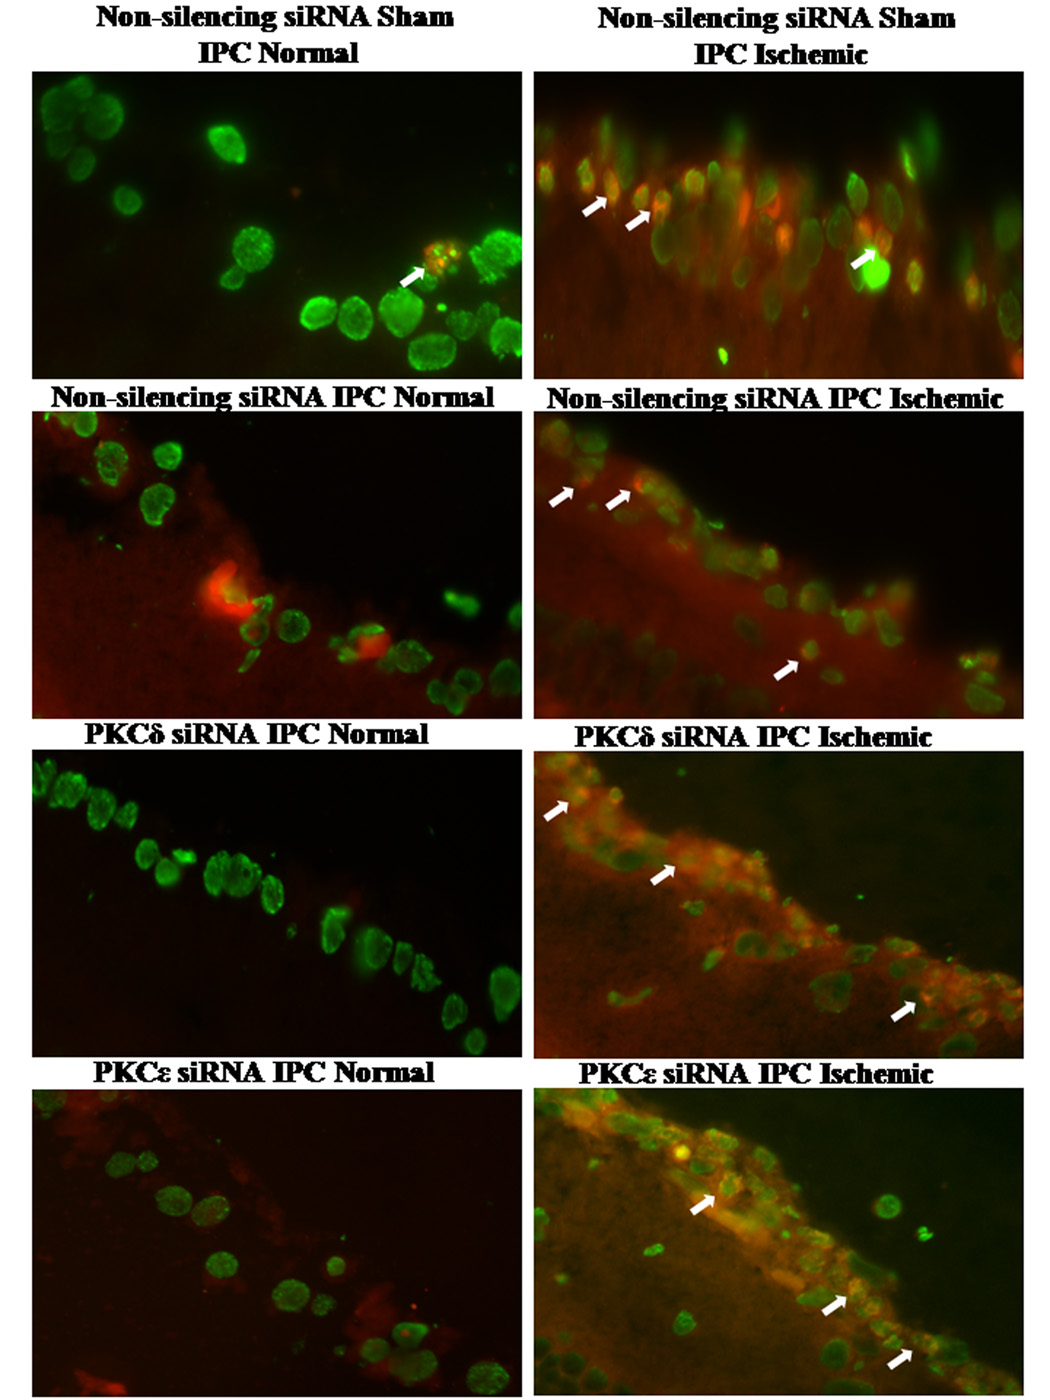
Fluorescent TUNEL staining and PKC subtype involvement in apoptosis. A shows representative images of the fluorescent TUNEL staining for the normal RGC layer (left) versus the ischemic (right). Images are shown with altered/false colors where the arrows denote co-localization of the fluorescent TUNEL stain (red) and the DAPI (green).
Fodrin protein expression was quantitated on Western blots (Fig. 9). The 120 kD fodrin, which is a caspase-3 breakdown protein product (Wang et al., 1998), increased to 203 ± 24% (p < 0.005; n = 8) with non-silencing siRNA / sham IPC followed by ischemia and 149 ± 14% (p < 0.005; n = 9) with non-silencing siRNA / IPC followed by ischemia, 294 ± 76% (p < 0.05; n = 6) with PKCδ siRNA /IPC and ischemia, and 216 ± 11% (p < 0.005; n = 6) with PKCε siRNA / IPC followed by ischemia. (All values are in comparison to control non-ischemic paired eyes). With PKCε siRNA / IPC followed by ischemia, 120 kD fodrin levels were significantly increased when compared to levels with non-silencing siRNA / IPC and ischemia (p < 0.003).
Fig. 9.

PKC subtype siRNA enhances fodrin protein expression. A. The fodrin protein expression was quantified on Western blots. Fodrin levels were significantly increased when normalized to the control retinas: 203 ± 24% (p < 0.005; n = 8) with non-silencing siRNA /sham IPC and ischemia, 149 ± 14% (p < 0.005; n = 9) with non-silencing siRNA /IPC and ischemia, 294 ± 76% (p < 0.05; n = 6) with PKCδ siRNA /IPC and ischemia, and 216 ± 11% (p < 0.005; n = 6) with PKCε siRNA/ IPC and ischemia. The PKCε siRNA / IPC and ischemia levels increased significantly compared to the non-silencing siRNA / IPC and ischemia 120 kD fodrin levels (p < 0.003). B. Representative Western blot bands for all three fodrin sizes and for ERK equal loading controls.
Cleaved caspase-3 protein (Fig. 10) increased when normalized to the control retinas to 140 ± 16% (p < 0.02; n = 9) for the non-silencing siRNA / sham IPC and ischemia group, 143 ± 17% (p < 0.02; n = 8) for the non-silencing siRNA / IPC and ischemia group, 526 ± 192% (p < 0.05; n = 6) for the PKCδ siRNA / IPC and ischemia group, and 467 ± 154% (p < 0.05; n = 6) for the PKCε siRNA / IPC and ischemia group.
Fig. 10.
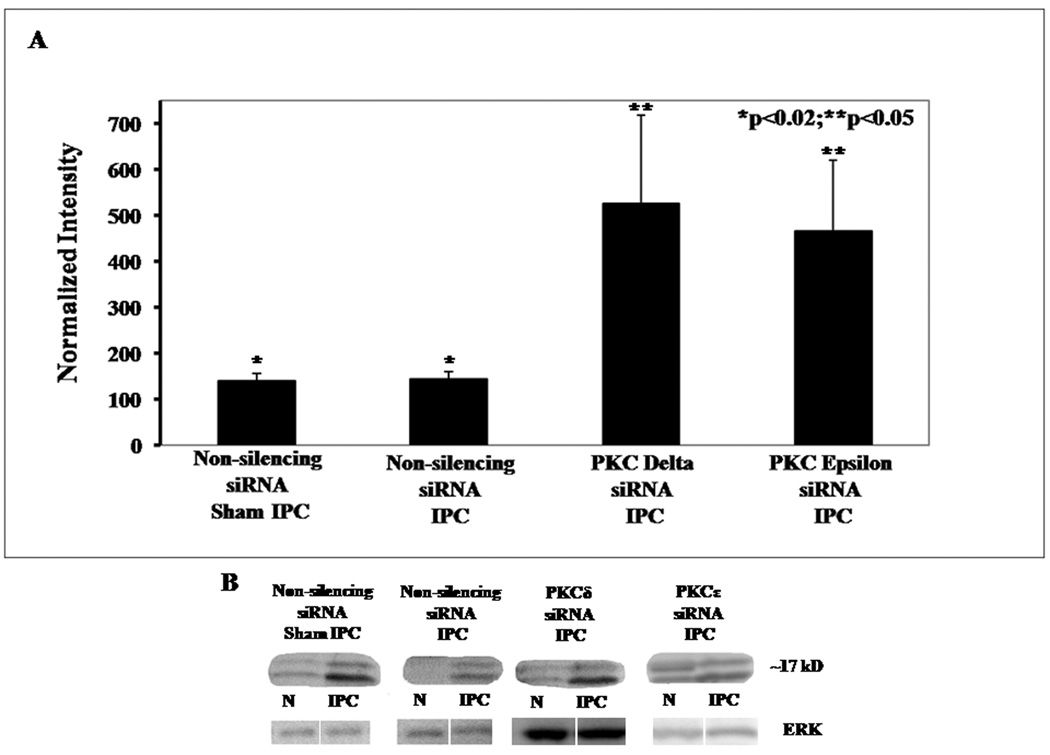
PKC subtype siRNA increases cleaved caspase-3 protein expression. A. Western blot analysis shows that expression of cleaved caspase-3 protein increases when normalized to the control retinas to 140 ± 16% (p < 0.02; n = 9) for the non-silencing siRNA / sham IPC and ischemia group, 143 ± 17% (p < 0.02; n = 8) for the non-silencing siRNA / IPC and ischemia group, 526 ± 192% (p < 0.05; n = 6) for the PKCδ siRNA /IPC and ischemia group and 467 ± 154% (p < 0.05; n = 6) for the PKCε siRNA / IPC and ischemia group. B. Representative Western blot bands for cleaved caspase 3 and for ERK equal loading controls.
4. Discussion
These results demonstrated the roles of the two PKC isoforms, -δ and -ε, in the retinal neuroprotective pathways initiated by IPC and IPC-mimicking by opening the mKATP channel with diazoxide. We have shown that 1) PKC-δ and -ε are localized to specific retinal cells; 2) the PKCδ inhibitor, rottlerin, inhibits retinal neuroprotection by IPC; 3) neuroprotection by both IPC and IPC-mimicking is attenuated by specific siRNA targeted against the two PKC isoforms; and 4) inhibition of the PKC subtypes by siRNA increases apoptotic retinal cell death.
A number of technical issues in the study should be mentioned. Rottlerin is commonly used as a PKCδ inhibitor; however, it is possible that its use in vivo affected other PKC subtypes. In addition, at the highest dose we used, rottlerin altered retinal function in the control, non-ischemic eyes. Hence, non-specific effects may have occurred at that dose. The combination of both PKCδ and PKCε siRNA did not inhibit the ERG recovery in an additive or synergistic manner, which was surprising given the significant effect of each alone. However, the recovery for the DMSO (i.p.) vehicle control, which is essentially an indication of ischemia alone, was at a similar level. Thus, the retinal damage at 7 days after ischemia may be at the maximum in our rat model. The penetration of the siRNA into the retina via the intravitreal injection indicated that the rhodamine-conjugated non-silencing siRNA co-localized with the nuclear marker sytox, denoting the presence of the siRNA in the nucleus of the RGC. However, it is possible that some sytox staining may be caused by reactivity to the siRNA itself in other extra-nuclear locations such as the cytoplasm.
The findings of our study further elucidate the sequence of intracellular signaling proteins in retinal IPC. We have previously described the involvement of adenosine receptors A1 and A2a (Li et al., 1999), several apoptotic proteins (Zhang et al., 2002), heat shock protein 27 (Li et al., 2003), mitogen-activated protein kinases (Roth et al., 2003), and mKATP channels (Roth et al., 2006). In those studies we showed that PKC is a signaling intermediary in IPC (Li et al., 2000). In this study we found that two specific PKC isoforms are part of the neuroprotective pathway of IPC and IPC-mimicking by diazoxide. Since rottlerin and siRNA targeted against PKC-δ and -ε attenuated the IPC-mimicking effect of diazoxide, PKC-δ and -ε must be functioning downstream of the opening of the mKATP channel.
Both PKCδ and PKCε protect neuronal (Bright et al., 2004) and cardiac tissues (Wang and Ashraf, 1999) subjected to ischemia. Mitochondria have been implicated in these protective pathways due to their role in ATP synthesis and maintenance of Ca2+ homeostasis. The PKC-δ and -ε isoforms interact specifically with mitochondria (Majumder et al., 2000; McCarthy et al., 2005; Ogbi and Johnson, 2006). IPC protection may be created by a transient increase in the concentration of Ca2+ in the mitochondria, which increases the activity of pyruvate dehydrogenase, isocitrate dehydrogenase, and α-ketoglutarate dehydrogenase- 3, enzymes key to the ATP synthesis pathway. The rise in ATP synthesis likely maintains intracellular Ca2+ which activates Ca2+ -independent PKC isoforms via the phospholipase C pathway and triggers their translocation to mitochondria (Bright et al., 2004; Uecker et al., 2003). Although functionally both are involved in IPC, they operate via different cell signaling pathways. PKCδ inhibits the visual transduction cascade at the G-protein and/or PLC stage (Dabdoub and Payne, 1999). PKCε has not been previously shown in photoreceptors, and we cannot define involvement in visual transduction from this study.
The cellular localization of PKCδ and PKCε in the retina as seen in Fig. 1, demonstrated the co-localization of PKCδ with amacrine cells, microglia, and horizontal cells and the co-localization of PKCε with Müller cells, amacrine cells, microglia, and horizontal cells. Co-localization assessed with Thy-1 labeling was minimal with RGCs for both subtypes; however, displaced amacrine cells co-localized in the RGC layer. This retinal localization may explain some of the protective actions of the PKC subtypes in the RGC layer.
PKC-δ and -ε have similar effects in various paradigms of ischemic damage (Chou et al., 2004; Dorn et al., 1999; Hassouna et al., 2004; Kawamura et al., 1998; Koponen et al., 2000; Kurkinen et al., 2001; Liu et al., 1999; Loubani et al., 2004; Miettinen et al., 1996; Ping et al., 1997). However, PKCδ activation has been associated with apoptosis in several studies (Bright et al., 2004; Pongracz et al., 1999). We showed that both PKC subtypes are effective in retinal IPC protection and IPC-mimicking by the activation of mKATP channels by diazoxide. TUNEL staining increased as did protein expression of the apoptotic markers cleaved caspase-3 and its target breakdown product, the 120 kD fodrin protein, when the PKC subtypes were blocked by siRNA. The results indicate that PKC-δ and –ε are essential factors for IPC’s ability to protect against apoptotic injury after ischemia. With respect to PKCδ, a protein thought to induce apoptosis can actually and paradoxically protect against apoptotic injury in the setting of ischemic preconditioning. Additionally, the 140–150 kD fodrin breakdown product was increased with both PKC subtype siRNAs (data not shown) suggesting that both subtypes may also protect against the proteolytic damage caused by calpain (Wang et al., 1998).
We injected a cocktail of “naked” siRNA directly into the vitreous, using a transfection reagent. There was minimal effect of the non-silencing siRNA on the IPC neuroprotection and IPC-mimicking by diazoxide, supporting the notion that our results with siRNA follow from specific effects. Retinal penetration was achieved in our studies. Specificity was shown by in vitro silencing of protein expression in PC12 cells and by in vivo decrease of protein expression on Western blots of whole retinal homogenates or immunostained retinal sections. In PC12 cells, the 20% reduction was significant. The dose of siRNA applied to the cells was 1/15 that injected into the vitreous, corresponding to the suspected retinal concentration after dilution with intravitreal injection (Li et al., 2000). Because the actual concentration of siRNA in the retinal cells is not known, the degree of gene silencing in PC12 cells may not be directly comparable to the results in vivo. The in vivo results showed between 25%–45% decreases in protein levels by siRNA injection. Despite incomplete blockade of the protein expression, effects on retinal function, numbers of apoptotic cells, and fodrin and caspase levels were significant. This suggests that only a small proportion of these proteins were functionally active, either because of sequestration or because they were rendered inactive by other proteins.
In conclusion, we showed that PKC-δ and -ε function in the neuroprotection induced by ischemic preconditioning in the rat retina. Both proteins are operative in in vivo signaling downstream from the opening of mKATP channels. Both PKC subtypes exhibit protective mechanisms that block the apoptotic damage caused by retinal ischemia.
Table 2.
Percentage (± SEM) of TUNEL Positive Cells in the Retinal Ganglion Cell Layer in siRNA-treated Retinas
| Normal Retinas | Ischemic Retinas | P-value | |
|---|---|---|---|
| Non-silencing siRNA + sham IPC | 4.3 ± 1.3 | 24.3 ± 3.8 | 0.0004 |
| Non-silencing siRNA + IPC | 7.7 ± 1.4 | 4.6 ± 1.5 | 0.1627 |
| PKCδ siRNA + IPC | 1.8 ± 1.0 | 7.7 ± 2.6 | 0.0544 |
| PKCε siRNA + IPC | 2.5 ± 1.2 | 18.2 ± 5.7 | 0.0204 |
Acknowledgments
Supported by National Institutes of Health grant EY10343 (SR), grants (SR and SKS) from the Illinois Society for the Prevention of Blindness (Chicago, IL), and the Office of Medical Education of the Pritzker School of Medicine (SKS). YS was the recipient of a Medical Student Research Fellowship from the American Academy of Neurology (Minneapolis, MN), and a Student Scholarship in Cerebrovascular Disease from the American Heart Association (Dallas, TX). Digital imaging was performed at the Digital Light Microscopy Facility, University of Chicago Cancer Research Center.
Footnotes
Publisher's Disclaimer: This is a PDF file of an unedited manuscript that has been accepted for publication. As a service to our customers we are providing this early version of the manuscript. The manuscript will undergo copyediting, typesetting, and review of the resulting proof before it is published in its final citable form. Please note that during the production process errors may be discovered which could affect the content, and all legal disclaimers that apply to the journal pertain.
References
- Aiello LP. The potential role of PKC beta in diabetic retinopathy and macular edema. Surv Ophthalmol. 2002;47:263–269. doi: 10.1016/s0039-6257(02)00391-0. [DOI] [PubMed] [Google Scholar]
- Bright R, Raval AP, Dembner JM, Perez-Pinzon MA, Steinberg GK, Yenari MA, Mochly-Rosen D. Protein kinase C delta mediates cerebral reperfusion injury in vivo. J Neurosci. 2004;24:6880–6888. doi: 10.1523/JNEUROSCI.4474-03.2004. [DOI] [PMC free article] [PubMed] [Google Scholar]
- Chou WH, Choi DS, Zhang H, Mu D, McMahon T, Kharazia VN, Lowell CA, Ferriero DM, Messing RO. Neutrophil protein kinase Cdelta as a mediator of stroke-reperfusion injury. J Clin Invest. 2004;114:49–56. doi: 10.1172/JCI21655. [DOI] [PMC free article] [PubMed] [Google Scholar]
- Corbit KC, Foster DA, Rosner MR. Protein kinase Cdelta mediates neurogenic but not mitogenic activation of mitogen-activated protein kinase in neuronal cells. Mol Cell Biol. 1999;19:4209–4218. doi: 10.1128/mcb.19.6.4209. [DOI] [PMC free article] [PubMed] [Google Scholar]
- Dabdoub A, Payne R. Protein kinase C activators inhibit the visual cascade in Limulus ventral photoreceptors at an early stage. J Neurosci. 1999;19:10262–10269. doi: 10.1523/JNEUROSCI.19-23-10262.1999. [DOI] [PMC free article] [PubMed] [Google Scholar]
- Dorn GW, Souroujon MC, Liron T, Chen C-H, Gray MO, Zhou HZ, Csukai M, Wu G, Lorenz JN, Mochly-Rosen D. Sustained in vivo cardiac protection by a rationally designed peptide that causes e protein kinase translocation. Proc Natl Acad Sci U S A. 1999;96:12798–12803. doi: 10.1073/pnas.96.22.12798. [DOI] [PMC free article] [PubMed] [Google Scholar]
- Dorsett Y, Tuschl T. siRNAs: applications in functional genomics and potential as therapeutics. Nat Rev. 2004;3:318–329. doi: 10.1038/nrd1345. [DOI] [PubMed] [Google Scholar]
- Farh KK, Grimson A, Jan C, Lewis BP, Johnston WK, Lim LP, Burge CB, Bartel DP. The widespread impact of mammalian MicroRNAs on mRNA repression and evolution. Science. 2005;310:1817–1821. doi: 10.1126/science.1121158. [DOI] [PubMed] [Google Scholar]
- Fryer RM, Wang Y, Hsu AK, Gross GJ. Essential activation of PKC-delta in opioid-initiated cardioprotection. Am J Physiol. 2001;280:H1346–H1353. doi: 10.1152/ajpheart.2001.280.3.H1346. [DOI] [PubMed] [Google Scholar]
- Fujisawa N, Ogita K, Saito N, Nishizuka Y. Expression of protein kinase C subspecies in rat retina. FEBS Lett. 1992;309:409–412. doi: 10.1016/0014-5793(92)80818-2. [DOI] [PubMed] [Google Scholar]
- Genc S, Koroglu TF, Genc K. RNA interference in neuroscience. Mol Brain Res. 2004;132:260–270. doi: 10.1016/j.molbrainres.2004.02.004. [DOI] [PubMed] [Google Scholar]
- Ghalayini AJ, Koutz CA, Wetsel WC, Hannun YA, Anderson RE. Immunolocalization of PKC zeta in rat photoreceptor inner segments. Curr Eye Res. 1994;13:145–150. doi: 10.3109/02713689409042409. [DOI] [PubMed] [Google Scholar]
- Hassouna A, Matata BM, Galinanes M. PKC-epsilon is upstream and PKC-alpha is downstream of mitoKATP channels in the signal transduction pathway of ischemic preconditioning of human myocardium. Am J Physiol. 2004;287:C1418–C1425. doi: 10.1152/ajpcell.00144.2004. [DOI] [PubMed] [Google Scholar]
- Hornung V, Guenthner-Biller M, Bourquin C, Ablasser A, Schlee M, Uematsu S, Noronha A, Manoharan M, Akira S, de Fougerolles A, Endres S, Hartmann G. Sequence-specific potent induction of IFN-alpha by short interfering RNA in plasmacytoid dendritic cells through TLR7. Nat Med. 2005;11:263–270. doi: 10.1038/nm1191. [DOI] [PubMed] [Google Scholar]
- Huesken D, Lange J, Mickanin C, Weiler J, Asselbergs F, Warner J, Meloon B, Engel S, Rosenberg A, Cohen D, Labow M, Reinhardt M, Natt F, Hall J. Design of a genome-wide siRNA library using an artificial neural network. Nat Biotech. 2005;23:995–1001. doi: 10.1038/nbt1118. [DOI] [PubMed] [Google Scholar]
- Judge AD, Sood V, Shaw JR, Fang D, McClintock K, MacLachlan I. Sequence-dependent stimulation of the mammalian innate immune response by synthetic siRNA. Nat Biotech. 2005;23:457–462. doi: 10.1038/nbt1081. [DOI] [PubMed] [Google Scholar]
- Junk AK, Mammis A, Savitz SI, Singh M, Roth S, Malhotra S, Rosenbaum PS, Cerami A, Brines M, Rosenbaum DM. Erythropoietin administration protects retinal neurons from acute ischemia-reperfusion injury. Proc Natl Acad Sci U S A. 2002;99:10659–10664. doi: 10.1073/pnas.152321399. [DOI] [PMC free article] [PubMed] [Google Scholar]
- Kamphuis W, Dijk F, Bergen AAB. Ischemic preconditioning alters the pattern of gene expression changes in response to full retinal ischemia. Mol Vis. 2007;13:1892–1901. [PubMed] [Google Scholar]
- Kawamura S, Yoshida K, Miura T, Mizukami Y, Matsuzaki M. Ischemic preconditioning translocates PKC-delta and -epsilon, which mediate functional protection in isolated rat heart. Am J Physiol. 1998;275:H2266–H2271. doi: 10.1152/ajpheart.1998.275.6.H2266. [DOI] [PubMed] [Google Scholar]
- Koponen S, Goldsteins G, Keinanen R, Koistinaho J. Induction of protein kinase Cdelta subspecies in neurons and microglia after transient global brain ischemia. J Cereb Blood Flow Metabol. 2000;20:93–102. doi: 10.1097/00004647-200001000-00013. [DOI] [PubMed] [Google Scholar]
- Kurkinen K, Keinanen R, Li W, Koistinaho J. Preconditioning with spreading depression activates specifically protein kinase Cdelta. Neuroreport. 2001;12:269–273. doi: 10.1097/00001756-200102120-00018. [DOI] [PubMed] [Google Scholar]
- Lehner B, Fraser AG, Sanderson CM. How to use RNA interference. Briefings in Functional Genomics and Proteomics. 2004;3:68–83. doi: 10.1093/bfgp/3.1.68. [DOI] [PubMed] [Google Scholar]
- Li B, Jennings NM, Rosenbaum PS, Maxwell KM, Roth S. Differential roles of adenosine receptor subtypes in retinal ischemia-reperfusion injury in the rat. Exp Eye Res. 1999;68:9–17. doi: 10.1006/exer.1998.0573. [DOI] [PubMed] [Google Scholar]
- Li B, Roth S. Retinal ischemic preconditioning in the rat: requirement for adenosine and repetitive induction. Invest Ophthalmol Vis Sci. 1999;40:1200–1216. [PubMed] [Google Scholar]
- Li B, Yang C, Rosenbaum DM, Roth S. Signal transduction mechanisms involved in ischemic preconditioning in the rat retina in vivo. Exp Eye Res. 2000;70:755–765. doi: 10.1006/exer.2000.0843. [DOI] [PubMed] [Google Scholar]
- Li Y, Roth S, Laser M, Ma JX, Crosson CE. Retinal preconditioning and the induction of heat-shock protein 27. Invest Ophthalmol Vis Science. 2003;44:1299–1304. doi: 10.1167/iovs.02-0235. [DOI] [PubMed] [Google Scholar]
- Liu GS, Cohen MV, Mochly-Rosen D, Downey JM. Protein kinase Cepsilon is responsible for the protection of preconditioning in rabbit cardiomyocytes. J Mol Cell Cardiol. 1999;31:1937–1948. doi: 10.1006/jmcc.1999.1026. [DOI] [PubMed] [Google Scholar]
- Loubani M, Hassouna A, Galinanes M. Delayed preconditioning of the human myocardium: signal transduction and clinical implications. Cardiovasc Res. 2004 Feb 15;:600–609. doi: 10.1016/j.cardiores.2003.10.013. [DOI] [PubMed] [Google Scholar]
- Majumder PK, Pandey P, Sun X, Cheng K, Datta R, Saxena S, Kharbanda S, Kufe D. Mitochondrial translocation of protein kinase C delta in phorbol ester-induced cytochrome c release and apoptosis. J Biol Chem. 2000;275:21793–21796. doi: 10.1074/jbc.C000048200. [DOI] [PubMed] [Google Scholar]
- Malhotra A, Begley R, Kang BP, Rana I, Liu J, Yang G, Mochly-Rosen D, Meggs LG. PKC-{varepsilon}-dependent survival signals in diabetic hearts. Am J Physiol. 2005;289:H1343–H1350. doi: 10.1152/ajpheart.01200.2004. [DOI] [PubMed] [Google Scholar]
- McCarthy J, McLeod CJ, Minners J, Essop MF, Ping P, Sack MN. PKCepsilon activation augments cardiac mitochondrial respiratory post-anoxic reserve--a putative mechanism in PKC epsilon cardioprotection. J Mol Cell Cardiol. 2005;38:697–700. doi: 10.1016/j.yjmcc.2005.02.010. [DOI] [PubMed] [Google Scholar]
- Mello CC, Conte D. Revealing the world of RNA interference. Nature. 2004;431:338–342. doi: 10.1038/nature02872. [DOI] [PubMed] [Google Scholar]
- Miettinen S, Roivainen R, Keinanen R, Hokfelt T, Koistinaho J. Specific induction of protein kinase C delta subspecies after transient middle cerebral artery occlusion in the rat brain: inhibition by MK-801. J Neurosci. 1996;16:6236–6245. doi: 10.1523/JNEUROSCI.16-19-06236.1996. [DOI] [PMC free article] [PubMed] [Google Scholar]
- Moriarty P, Dickson AJ, Erichsen JT, Boulton M. Protein kinase C isoenzyme expression in retinal cells. Ophthal Res. 2000;32:57–60. doi: 10.1159/000055590. [DOI] [PubMed] [Google Scholar]
- Ogbi M, Johnson JA. Protein kinase Cepsilon interacts with cytochrome c oxidase subunit IV and enhances cytochrome c oxidase activity in neonatal cardiac myocyte preconditioning. Biochem J. 2006;393:191–199. doi: 10.1042/BJ20050757. [DOI] [PMC free article] [PubMed] [Google Scholar]
- Okhrimenko H, Lu W, Xiang C, Hamburger N, Kazimirsky G, Brodie C. Protein kinase C-epsilon regulates the apoptosis and survival of glioma cells. Cancer Res. 2005;65:7301–7309. doi: 10.1158/0008-5472.CAN-05-1064. [DOI] [PMC free article] [PubMed] [Google Scholar]
- Osborne NN, Broyden NJ, Barnett NL, Morris NJ. Protein kinase C (α,β, and γ) immunoreactivity in rabbit and rat retina: Effect of phorbol esters and transmitter agonists on immunoreactivity and the translocation of the enzyme from cytosolic to membrane compartments. J Neurochem. 1991;57:594–604. doi: 10.1111/j.1471-4159.1991.tb03790.x. [DOI] [PubMed] [Google Scholar]
- Osborne NN, McCord RJ, Wood J. The effect of kainate on protein kinase C, GABA, and the uptake of serotonin in the rabbit retina in vivo. Neurochem Res. 1995;20:635–641. doi: 10.1007/BF01705529. [DOI] [PubMed] [Google Scholar]
- Ping P, Zhang J, Qiu Y, Tang XL, Manchikalapudi S, Cao X, Bolli R. Ischemic preconditioning induces selective translocation of protein kinase C isoforms epsilon and eta in the heart of conscious rabbits without subcellular redistribution of total protein kinase C activity. Circ Res. 1997;81:404–414. doi: 10.1161/01.res.81.3.404. [DOI] [PubMed] [Google Scholar]
- Pongracz J, Webb P, Wang K, Deacon E, Lunn OJ, Lord JM. Spontaneous neutrophil apoptosis involves caspase 3-mediated activation of protein kinase C-delta. J Biol Chem. 1999;274:37329–37334. doi: 10.1074/jbc.274.52.37329. [DOI] [PubMed] [Google Scholar]
- Rosdahl JA, Mourton TL, Brady-Kalnay SM. Protein kinase C delta (PKCdelta) is required for protein tyrosine phosphatase mu (PTPmu)-dependent neurite outgrowth. Mol Cell Neurosci. 2002;19:292–306. doi: 10.1006/mcne.2001.1071. [DOI] [PubMed] [Google Scholar]
- Roth S, Li B, Rosenbaum PS, Gupta H, Goldstein IM, Maxwell KM, Gidday JM. Preconditioning provides complete protection against retinal ischemic injury in rats. Invest Ophthalmol Vis Sci. 1998;39:775–785. [PubMed] [Google Scholar]
- Roth S, Shaikh AR, Hennelly MM, Li Q, Bindokas V, Graham CE. Mitogen-activated protein kinases and retinal ischemia. Invest Ophthalmol Vis Sci. 2003;44:5383–5395. doi: 10.1167/iovs.03-0451. [DOI] [PubMed] [Google Scholar]
- Roth S, Dreixler JC, Shaikh AR, Lee KH, Bindokas V. Mitochondrial potassium ATP channels and retinal ischemic preconditioning. Invest Ophthalmol Vis Sci. 2006;47:2114–2124. doi: 10.1167/iovs.05-1068. [DOI] [PMC free article] [PubMed] [Google Scholar]
- Singh M, Savitz SI, Hoque R, Rosenbaum PS, Roth S, Rosenbaum DM. Cell-specific caspase expression by different neuronal phenotypes in transient retinal ischemia. J Neurochem. 2001;77:466–475. doi: 10.1046/j.1471-4159.2001.00258.x. [DOI] [PubMed] [Google Scholar]
- Tanaka M, Terry RD, Mokhtari GK, Inagaki K, Koyanagi T, Kofidis T, Mochly-Rosen D, Robbins RC. Suppression of graft coronary artery disease by a brief treatment with a selective epsilonPKC activator and a deltaPKC inhibitor in murine cardiac allografts. Circulation. 2004;110:II194–II199. doi: 10.1161/01.CIR.0000138389.22905.62. [DOI] [PubMed] [Google Scholar]
- Thiersch M, Raffelsberger W, Frigg E, Samardzija M, Blank P, Poch O, Grimm C. The hypoxic transcriptome of the retina: identification of factors with potential neuroprotective activity. Adv Exp Med Biol. 2008;613:75–85. doi: 10.1007/978-0-387-74904-4_8. [DOI] [PubMed] [Google Scholar]
- Uecker M, Da Silva R, Grampp T, Pasch T, Schaub MC, Zaugg M. Translocation of protein kinase C isoforms to subcellular targets in ischemic and anesthetic preconditioning. Anesthesiology. 2003;99:138–147. doi: 10.1097/00000542-200307000-00023. [DOI] [PubMed] [Google Scholar]
- Wang KK, Posmantur R, Nath R, McGinnis K, Whitton M, Talanian RV, Glantz SB, Morrow JS. Simultaneous degradation of alphaII- and betaII-spectrin by caspase 3 (CPP32) in apoptotic cells. J Biol Chem. 1998;273:22490–22497. doi: 10.1074/jbc.273.35.22490. [DOI] [PubMed] [Google Scholar]
- Wang Y, Ashraf M. Role of protein kinase C in mitochondrial KATP channel-mediated protection against Ca2+ overload injury in rat myocardium. Circ Res. 1999;84:1156–1165. doi: 10.1161/01.res.84.10.1156. [DOI] [PubMed] [Google Scholar]
- Wood JP, McCord RJ, Osborne NN. Retinal protein kinase C. Neurochem Int l. 1997;30:119–136. doi: 10.1016/s0197-0186(96)00049-6. [DOI] [PubMed] [Google Scholar]
- Zhang C, Rosenbaum DM, Shaikh AR, Q L, Rosenbaum PS, Pelham DJ, Roth S. Ischemic preconditioning attenuates apoptosis following retinal ischemia in rats. Invest Ophthalmol Vis Sci. 2002;43:3059–3066. [PubMed] [Google Scholar]