

Abstract
The mammalian nucleus has a complex structural organization that dynamically interacts with the genome. Chromatin is organized into discrete domains by association with distinct nuclear compartments enriched in structural and regulatory proteins. Growing evidence suggests that gene activity is modulated by interactions with these sub-nuclear compartments. Therefore, analyzing how nuclear architecture controls genome activity will be necessary to fully understand complex biological processes such as development and disease. In this article we describe a molecular methodology involving inducible tethering that can be used to position genes at the inner nuclear membrane (INM)-lamina compartment. The consequences of such directed re-positioning on gene activity or other DNA transactions can then be analyzed. This approach can be generalized and extended to position genes or chromosomal domains within other nuclear compartments thereby greatly facilitating the analysis of nuclear structure and its impact on genome activity.
1. Introduction
The mammalian nucleus has a complex structural organization that dynamically interacts with the genome. Chromatin is organized into discrete domains by association with distinct nuclear compartments enriched in structural and regulatory proteins (1–4). Growing evidence suggests that gene activity is modulated by interactions with these sub-nuclear compartments (5–11). Such compartmentalization has been proposed to bring together genes whose transcription is coordinately regulated and also to focus proteins and enzymes involved in other DNA based transactions such as recombination, replication and repair. Therefore, analyzing how nuclear architecture controls genome activity will be necessary to fully understand complex biological processes such as development and disease (12). Indeed, recent evidence suggests that the non-random organization of chromosomes in the nucleus is a contributing factor in facilitating specific translocations and that disruption of nuclear architecture leads to a variety of diseases (13–15). While mounting evidence suggests that gene activity is regulated by nuclear compartmentalization, relatively little is known about how specific loci are directed to different nuclear domains and the molecular consequences of such organization. In fact, most of the studies to date have relied on cytological analysis of gene position and are, thus, correlative. In this article we describe a molecular methodology involving inducible tethering that can be used to position genes at the inner nuclear membrane (INM)-lamina compartment. The consequences of such directed re-positioning on gene activity or other DNA transactions can then be analyzed. This approach can be generalized and extended to position genes or chromosomal domains within other nuclear compartments thereby greatly facilitating the analysis of nuclear structure and its impact on genome activity.
Late replicating genes and gene-poor chromosomes tend to be located at the nuclear periphery, while early replicating genes and gene-rich chromosomes are more centrally disposed, suggesting that many inactive genes are located at the periphery of the nucleus (16–19). Our interest in this nuclear compartment was stimulated by the findings that germ-line immunoglobulin heavy chain loci (IgH) are preferentially localized to the nuclear lamina in hematopoietic progenitors and T lineage cells but centrally positioned in pro-B cells (20). Importantly, the inactive, lamina-proximal, IgH alleles in T cells did not co-localize with pericentromeric heterochromatin. These results led us to suggest that preferential association of the variable (V) gene segments of IgH loci with a distinctive compartment at the nuclear periphery in T lineage cells renders them inactive for transcription and DNA recombination. Additional studies have correlated the transcriptional activation of mammalian genes with their repositioning away from the nuclear periphery (21–23). However, until recently, no direct analysis of the proposed functions of this nuclear compartment in regulating gene activity had been undertaken.
In S. cerivisiae the nuclear periphery has been shown to function in both gene silencing and activation. In yeast cells, the nuclear periphery is enriched in foci of silencing information regulatory (SIR) proteins. These proteins mediate the repression of both telomere proximal and mating type loci which are spatially positioned at the nuclear periphery (24). However, relocating a gene to the nuclear periphery without the requisite cis acting elements (i.e. silencer elements) is not sufficient for transcriptional repression (25, 26). In contrast, association of yeast genes with nuclear pore complexes (NPC), which are embedded in the nuclear membrane, promotes their expression (27, 28). Thus, in yeast, the nuclear periphery is comprised of at least two sub-compartments that divergently regulate the activities of associated genes: a permissive or active compartment in and around the NPCs and a repressive compartment outside of the NPCs that is comprised of foci of SIR proteins.
The studies in yeast cannot be simply extrapolated to metazoan systems given their greater diversity of nuclear sub-compartments and higher complexity of chromosome organization. The nuclear periphery in metazoan cells differs substantially from its counterpart in yeast in that it is constituted by a unique set of inner nuclear membrane (INM) proteins and the nuclear lamina. Additionally, electron micrographs invariably reveal a non-contiguous band of electron dense heterochromatin around the periphery of mammalian nuclei, referred to as peripheral heterochromatin (29). Mammalian INM proteins include lamin B receptor (LBR), lamina associated peptide2 (Lap2) and emerin (30). These and other INM proteins interact with the nuclear lamina, which is comprised of a filamentous meshwork of proteins constituted by lamins A/C and B. LBR, emerin, and Lap2 have been shown to interact with transcriptional repressors (31). LBR can interact with heterochromatin protein 1 α (HP1α) and nucleosomes through the core histones H3 and H4, while emerin and Lap2β, which both contain a LEM (Lap2β, emerin, MAN1) domain, interact with Barrier to Auto-integration Factor (BAF), germ-cell-less (GCL), retinoblastoma protein (Rb) and HDAC3 (32–36). These findings are consistent with the hypothesis that this INM-lamina compartment functions in establishment and/or maintenance of transcriptionally inactive chromatin in mammalian nuclei. However, until recently no studies had directly tested this hypothesis (5, 6, 37).
Herein we describe a system, using a fluorescently labeled molecular tether, to study the consequences on gene activity after directed compartmentalization to the INM-lamina (5). The system consists of two components: an integrated chromosomal target construct containing binding sites for a tethering protein and a test DNA sequence e.g., a reporter gene. The second component is a recombinant tethering protein that is compartmentalized within the INM and can bind with high affinity in an inducible manner to DNA sites within the target construct. Related DNA tethering systems that also enable compartmentalization to the INM-lamina have been simultaneously developed by two other groups (6, 37). We detail our experimental system and compare and contrast its design with the other two and then summarize the consequences of positioning genes at the INM-lamina on their activity. Finally, we propose an extension of this methodology to enable positioning of genes or chromosomal domains within other nuclear compartments thereby facilitating the analysis of nuclear structure and genome function.
2. Design of a system for nuclear compartmentalization of genes
Traditional approaches have relied on two- or three-dimensional (2D or 3D) fluorescence in situ hybridization techniques to analyze the possible consequences of gene position in the nucleus with transcriptional activity. A major limitation of such studies is that they are correlative in nature and cannot directly test the molecular consequences of compartmentalizing genes within the nucleus. Ultimately, they leave unresolved alternative explanations e.g. a gene maybe re-positioned at the INM-lamina and then undergo repression as a consequence of this compartmentalization or the gene may undergo repression within the interior of the nucleus and then be re-positioned at the INM-lamina perhaps to stabilize a heterochromatin structure. To unambiguously analyze molecular consequences of nuclear compartmentalization one needs to design a system that enables the position of a gene or chromosomal domain within the nucleus to be experimentally manipulated preferably in a regulated manner. The design of such an experimental system is based on two components: the gene that is to be directed to a nuclear compartment needs to contain specific sites for a DNA binding protein (target construct). The DNA binding protein that recognizes sites in the target construct is in turn fused to a nuclear protein that is a constituent of the compartment to which the test gene is being targeted. After stable expression and proper compartmentalization, the fusion protein functions as a genomic DNA tether within the nucleus.
The LacI/lacO system has been widely used in mammalian cells to study chromosomal dynamics and chromatin decondensation (22, 38–40). We have extended this system to position integrated test genes at the INM (5). Our INM targeting construct includes a test gene with an iterated array of lacO DNA binding sites (256 copies). These arrays can be used to visualize and to tether the test gene to a specific nuclear compartment (Figure 1). The lacO sites are positioned downstream of the test gene to avoid inhibition of transcription due to binding of LacI fusion proteins (41). Previous studies have demonstrated that LacI binds to lacO sites with high affinity (Kd=10−10) and DNA binding is reversed upon incubation with the allosteric inhibitor Isopropyl β-D-1-thiogalactopyranoside (IPTG) (42, 43). Thus, this system provides for highly specific and stable DNA binding that is reversible. One could also use iterated tetO sequences and tetR fusion proteins in a similar manner (44).
Figure 1. Inducible system for directed compartmentalization of genomic regions.

The system is comprised of a targeting construct and a tethering protein. The targeting construct, which contains an array of lac operator sequences (lacO) and a test gene, is integrated into the genome. In this case, the tethering protein contains a domain of Emerin (ΔEMD) expressed as a fusion protein with GFP and LacI which targets to the INM (GFP-LacI-ΔEMD). LacI is able to bind to the lacO sequences in the targeting construct, but this binding is inhibited by the allosteric inhibitor, IPTG (red circles with X). GFP enables visualization of the tethering protein and tethered targeting constructs (See Figure 2 and 5). In the presence of IPTG, the target test gene is centrally disposed (right). Tethering of the integrated target construct is induced by withdrawal of IPTG (right).
The test gene used in our system encodes hygromycin resistance and is driven by the herpes simplex virus thymidine kinase promoter (HSV-TKhyg) (5). Transcriptional activity can be monitored by quantitative RT-PCR or RNA-FISH. The latter enables simultaneous analysis of nuclear position and gene activity in individual nuclei but is not quantitative. The Spector laboratory has developed a reporter gene whose activity can be visualized in individual nuclei encodes the fluorescent protein CFP and contains MS2 RNA repeats recognized by MS2-YFP (37, 45). For this reporter system activity levels can be measured by CFP fluorescence or MS2-YFP accumulation at sites of nascent transcription. Alternatively a reporter gene that encodes a destabilized fluorescent protein such as dsRed could also be used. This protein exhibits rapid turnover and its levels more accurately reflect transcriptional activity of the reporter gene. In addition, because of very low background, the use of a destabilized fluorescent protein enables quantitative single cell analysis of gene activity using fluorescence activated cell sorting (FACS).
Once the target construct has been integrated into the genome of the cell type of interest, it can be localized to a specific nuclear compartment via the use of a molecular tether. The tether is comprised of a protein domain that targets to a specific nuclear compartment and is fused in frame with LacI. To analyze the role of the inner nuclear membrane on gene activity, tethering molecules can be generated using domains of resident INM proteins fused to LacI. The resulting chimeric proteins are positioned at the INM and have the LacI DNA binding domain protruding into the nucleoplasm. In addition, these proteins can carry a GFP module to facilitate live cell imaging (Figure 2). Binding of LacI to the lacO repeats in the target construct results in its localization to the INM. We have utilized a domain of Emerin (ΔEMD) for targeting of genes to the INM, whereas another group has achieved similar results with Lap2β (5, 6). In both studies, the chimeric proteins were stably expressed in cells and they resulted in the recruitment of the target constructs to the INM upon removal of IPTG. An alternative approach, using inducible expression of a nuclear tethering protein has also been recently described (37). In this case, the molecular tether was constructed not based on an INM protein, but rather by fusing LaminB1 to LacI.
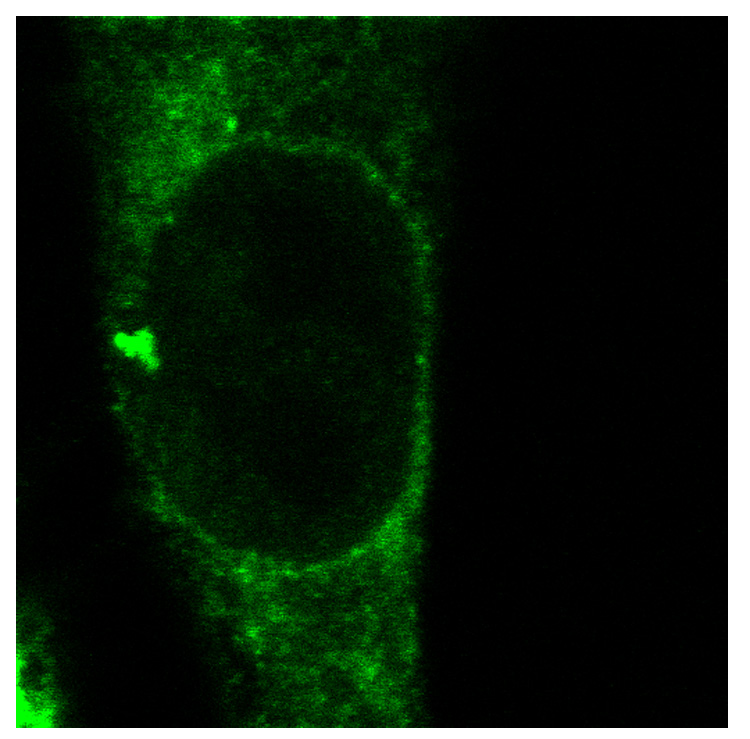
Figure 2. Live cell image of tethering constructs.

The tethering protein, GFP-LacI-ΔEMD, is readily visualized in live cells by fluorescence microscopy. Shown is a single confocal section at 100X magnification and 4X optical zoom.
3. Generation and maintenance of cell lines containing the target construct and the molecular tether
Stable cell lines to be used in the functional analysis of nuclear compartmentalization are generated by first introducing the target construct containing the iterated lacO DNA binding sites and the test gene. We along with other laboratories have employed a random integration method using transfection of linearized plasmids followed by selection for integrated constructs (Figure 3) (5, 6, 37). These cells containing one or more of the stably integrated target constructs are referred to as the parental cell line. Fluorescence in situ hybridization (FISH) is used to determine the number and location of insertion sites. Quantitative PCR can be used to ascertain copy number (5). The parental cell line is maintained in the proper selection medium for all subsequent manipulations. The tethering protein or its control derivative is introduced into the parental cell line using a different selectable marker. We use retroviral vectors to introduce these constructs into the genome and thereby stably express the tethering protein or its variants. The engineered cells are maintained in selection media in the presence of 2–4mM IPTG. The selection ensures the propagation of cells containing both components of the nuclear tethering system (the molecular tether and the target DNA) and IPTG prevents interaction between the two components until desired.
Figure 3. Design of the targeting construct.

The targeting construct contains an iterated array LacI binding sited (lacO) and a test gene that can be used both for selection and for functional analysis of nuclear compartmentalization. In this case, the test gene (Hygromycin) is driven by a ubiquitously active promoter element (HSV-TK) that utilizes endogenous transcription factors for its activation.
4 Experimental analysis of inducible nuclear compartmentalization
Once matching cell lines have been generated with the target construct and the tethering or control protein, the system is ready for experimental analysis. Initially, the control protein, GFP-LacI, should be used to demonstrate localized accumulation as foci at the integrated target construct upon withdrawal of IPTG (Figure 4). Routinely, foci are seen within 8 hours of withdrawal of IPTG. The number of foci observed per nucleus is dependent upon the number of insertion sites and also the copy number of integrants at each site. With a single insertion site containing two copies of a 256 lacO repeat we routinely detect foci in 25% of the cells. In a cell line containing approximately 25 integrations/site, we detect foci in all of the nuclei.
Figure 4. Positioning of integrated target constructs in a fibroblast nucleus detected by GFP-LacI.

GFP-LacI with a nuclear localization signal can be introduced into cells carrying the targeting construct. In the presence of IPTG, the protein displays a diffuse nucleoplasmic localization (left). Upon IPTG withdrawal (24 hours), the nucleoplasmic GFP-LacI protein forms foci by accumulating at lacO integration sites, thereby visualizing the initial configuration of the reporter genes (right). Shown are single confocal sections of live cells. Magnification 100X with a 4X optical zoom.
Once binding of GFP-LacI to the target construct has been demonstrated in vivo, similar experiments involving withdrawal of IPTG from cells expressing the molecular tether can be performed. This induces the appearance of GFP foci at the nuclear membrane in cells expressing a GFP-LacI protein fused to the Emerin segment (Figure 5). For recruitment to the INM, maximal tethering requires approximately twenty-four hours (or one cell division) after withdrawal of IPTG. For cells harboring multiple copies of the target construct at each insertion site, the tethered loci may be visible as distinct GFP foci. In cells with one or two copies of the target construct at the insertion site the GFP foci will not be readily visible and tethering needs to be demonstrated using Immuno-FISH (see below).
Figure 5. Tethering of integrated target constructs in a fibroblast nucleus detected by the tethering protein (GFP-LacI-ΔEMD).
The tethering protein, GFP-LacI-ΔEMD, is able to recruit the integrated targeting construct to the nuclear membrane. Accumulation of the tethering protein on the iterated arrays in the target construct allows for visualization of some of the tethering events. Shown are single confocal sections of live cells. Magnification 100X with a 4X optical zoom.
3D Immuno-Fish analysis enables quantitative measurements of tethering regardless of copy number of the target construct. In this case, co-localization of the target DNA and a nuclear compartment, demarcated with an antibody specific for a protein in that compartment, is measured by confocal microscopy (Figure 6 and 7). We analyze targeting to the INM-lamina compartment by using a lacO DNA probe and an antibody directed against laminB1 by 3D Immuno-FISH (Figure 7). In a given nuclear volume lacO and LMNB1 signal intensities are converted to histograms. lacO signals are scored as co-localizing with the nuclear lamina if their peak intensity overlaps with the LMNB1 distribution. We note that tethering of the target construct to the INM-lamina compartment requires an intervening mitosis.
Figure 6. Tethering of test genes and accumulation of the tethering protein at the INM can also be detected by 3D ImmunoFISH.

After tethering, large foci of tethering protein can be readily seen in some nuclei of living cells (Figure 5). These foci can also be detected by ImmunoFISH (LacI protein, green) and correspond to accumulation on the integrated target construct (lacO DNA, red). DAPI staining is shown in blue. Magnification 100X with a 4X optical zoom. A single confocal section is shown.
Figure 7. Quantitative analysis of tethered loci by 3D DNA-ImmunoFISH.

In the untethered state the lacO containing arrays are centrally positioned in the nucleus (upper panel). LaminB1 staining delineates the edge of the nucleus. In the tethered state the lacO containing arrays are found at the edge of the nucleus (lower panel). The optical plane shown in the lower panel is closer to the top of the nucleus than that sown in the upper panels. The lacO containing foci are found at the edge of the nucleus (arrow) and with small invaginations (arrowhead) of the nuclear membrane. Demonstration of co-localization with LaminB1 is necessary to determine efficiency of tethering.
Immunofluorescence analysis can also be used to identify tethering events or to demonstrate co-localization with other constituents of the nuclear compartment. In the latter case tethering of the target construct to the INM by an Emerin segment leads to the recruitment of both Lap2 and LaminB1 (5). Similarly, tethering to the nuclear lamina via laminB1 leads to the recruitment of Lap2 (37). Thus, tethering of genes to the INM-lamina appears to promote additional protein-protein interactions that may drive the assembly of this unique nuclear compartment.
To analyze the consequences of tethering to the INM-lamina on gene activity, one can use multiple methods. These include quantitative RT-PCR (Q-PCR), RNase protection, RNA-FISH and genome-wide microarray expression analysis (5, 6). The latter approach enables a determination of the effects of tethering of a chromosomal region to the INM on the activities of endogenous genes that flank the target construct. DNA adenine methyltransferase identification (DAM-ID) can be used to verify and probe protein-DNA interactions induced by tethering (5, 46). Finally, chromatin crosslinking and immunoprecipitation (ChIP) can be employed to characterize chromatin modifications that are promoted by re-positioning of the target DNA to the INM-lamina (5, 47).
5. Consequences of tethering to the INM-lamina
Three very similar systems have been recently described that enable recruitment of genes to the INM-lamina compartment (discussed above) (5, 6, 37). Our laboratory and that of W. Bickmore have demonstrated that recruitment of target genes to the INM-lamina results in transcriptional repression. Importantly, endogenous genes flanking the target construct were also repressed. Repression correlated with the loss of histone H4 acetylation, likely through the action of HDAC3, which associates with LEM domains of resident INM proteins (5, 6). In contrast, the Spector laboratory has demonstrated that genes recruited to the nuclear lamina remain competent for transcriptional activation (37). Their system was based on a LaminB-LacI protein that was used to recruit a large iterated DNA array constituted by 200 copies of the target construct to the nuclear lamina. In this system transcriptional competence was demonstrated by recruiting potent VP16 transcriptional activation domains to adjacent tetO sites in the arrays (96 sites per reporter gene). Thus, at least for especially potent transcriptional activators, the INM- lamina is permissive for transcription. While these results may seem contradictory, a model can be proposed in which the INM-lamina represses gene activity unless an especially potent transactivator is able to overcome the repression imposed by interactions with this compartment. This is in agreement with the growing list of developmentally controlled genes that are associated with the INM-lamina when they are transcriptionally inactive (8, 48–51). Developmental activation of these genes at the INM-lamina may require potent transactivators to interact with specific promoter and/or enhancer elements. Thus, we propose that the INM-lamina functions to establish and maintain a repressed state until specific transactivators relieve such transcriptional repression.
6. Concluding remarks
Nuclear compartmentalization appears to play an important role in regulating the activity of the mammalian genome. Directed tethering of genes or chromosomal domains to specific nuclear compartments provides a powerful method for exploring the impact of nuclear structure on gene activity. By extending the approach that we have described and generating different molecular tethers it should be possible to position genes or chromosomal domains within distinct nuclear compartments. This will enable rigorous tests of the functions of these compartments in regulating various DNA based transactions including transcription, replication, recombination and repair. Insights obtained from these studies will be highly useful in advancing our understanding of how the genome is regulated in three dimensions and will likely provide clues to diseases that appear to result from loss of genomic associations with specific nuclear compartments.
7. Methods
7.1 Design of tethering system
A. Design and preparation of the target construct
The target construct is the recombinant DNA molecule that is introduced into the genome to allow for repositioning of the adjacent chromosomal regions to the desired nuclear compartment via interactions with the tethering molecule (see section 2). The target construct is made by combining iterated binding sites for bacterial DNA binding proteins (e.g. LacI or TetR) with a gene for selection in mammalian cells (Figure 3). This construct is then linearized and transfected into mammalian cells to facilitate integration into the genome. Alternatively, one could introduce the target construct into a predetermined location via homologous recombination in ES cells. The minimum number of binding sites required for repositioning remains to be determined, however repositioning with 128 lacO sites has been demonstrated (5, 6). Care must be taken to ensure that the array of binding sites does not recombine during amplification of the target construct in bacteria. The following is a recommended protocol to obtain non-recombined clones suitable for introduction into mammalian nuclei.
Electroporate or chemically transform DNA containing iterated arrays into STBL2 (Invitrogen) or similar bacterial strains. The STBL2 bacteria are specifically engineered to handle repetitive and unstable DNA elements.
Plate transformed bacteria onto a 1.5% LB Agar plate containing the appropriate selection agent.
Grow at 32°C overnight (approximately 16 hours).
Pick 24 to 36 colonies and grow in 3 ml of LB medium with appropriate selection agent (e.g. Ampicillin) overnight at 32°C.
Prepare DNA from 2 ml of these overnight mini-cultures, reserving some of each culture on ice for inoculating large cultures.
Cut the prepared DNA with an restriction enzymes that release the entire array to yield two bands. It is important to cut out the entire intact array. If recombination has occurred, the array band will yield multiple bands or even a ladder.
From the DNA digests, pick three or four clones that appear to have non-recombined DNA to grow into large scale preps. Innoculate 250ml of LB medium containing selection agent (e.g. Ampicillin) with 500µl of reserved cultures. The remaining portion of the cultures can be frozen at −80°C in 50% glycerol/50% medium for future use.
Grow the large scale cultures overnight at 32°C and prepare DNA using standard methods. Verify integrity of the constructs as above. Freeze a portion (2ml) of the bacterial cultures containing intact plasmids at −80°C for future use (as above).
B. Design and generation of the tethering molecule
The tethering molecule is comprised of the LacI (or TetR) protein and a protein domain that targets specifically to a sub-nuclear compartment. This chimeric protein can bind the iterated lacO or tetO arrays in the target construct. In addition to the forementioned components, a GFP module can also be included in the fusion protein to facilitate observation via live cell microscopy. The choice of the protein domain to use for tethering should based on the following considerations. To test the function of a specific nuclear domain (and not the function of the tethering protein itself), care should be taken to select the protein domain necessary for proper localization but devoid of regions that interact with transcription factors of chromatin modifying complexes. To obtain efficient stable expression of the tethering molecule, we use a retroviral transduction system. We use either neomycin or puromycin genes as selectable markers, since our target constructs contain the hygR gene).
C. Generation and maintenance of cell lines
Electroporate or transfect linearized target construct into the cell line of choice.
After 48 hours, place cells under selection (e.g. HygromycinB at 500µg/ml). For adherent cells, let grow on plates to form colonies. For suspension cells, allow selection to proceed for 1 week, then plate a single cell in each well of a 96 well plate and expand.
Once colonies have grown out, isolate single colonies and expand further.
Verify integration of the target construct via PCR using primers specific for the integration. If using quantitative PCR, compare to a single copy gene to determine copy number.
Freeze down clones and store in liquid nitrogen. These are the parental cell lines.
Analyze location and number of integration sites by either transiently (transfection) or stably (transduction) expressing GFP-LacI in the cells. In the absence of IPTG, GFP-LacI will bind to the arrays and mark their location within the nuclei. GFP-LacI binds to the arrays quite rapidly and, once the protein is expressed, should be visible within 12 hours. With 2mM IPTG in the medium, binding is inhibited and no foci should be visible. Not all clones will have readily visible foci. With lower copy number insertions, as few as 10% of cells will exhibit foci. Higher copy number allows for more robust detection. If GFP-LacI is being stably expressed in the cell lines, maintain the cells at all times in 2mM IPTG. Only grow cells in the absence of IPTG when conducting an experiment. Cell lines containing GFP-lacI and the target construct should be frozen and kept in liquid nitrogen for future use as controls in experiments.
Choose clones that have integration sites that are positioned away from the compartment you wish to test. For instance, when studying the INM-lamina compartment, choose clones carrying integrations that are centrally disposed in the nuclear volume.
Thaw the parental cell lines of these clones and grow to 70–80% confluency. Introduce the tethering construct via retroviral transduction. Include 2mM IPTG in the medium at all times (including during the transduction). Apply selection for both the target construct (e.g. Hygromycin) and the tethering construct (e.g. Neomycin at 500µg/ml or Puromycin at 1µg/ml) to the medium after 48 hours and grow out cells. If desired, clonal cell lines can be established. These cells now contain both components of the tethering system: the target construct integrated into the genomic DNA and the inducible tethering protein that can recruit this DNA to a specific nuclear compartment in the absence of IPTG.
7.2 Tethering a genomic region to a nuclear compartment
A. Getting cells ready
Thaw cell lines and grow to 70–80% confluency. Thaw both cell lines containing the target construct plus control GFP-LacI and nuclear tether-GFP-LacI. Make sure to grow the cells in selection medium for both the target insert and the tethering construct. Propogate in 2 mM IPTG.
Once cells reach 70–80% confluency, plate into 6 well dish or onto coverslips (see below) for the experiment. For each cell type you will need at least two plates/coverslips at 50% confluency. Keep a maintenance flask of these cells in selection medium and IPTG.
B. Tethering
Once the plates or coverslips reach 50% confluency, remove medium replace with either medium plus 2mM IPTG or medium alone. Do not include selection reagents at this time. You should now have four plates. Three control plates: cells containing control protein (e.g. GFP-LacI) plus and minus IPTG and a plate with cells harboring the tether plus IPTG. The plate containing cells with tether in the absence of IPTG is the experimental.
Allow the cells to grow for 24 hours. Tethering to some compartments, such as the inner nuclear membrane, requires the cells to go through mitosis.
Analyze the cells as outlined below.
7.3 Detection of tethering via Immunofluorescence
Immunofluorescence can be used to analyze nuclear compartments with which the target constructs co-localize. Only target constructs that accumulate the tethering protein to sufficient levels will be detected by this method.
A. Getting your cells ready
Adherent cells—grow on coverslips or slides.
Suspension cells—attach to poly-L-lysine coated slides or coverslips
-
To poly-L-lysine coat slides (premade coated slides are available from Sigma)
Add a small amount (~20µl) of a 1mg/ml solution of poly-L-lysine to the end (away from frosted end) of the slide.
Take another slide and smear the solution to cover the entire length of the slide with a very thin coat of poly-L-lysine.
Let air dry for ~10 minutes.
Rinse with ddH2O and let air dry
-
To poly-L-lysine coat coverslips
Add ~300 µl of a 1mg/ml solution to the coverslip in the tissue culture dish. The solution should form a large drop on top of the coverslip
Let sit for 10 minutes
Remove solution (can be reused to coat other coverslips the same day) and rinse with ddH2O.
Air dry
Coverslips and slides for cells cultured more than a few hours should be sterilized by UV light in a Stratalinker (set time for 20 –30minutes). Place the slides or coverslips in a tissue culture dish (6 well plate for 25mm round coverslips, 24 well plate for 12mm round coverslips, larger dishes for slides) and with the lid open, expose to UV light. Immediately cover the dishes once UV irradiation is complete. We have cultured cells up to one week with dishes/slides treated this way with no contamination.
It is better to plate cells directly onto coverslips (rather than slides) for basic immunofluorescence studies since high power objectives on an inverted microscope have a limited working distance. By plating onto coverslips, the cells are as close to the objective as possible. If the cells are plated onto glass slides, the cells are farther away from the objective and may be difficult to image and are more readily affected by optical distortions such as spherical aberrations. In either case, it is important to use #1.5 coverslips since these are optically matched to all commercially available objectives.
IMPORTANT: CELLS SHOULD NEVER DRY OUT DURING THE FOLLOWING PROCEDURES
B. Fixation
Rinse cells with 1X PBS. This step may be omitted. You can add paraformaldehyde directly to the culture medium
Add 4% Parformaldehyde in 1X PBS to cells for 10 to15 minutes. This is empirically determined. A best first guess would be 10 minutes. For coverslips, fixation is performed in the tissue culture dish directly. Save this tissue culture dish for later washes. For slides, you will need to fix and rinse in coplin jars.
Rinse 3 times in 1X PBS (2–3 minutes each)
C. Permeabilization (required for detecting nuclear antigens)
Incubate coverslips or slides in 0.5% Triton-X-100 in 1XPBS for 10 minutes. Alternative permeabilization: 0.5% Triton-X-100, 0.5% Saponin (w/v) in 1X PBS
Rinse 3 times in 1X PBS ( a few minutes each time)
D. Blocking and primary antibody incubation
We routinely use 3–4% BSA in 1X PBS for virtually all immunofluorescence studies. Blocking with BSA usually gives the least background with control (no primary antibody) slides. Always filter sterilize this solution and add sodium azide after a week or so of storage at 4°C. This solution can be used for up to two months.
-
Block slides or coverslips for 1–2 hours at room tem perature in a humid environment. A humid environment can be created by soaking a paper towel in water or 1X PBS and placing this in the same covered container with your slides/coverslips.
For coverslips, put blocking solution on a piece of parafilm. Invert coverslip (i.e. cells facing down) onto the bubble of blocking medium so that it is floating on the solution. Use 50µl of block for 25mmRound coverslips, 20µl for 12mm coverslips
For slides, add blocking medium (200µl) to the surface of the slide. Cover with a 24×60mm coverslip. The coverslip should “float” on the surface of the slide.
Dilute antibodies in blocking solution. The dilution needed depends upon the antibody. It is best to test several dilutions the first time an experiment is done. Use the dilution that gives the best signal/noise ratio. A note of caution: one can not assume that dilutions used for FACS or Western blot analyses will be the same for immunofluorescence.
Prepare a new piece of parafilm and place the diluted antibodies onto this (as above). Gently remove the coverslips from the blocking solution and place them onto the diltuted antibody solutions. If the coverslips are difficult to remove from the parafilm, inject 100µl of blocking solution under the coverslip using a pipetman to float them off. Incubate for at least an hour at room temperature (once again in a humidified environment) or overnight at 4°C. For slides, gently let the coverslip from the blocking step slide off. Quickly add the diluted antibodies to the slides and cover with a coverslip.
Wash 3 times in 1XPBS for 10 minutes each. Coverslips are returned to the tissue culture dish (cell side up) and washed, while slides will need to be washed in coplin jars.
You can wash more “stringently” by including 0.05–0.1% Triton-X-100 in the 1XPBS used for washing. This can eliminate background problems.
E. Secondary Antibody detection and mounting
Dilute secondary antibody in the blocking solution. Expose cells to the antibodies as above (i.e. invert coverslips onto bubble of solution on parafilm, while solution is added on top of slides which are then coverslipped).
Incubate in a humidified chamber at room temperature for 1–2 hours. A good practice is to have all of your secondary antibodies made in the same animal (e.g all of ours are made in donkey) so that you will not run into cross reactivity problems.
Wash 3 times in 1X PBS with or without detergents (as above) for 10 minutes each. Once again, coverslips are returned to the tissue culture dish (cell side up) for these washes. Slides are washed in coplin jars.
Counterstain in DAPI (1/10,000 dilution in 1X PBS, 10mg/ml stock solution) for 2 minutes if desired. Rinse in 1X PBS.
-
Flick off excess PBS by tapping slide or touching coverslip on a paper towel.
For coverslips—add 20µl of Vectashield (Vector Laboratories) or Prolong Gold (Invitrogen) mounting medium to a glass slide. Invert the coverslip (cell side down) onto the drop. Blot excess mounting media from the slide by gently pressing with a paper towel. Seal with nail polish if necessary.
For slides, place 100–200µl of Vectashield (Vector Laboratories) or Prolong Gold (Invitrogen) mounting media to the slide and place a 24×60mm coverslip onto the slide. Blot excess media from the slide by gently pressing with a paper towel.
Slides should be left for a few hours prior to imaging. This allows the mounting media (which contains anti-fade reagents) to fully penetrate the cells. Limited observation before this time is okay—especially if you just want to check if your staining worked. Be very careful to avoid getting mounting medium on the microscope objectives. This can ruin the objectives and will at minimum result in the need for special cleaning.
7.3 Live cell analyses of tethering
Live cell analyses can be used to determine whether tethering is occurring and the dynamics of association. Only target constructs that accumulate the tethering protein to sufficient levels will be detected by this method.
A. Plating the cells
Cells are prepared for live cell imaging by plating on 25mm round coverslips.
Place coverslips in a 6 well dish (one coverslip per well). UV treat coverslips in a UV croslinker at full power for 20 minutes with the lid of the 6 well plate open. Alternatively, premade 35mm glass bottomed dishes can be used.
If using suspension cells, cover coverslip with 1mg/ml poly-L-lysine for 10 minutes (see section 7.2 for details). Wash with double distilled water and dry.
Plate cells at a density of 5×10⁴ to 1×10⁵ in 300µl. Under sterile conditions, puddle 300µl of cells on the center of each coverslip. Let stand for 5 minutes. Flood the well with media and let the cells grow overnight for experimental manipulation.
B. Imaging the cells
If using coverlips, place in chambers that fit 25mm round coverslips with HEPES buffered medium. Temperature is maintained by heating a small metal plate that is placed upon the stage with circulating water at 37°C or by using an environmental chamber. Viable cells can be maintained under these conditions, without CO2 circulation, for up to 6 hours. Alternative systems live cell imaging systems, such as Delta T from Bioptechs, can be utilized. Such systems usually require use of proprietary dishes and cell numbers will need to be scaled up or down accordingly.
Bodipy TR methyl ester and Hoechst 33342 (Invitrogen, Carlsbad, CA) can be added directly to the culture medium at a concentration of 1µM and 5µg/ml, respectively. Bodipy TR methyl ester detects all endomemebrane structures, including the inner nuclear membrane. Hoechst is a live cell DNA stain. After 10 minutes, remove the dye by replacing with fresh media.
Image cells on either a line scanning or spinning disk confocal microscope. Accumulation of the control protein (GFP-LacI) or the tethering protein (Tether-GFP-LacI) on the inserted target constructs should be visible if enough copies of the integrant are present (Figure 4 and 5).
7.4 3D ImmunoFISH for high resolution and quantitative analysis of tethering (adapted from Solovei et al.)(52)
3D ImmunoFISH allows for the simultaneous visualization of all of the integrated target constructs and selected protein components within the nucleus. This allows for quantitative analysis of tethering via measuring the efficiency of recruitment of the DNA to a particular nuclear compartment. Not all antigens survive the FISH procedure intact.
A. 3D ImmunoFISH Day 1: Preparing slides and making probes
-
Get cells onto slides
For suspension cells: .5-1 ×10⁶ cells in a 22mm diameter spot on poly-L-lysine coated slides (do it yourself or order from Sigma, see point 1 under Immunofluorescence).
For adherent cells: puddle on UV sterilized slides, let settle for 5–10 minutes, then flood with media. Let adhere overnight (or a few hours)
-
Fix cells
Before you fix your cells determine what the nucleus looks like before fixation. Using a viable nuclear stain such as Hoechst or Draq5, measure nuclear diameter and look at morphology. Throw this slide away.
Wash remaining slides 3 times in 1X PBS. Optional: if your cells shrink during normal fixation, you can hypotonically treat BRIEFLY in 0.3X PBS for 30 seconds to 1 minute.
Fix in 4% paraformaldehyde/1X PBS for 10 to 20 minutes. For fibroblasts we fix for 20 minutes, for lymphoid cells we fix for 10 minutes.
Wash 3 times for 5 minutes each in 1X PBS
-
First permeabilization
Make a FRESH solution of 0.5% TritonX 100/0.5% Saponin in 1X PBS
Incubate rinsed slides for 10 to 20 minutes in this solution
Rinse slides 3 times for 5 minutes each in 1X PBS
-
HCl treatment
Make 0.1 N HCl. Also make ~20% glycerol in 1X PBS (w/v).
Incubate for 10 minutes in 0.1N HCl. This can be increased to 20 minutes if there is difficulty in detecting the DNA probe. Increasing the time in HCl, however, can interfere with the detection of protein antigens.
Immediately place slides in 20% glycerol solution. Try to flick off excess HCl solution. Keep in glycerol solution for at least 1 hour. Proceed to Freeze/thaw (see below, 4b) or store overnight at 4°C.
Make probes according to standard nick translation protocols. Commercially available kits from Roche work quite well and provide quality assurance. For detecting target gene constructs, use the plasmid DNA generated in section 7.1. Make absolutely sure that the probe is between 200 and 700 b.p. (the majority of the probe). We have found that using digoxigenin and biotin labeled nucleotides for single copy genes works quite well. These are detected by fluorescently labeled anti-dig and avidin, respectively (Roche and Jackson ImmunoResearch Laboratories). For gamma satellite repeats and other high copy number regions, a directly labeled nucleotide (utilizing the Alexafluor conjugated nucleotides series from Invitrogen) work quite well (5).
B. 3D FISH Day 2
-
Freeze/Thaw
Remove slides from 4°C.
Fill a dewar or similar container with Liquid nitrogen to a depth that will allow full submersion of the glass slide.
With a large pair of tweezers/forceps pick up one slide from the coplin jar and dip the slide into the liquid nitrogen. Keep submerged until fully frozen. Usually you can hear a small “click”, approximately 3 seconds.
Place on a grid to fully thaw. A grid is made from plastic inserts used for fluorescent lights and can be found at any hardware store. Alternatively, place slides across two serological pipets placed parallel to one another. The idea is to keep the slides elevated above the benchtop.
Repeat for every slide.
Repeat 5 to 10 times for each slide, equilibrating briefly in the glycerol before freezing.
Place slides at −80°C in a plastic slide mailer if not using immediately.
-
Prepare probe (this is done in parallel with other procedures)
Take approximately 0.3µg of labeled DNA and add 3µg of Cot-1 DNA (Roche), 6 µg of Placental DNA (Sigma), and 9µg of Sonicated salmon sperm DNA (Roche) in a microfuge tube. These DNAs are CRITICAL to good hybridization since they are the only blocking agents used.
Precipitate DNAs by adding 1/10 volume 3M Sodium Acetate (pH 5) and 2.5 volumes ethanol at −80°C for 30 minutes to 1 hr. Spin for 20 minutes in a benchtop centrifuge at full speed at 4°C. A white pellet should be readily visible. Decant the supernatant and add 1ml of 70% ethanol. Spin for 5 minutes, decant the supernatant and let air dry for 15 to 30 minutes (the pellet should be clear).
Resuspend in hybridization buffer (50% deionized formamide/2–4X SSC/ 10% Dextran sulfate) by vortexing for 1 hour.
Denature probe mixtures at 80 to 94°C for 5 minutes.
Pre-anneal probe mixtures for 10 minutes-2hours at 37–42°C
-
RNase treatment
Rinse slides in 1X PBS 3 times.
Place slides in 2X SSC with 50–100µg/ml RNase (DNAse free) at 37°C for 1 hour (this can be done in a coplin jar or by pacing 200µl of solution on the slide and gently covering with a 24X66mm glas coverslip).
Rinse in 2X SSC and leave in this buffer until hybridization (if using coverslips, flick off coverslip first).
Optional: Slides can be pre-equilibrated in 50% Formamide 2XSSC for up to 1 week prior to hybridization at 4°C.
-
Denaturing/hybridization
Warm up slide warmer (37°C).
Prepare 50 ml formamide/2XSSC pH 7.0 and 50 ml 70% Formamide/2X SSC pH 7.0. Use deionized formamide (kept in frozen aliquots). If you are going to hybridize more than 4 slides, make two batches.
Place solutions in coplin jars and set water bath to 75–80°C. The temperature of the SOLUTION should be 75°C—this will allow for a denaturation temperature of 72°C—when you drop the slide in the temperature drops.
When the solutions are to temperature take ONE slide and place it into the 70% formamide solution for EXACTLY 3 minutes.
Immediately place into 50% formamide solution (75°C) for EXACTLY 1 minute.
Meanwhile, place 10µl of hybridization cocktail (containing probes) onto a 22mm square coverslip on the slide warmer set to 37°C.
Remove slide from 50% formamide solution and “flick” of excess liquid quickly.
RAPIDLY lower slide (cell side down) onto coverslip. Capillary action pulls the coverslip with the probes onto the slide. Flip over (cell/coverslip side up).
Seal with rubber cement and let sit on the slide warmer until rubber cement sets up.
Allow to hybridize overnight to several days with humidity at 37°C.
C. 3D ImmunoFISH Day 3: Detection of FISH probes
-
Washing of probes
Gently remove rubber cement from coverglass/slides and place slides in 2X SSC. Hold the coverslip in place with one finger if necessary. You want to avoid shearing the cells at this point.
Once all coverslips have been removed, wash slides in 50% Formaide/2X SSC at 42°C three times for 7 minutes each.
Wash 3 times for 7 minutes in 0.1–0.5X SSC at 63°C (empirically determined—typically we use 0.2X SSC). Decrease the salt concentration for a more stringent wash.
Block in 4% BSA/2X SSC for 30 minutes to 1 hour using coverslips to keep blocking solution on the hybridization area.
-
First detection step and wash
Add primary detection reagents at the appropriate concentration in blocking buffer. Also, if you are detecting a protein, add the primary antibody here. ** Note: be very careful of cross reactivity. Primary detection reagents include fluorochrome conjugated anti-digoxin or avidin to detect digoxigenin and biotin labeled probes, respectively (Roche and Jackson ImmunoResearch Laboratories). Alternatively, non-conjugated anti-dig and anti-avidin or biotinylated avidin can be used at this point if the signals need to be stronger. Secondary detection will need to be used to detect non-fluorochrome conjugated antibodies or avidin.
Wash in 2X SSC/0.1% triton-X-100 3 times for 5 minutes each at 37°C (also in the dark—wrap coplin jar with foil).
-
Second detection step and wash
Add secondary reagents for antibody detection. Add fluorochrome conjugated antibody raised against the primary antibodies in 2a. If you used non-conjugated anti-digoxin or avidin in step 2, you must add detection reagents here. Incubate for 1 hour.
Wash as in 2C.
-
Counterstaining and mounting
Place slides in 2X SSC
Dip slides for 30 seconds to 1 minute in 2X SSC plus DAPI (make a 10,000X stock of DAPI and then dilute it just before using)
Rinse and keep in 2X SSC until mounting.
Mount in Vectashield (Vector labs) or similar antifade reagent—try to remove as much SSC as possible by flicking the slide. Cover with a large coverslip and blot excess reagent. Add several drops of the mounting media directly onto the slide and gently lower the coverslip onto the slide at an angle to prevent bubbles from formin.
Store slides flat in the dark at 4°C until you use them for imaging.
Footnotes
Publisher's Disclaimer: This is a PDF file of an unedited manuscript that has been accepted for publication. As a service to our customers we are providing this early version of the manuscript. The manuscript will undergo copyediting, typesetting, and review of the resulting proof before it is published in its final citable form. Please note that during the production process errors may be discovered which could affect the content, and all legal disclaimers that apply to the journal pertain.
References
- 1.Taddei A, Hediger F, Neumann FR, Gasser SM. Annu Rev Genet. 2004;38:305–345. doi: 10.1146/annurev.genet.37.110801.142705. [DOI] [PubMed] [Google Scholar]
- 2.Spector DL. Annual Review of Biochemistry. 2003;72:573–608. doi: 10.1146/annurev.biochem.72.121801.161724. [DOI] [PubMed] [Google Scholar]
- 3.Misteli T. Cell. 2004;119:153–156. doi: 10.1016/j.cell.2004.09.035. [DOI] [PubMed] [Google Scholar]
- 4.Lanctot C, Cheutin T, Cremer M, Cavalli G, Cremer T. 2007;8:104–115. doi: 10.1038/nrg2041. [DOI] [PubMed] [Google Scholar]
- 5.Reddy KL, Zullo JM, Bertolino E, Singh H. Nature. 2008;452:243–247. doi: 10.1038/nature06727. [DOI] [PubMed] [Google Scholar]
- 6.Finlan LE, Sproul D, Thomson I, Boyle S, Kerr E, Perry P, Ylstra B, Chubb JR, Bickmore WA. PLoS Genet. 2008;4:e1000039. doi: 10.1371/journal.pgen.1000039. [DOI] [PMC free article] [PubMed] [Google Scholar]
- 7.Csink AK, Bounoutas A, Griffith ML, Sabl JF, Sage BT. Genetics. 2002;160:257–269. doi: 10.1093/genetics/160.1.257. [DOI] [PMC free article] [PubMed] [Google Scholar]
- 8.Kosak ST, Skok JA, Medina KL, Riblet R, Le Beau MM, Fisher AG, Singh H. Science. 2002;296:158–162. doi: 10.1126/science.1068768. [DOI] [PubMed] [Google Scholar]
- 9.Razin SV, Iarovaia OV, Sjakste N, Sjakste T, Bagdoniene L, Rynditch AV, Eivazova ER, Lipinski M, Vassetzky YS. J Mol Biol. 2007;369:597–607. doi: 10.1016/j.jmb.2007.04.003. [DOI] [PubMed] [Google Scholar]
- 10.Ragoczy T, Bender MA, Telling A, Byron R, Groudine M. Genes Dev. 2006;20:1447–1457. doi: 10.1101/gad.1419506. [DOI] [PMC free article] [PubMed] [Google Scholar]
- 11.Schlimgen RJ, Reddy KL, Singh H, Krangel MS. Nat Immunol. 2008;9:802–809. doi: 10.1038/ni.1624. [DOI] [PMC free article] [PubMed] [Google Scholar]
- 12.Misteli T. Cell. 2007;128:787–800. doi: 10.1016/j.cell.2007.01.028. [DOI] [PubMed] [Google Scholar]
- 13.Osborne CS, Chakalova L, Mitchell JA, Horton A, Wood AL, Bolland DJ, Corcoran AE, Fraser P. PLoS Biol. 2007;5:e192. doi: 10.1371/journal.pbio.0050192. [DOI] [PMC free article] [PubMed] [Google Scholar]
- 14.Mounkes L, Kozlov S, Burke B, Stewart CL. Current Opinion in Genetics & Development. 2003;13:223–230. doi: 10.1016/s0959-437x(03)00058-3. [DOI] [PubMed] [Google Scholar]
- 15.Verstraeten VL, Broers JL, Ramaekers FC, van Steensel MA. Curr Med Chem. 2007;14:1231–1248. doi: 10.2174/092986707780598032. [DOI] [PubMed] [Google Scholar]
- 16.Croft JA, Bridger JM, Boyle S, Perry P, Teague P, Bickmore WA. J Cell Biol. 1999;145:1119–1131. doi: 10.1083/jcb.145.6.1119. [DOI] [PMC free article] [PubMed] [Google Scholar]
- 17.Schermelleh L, Solovei I, Zink D, Cremer T. Chromosome Res. 2001;9:77–80. doi: 10.1023/a:1026799818566. [DOI] [PubMed] [Google Scholar]
- 18.Tanabe H, Habermann FA, Solovei I, Cremer M, Cremer T. Mutat Res. 2002;504:37–45. doi: 10.1016/s0027-5107(02)00077-5. [DOI] [PubMed] [Google Scholar]
- 19.Malhas A, Lee CF, Sanders R, Saunders NJ, Vaux DJ. J. Cell Biol. 2007;176:593–603. doi: 10.1083/jcb.200607054. [DOI] [PMC free article] [PubMed] [Google Scholar]
- 20.Kosak ST, Skok JA, Medina KL, Riblet R, Le Beau MM, Fisher AG, Singh H. Science. 2002;296:158–162. doi: 10.1126/science.1068768. [DOI] [PubMed] [Google Scholar]
- 21.Zink D, Amaral MD, Englmann A, Lang S, Clarke LA, Rudolph C, Alt F, Luther K, Braz C, Sadoni N, Rosenecker J, Schindelhauer D. J. Cell Biol. 2004;166:815–825. doi: 10.1083/jcb.200404107. [DOI] [PMC free article] [PubMed] [Google Scholar]
- 22.Chuang C-H, Carpenter AE, Fuchsova B, Johnson T, de Lanerolle P, Belmont AS. Current Biology. 2006;16:825–831. doi: 10.1016/j.cub.2006.03.059. [DOI] [PubMed] [Google Scholar]
- 23.Hewitt Susannah L, H Frances A, Reiner Steven L, Fisher Amanda G, Merkenschlager Matthias. European Journal of Immunology. 2004;34:3604–3613. doi: 10.1002/eji.200425469. [DOI] [PubMed] [Google Scholar]
- 24.Palladino F, Laroche T, Gilson E, Axelrod A, Pillus L, Gasser SM. Cell. 1993;75:543–555. doi: 10.1016/0092-8674(93)90388-7. [DOI] [PubMed] [Google Scholar]
- 25.Andrulis ED, Neiman AM, Zappulla DC, Sternglanz R. Nature. 1998;394:592–595. doi: 10.1038/29100. [DOI] [PubMed] [Google Scholar]
- 26.Taddei A, Hediger F, Neumann FR, Bauer C, Gasser SM. Embo J. 2004;23:1301–1312. doi: 10.1038/sj.emboj.7600144. [DOI] [PMC free article] [PubMed] [Google Scholar]
- 27.Taddei A, Van Houwe G, Hediger F, Kalck V, Cubizolles F, Schober H, Gasser SM. Nature. 2006;441:774–778. doi: 10.1038/nature04845. [DOI] [PubMed] [Google Scholar]
- 28.Schmid M, Arib G, Laemmli C, Nishikawa J, Durussel T, Laemmli UK. Molecular Cell. 2006;21:379–391. doi: 10.1016/j.molcel.2005.12.012. [DOI] [PubMed] [Google Scholar]
- 29.Lamond AI, Earnshaw WC. Science. 1998;280:547–553. doi: 10.1126/science.280.5363.547. [DOI] [PubMed] [Google Scholar]
- 30.Holmer L, Worman HJ. Cell Mol Life Sci. 2001;58:1741–1747. doi: 10.1007/PL00000813. [DOI] [PMC free article] [PubMed] [Google Scholar]
- 31.Burke B, Stewart CL. Nature Reviews Molecular Cell Biology Nat Rev Mol Cell Biol. 2002;3:575–585. doi: 10.1038/nrm879. [DOI] [PubMed] [Google Scholar]
- 32.Haraguchi T, Holaska JM, Yamane M, Koujin T, Hashiguchi N, Mori C, Wilson KL, Hiraoka Y. Eur J Biochem. 2004;271:1035–1045. doi: 10.1111/j.1432-1033.2004.04007.x. [DOI] [PubMed] [Google Scholar]
- 33.Haraguchi T, Koujin T, Segura-Totten M, Lee KK, Matsuoka Y, Yoneda Y, Wilson KL, Hiraoka Y. J Cell Sci. 2001;114:4575–4585. doi: 10.1242/jcs.114.24.4575. [DOI] [PubMed] [Google Scholar]
- 34.Holaska JM, Lee KK, Kowalski AK, Wilson KL. J. Biol. Chem. 2003;278:6969–6975. doi: 10.1074/jbc.M208811200. [DOI] [PubMed] [Google Scholar]
- 35.Somech R, Shaklai S, Geller O, Amariglio N, Simon AJ, Rechavi G, Gal-Yam EN. J Cell Sci. 2005;118:4017–4025. doi: 10.1242/jcs.02521. [DOI] [PubMed] [Google Scholar]
- 36.Polioudaki H, Kourmouli N, Drosou V, Bakou A, Theodoropoulos PA, Singh PB, Giannakouros T, Georgatos SD. EMBO Rep. 2001;2:920–925. doi: 10.1093/embo-reports/kve199. [DOI] [PMC free article] [PubMed] [Google Scholar]
- 37.Kumaran RI, Spector DL. J Cell Biol. 2008;180:51–65. doi: 10.1083/jcb.200706060. [DOI] [PMC free article] [PubMed] [Google Scholar]
- 38.Tumbar T, Belmont AS. 2001;3:134–139. doi: 10.1038/35055033. [DOI] [PubMed] [Google Scholar]
- 39.Tsukamoto T, Hashiguchi N, Janicki SM, Tumbar T, Belmont AS, Spector DL. Nat Cell Biol. 2000;2:871–878. doi: 10.1038/35046510. [DOI] [PubMed] [Google Scholar]
- 40.Tumbar T, Sudlow G, Belmont AS. J Cell Biol. 1999;145:1341–1354. doi: 10.1083/jcb.145.7.1341. [DOI] [PMC free article] [PubMed] [Google Scholar]
- 41.Choy HE, Adhya S. Proc Natl Acad Sci U S A. 1992;89:11264–11268. doi: 10.1073/pnas.89.23.11264. [DOI] [PMC free article] [PubMed] [Google Scholar]
- 42.Dong F, Spott S, Zimmermann O, Kisters-Woike B, Muller-Hill B, Barker A. J Mol Biol. 1999;290:653–666. doi: 10.1006/jmbi.1999.2902. [DOI] [PubMed] [Google Scholar]
- 43.Cronin CA, Gluba W, Scrable H. Genes Dev. 2001;15:1506–1517. doi: 10.1101/gad.892001. [DOI] [PMC free article] [PubMed] [Google Scholar]
- 44.Michaelis C, Ciosk R, Nasmyth K. Cell. 1997;91:35–45. doi: 10.1016/s0092-8674(01)80007-6. [DOI] [PubMed] [Google Scholar]
- 45.Janicki SM, Tsukamoto T, Salghetti SE, Tansey WP, Sachidanandam R, Prasanth KV, Ried T, Shav-Tal Y, Bertrand E, Singer RH, Spector DL. Cell. 2004;116:683–698. doi: 10.1016/s0092-8674(04)00171-0. [DOI] [PMC free article] [PubMed] [Google Scholar]
- 46.Vogel MJ, Peric-Hupkes D, van Steensel B. Nat Protoc. 2007;2:1467–1478. doi: 10.1038/nprot.2007.148. [DOI] [PubMed] [Google Scholar]
- 47.Bertolino E, Reddy K, Medina KL, Parganas E, Ihle J, Singh H. 2005;6:836–843. doi: 10.1038/ni1226. [DOI] [PubMed] [Google Scholar]
- 48.Lee H, Quinn JC, Prasanth KV, Swiss VA, Economides KD, Camacho MM, Spector DL, Abate-Shen C. Genes Dev. 2006;20:784–794. doi: 10.1101/gad.1392006. [DOI] [PMC free article] [PubMed] [Google Scholar]
- 49.Williams RR, Azuara V, Perry P, Sauer S, Dvorkina M, Jorgensen H, Roix J, McQueen P, Misteli T, Merkenschlager M, Fisher AG. J Cell Sci. 2006;119:132–140. doi: 10.1242/jcs.02727. [DOI] [PubMed] [Google Scholar]
- 50.Skok JA, Gisler R, Novatchkova M, Farmer D, de Laat W, Busslinger M. Nat Immunol. 2007;8:378–387. doi: 10.1038/ni1448. [DOI] [PubMed] [Google Scholar]
- 51.Skok JA, Brown KE, Azuara V, Caparros M-L, Baxter J, Takacs K, Dillon N, Gray D, Perry RP, Merkenschlager M, Fisher AG. 2001;2:848–854. doi: 10.1038/ni0901-848. [DOI] [PubMed] [Google Scholar]
- 52.Solovei I, Cavallo A, Schermelleh L, Jaunin F, Scasselati C, Cmarko D, Cremer C, Fakan S, Cremer T. Experimental Cell Research. 2002;276:10–23. doi: 10.1006/excr.2002.5513. [DOI] [PubMed] [Google Scholar]