Abstract
Although a small point ultrasound transducer has a wide acceptance angle, its small active area leads to a high thermal-noise-induced electric voltage in the transducer, thus the sensitivity is low. By contrast, a finite size flat transducer has high sensitivity, but the acceptance angle is small, which limits its application in reconstruction-based photoacoustic tomography (PAT). Here, we propose a negative lens concept to increase the acceptance angle of a flat transducer without losing sensitivity. Phantom experiments demonstrate that use of this concept greatly increases the detection region for PAT with high sensitivity.
I. INTRODUCTION
Photoacoustic (PA) tomography (PAT) acquires biomedical images by detecting ultrasound signals generated by tissues upon absorption of the radiation energy of a laser pulse [1, 2]. This imaging modality is non-invasive, non-ionizing, and it combines sensitive optical contrast and high acoustic resolution. PAT has been successfully applied in imaging both small animals and human tissues [3-5]. Among the many kinds of ultrasound detectors used for PAT [4, 6-8], single finite size flat transducers offer high sensitivity and simplicity, and they have provided good images in PAT [4, 9].
Single finite size flat transducers, however, generally have very limited angles of acceptance. From the principle of reciprocity, the radiation pattern of a transducer also describes the detection pattern of the transducer. Theoretically, the radiation pattern of the wave amplitude in the far field of a disk transducer with a radius of a can be described approximately by a circular baffled piston with directivity factor given as [10]
| (1) |
where J1 is the Bessel function of the first kind, k = 2π/λ (λ being the wavelength), and θ is the angle relative to the normal direction of the transducer surface. For example, Fig. 1 shows the directivity factor of a 6.35 mm diameter transducer immersed in water at a frequency of 2.25 MHz. The radiation power decreases more than 3 dB and 6 dB when the radiation angle is greater than 3.0 and 4.3 degrees, respectively, which demonstrates the small acceptance angle of the flat transducer.
FIG. 1.
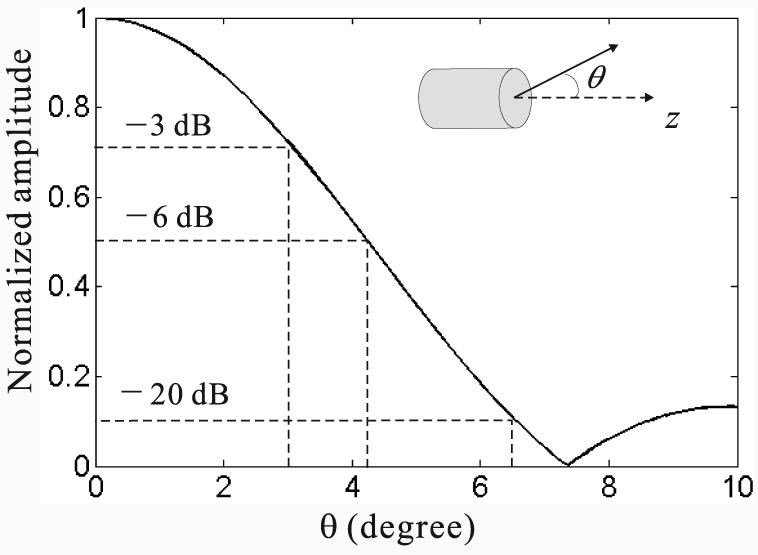
The directivity factor of a circular flat transducer with a radius α of 3.18 mm. The transducer has a center frequency of 2.25 MHz, and its corresponding center wavelength in water is 0.67 mm. The normal direction of the transducer surface is ẑ.
Only signals coming within the acceptance angle can be effectively detected, and thus the acceptance angle determines the detection region in PAT. As illustrated in Fig. 2, the light gray area represents the PA active region, which contains all PA sources illuminated by the laser. Although a single flat transducer can scan the entire activated region along the dash-lined circular trajectory facing the scanning center, the transducer's acceptance angle limits that only PA waves from the middle darker region propagating in all directions can be detected. This region defines the effective field of view (FOV) of the detection system.
FIG. 2.
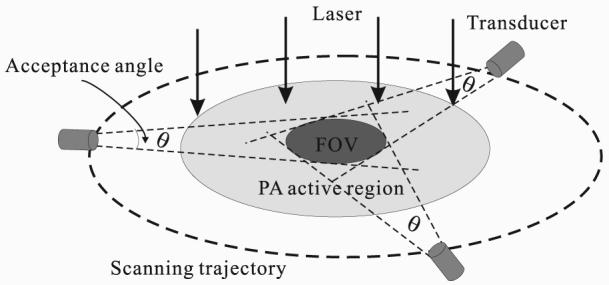
Photoacoustic active region and the field of view (FOV). A single flat transducer scans the PA source region along a circular trajectory. The transducer always faces the center of the scanning region. The PA active region (light gray area) contains the PA sources due to absorption of the illuminating radiation. The FOV corresponds to the overlap region of all detection areas, which are limited by the marked acceptance angles centered along the scanning trajectory.
PA sources outside the FOV may not be fully reconstructed due to possible signal losses at some view angles. To widen the FOV, we may increase the distance between the flat transducer and the PA active region at the expense of signal strength and convenience. In the next section, we present a negative lens concept to enlarge the acceptance angle of a single flat transducer. In the third section, we provide phantom experiments to demonstrate this method. In the last section, we conclude the work.
II. NEGATIVE LENS CONCEPT
A. Theoretical Concept
The goal is to enlarge the acceptance angle of a flat ultrasonic transducer. In optics, a light beam can be diverged by a negative lens. By analogy, an ultrasound wave can be diverged by the acoustic counterpart — an acoustic negative lens.
Ultrasound in PAT propagates in a medium, such as soft tissue, at a speed usually similar to the speed in water (1.5 mm/μs). The lens is typically made of solids, which have higher acoustic speeds than water, so the acoustic negative lens has a convex shape as shown in Fig. 3. By adding an acoustic negative lens over a flat transducer surface, the emitted acoustic wave can be diverged, which can be approximately described by Snell's law:
| (2) |
Thus, if v′ > v, we have θ′ > θ, and the wave will be diverged. While Snell's law accurately describes the refraction of the main lobe of the diffraction pattern, a full study of the wave diffraction is crucial for the image reconstruction as will be discussed in subsection II C.
FIG. 3.
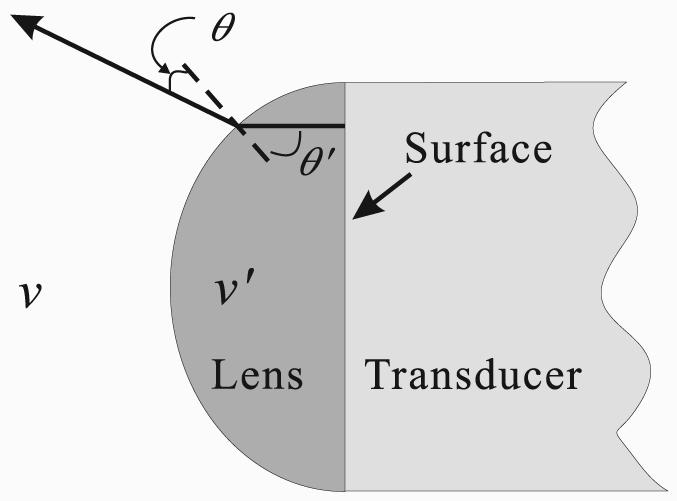
Geometry of an acoustic negative lens. v′ and v are the speeds of sound in the lens and surrounding medium, respectively. The divergence angle depends on the sound speeds, as well as the geometry of the lens.
B. Lens Construction
The lens material, acrylic plastic, has an acoustic speed of 2.75 mm/μs and a density of 1.19 g/cm3. The lens was made by cutting a rod with a diameter of 12.7 mm and a height of 12.7 mm in half along its axis. Then it was epoxied to the surface of a flat transducer, as shown in Fig. 4, making a negative cylindrical lens. The transducer's active area, with a 6.35 mm diameter, is completely covered by the negative lens.
FIG. 4.
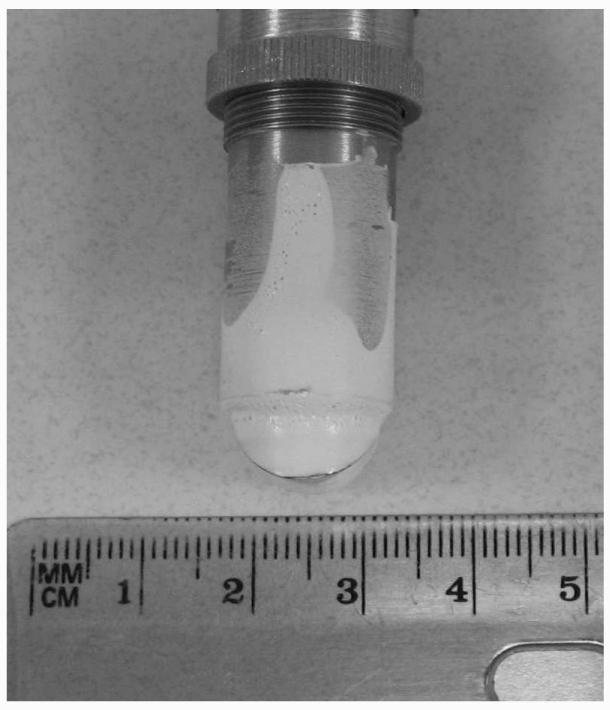
A negative cylindrical lens made from acrylic plastic is epoxied to the surface of an ultrasound transducer. The lens and part of the transducer are painted white with silica gel to diminish the absorption of laser light illuminating on the transducer.
C. Modified Reconstruction Algorithm
In the following, we assume the PA source is within the far field of the ultrasonic transducer. For a 6.35 mm diameter transducer immersed in water at a frequency of 2.25 MHz, which is used in our experiments, the near field distance is about 1.5 cm. In the phantom experiment described later, the minimum distance from the phantom to the transducer is about 2.0 cm, which is beyond the near field region. Thus, the acceptance pattern is described by the directivity factor. Because of the divergence of the negative lens is not angularly uniform, a new directivity factor is required for a flat transducer with a negative lens. In addition, due to the differences in acoustic speeds between the lens and surrounding medium, as well as the shape of the lens, the arrival times (time delays) of PA signals from the same radial distance but different incident angles are also different. Both effects must be carefully considered in the reconstruction algorithm. Although the directivity factor depends on the frequency, the difference is small within limited bandwidth and acceptance angle. Thus, for simplicity, we assume that the new directivity factor, dneg(θ), is independent of the acoustic wavelength. We also introduce a time domain factor, td(θ), to describe the time-delay variation.
Before we discuss the reconstruction algorithm used for the transducer with a negative lens, we first present one for a flat transducer. A solid-angle weighted back-projection reconstruction algorithm was introduced in [11] for ideal point transducers. Given the limited acceptance angle of a flat transducer, we limited the back-projection within a cutoff acceptance angle θcut, which is controlled by a step function U(x) (U(x) = 1 when x ≥ 0 and U(x) = 0 when x < 0). Thus the reconstruction algorithm for a flat transducer in this paper is
| (3) |
where is the reconstructed initial pressure at r, and p(ri, t) is the signal received at location ri and at time t = |r − ri|/v (v is the acoustic speed in water). Moreover, , and i is the index of the location. In this paper, we chose θcut = 0.11 rad (≈ 6.5°), corresponding to −20 dB decay in Fig. 1.
With a negative lens, we assume that the radius of the lens is R and the acoustic speed in the lens is v′. By modifying Eq. (3) with the new directivity factor dneg(θ) and time-delay factor td(θ), we obtain the corresponding reconstruction algorithm with the negative lens:
| (4) |
where t′ is given by
| (5) |
Thus the modified version compensates for the changes in both amplitude and time delay of the PA waves due to the lens.
In this study of a negative lens for PAT, the new directivity factor dneg(θ) and time delay factor td(θ) were obtained empirically from both simulation and trial and error. The simulation was based on the pseudo-spectral time-domain (PSTD) [12] method. In the simulation, a short ultrasound pulse (with the temporal width being the same as the period at the center frequency) generated by the flat transducer passes through the negative lens. A snapshot of the wave pressure amplitude pattern in the time-domain is shown in Fig. 5. Due to internal reflections at the transducer surface and the lens-medium boundary, there are multiple wavefronts. However, the wave intensity decays fast between multiple wavefronts, so we only consider the first wavefront. By studying the simulated wave front and comparing reconstructed images with objects, we empirically obtained
| (6) |
where θ is in radians. The cutoff acceptance angle in Eq. (4) was chosen as rad (≈ 60°), corresponding to −20 dB decay.
FIG. 5.
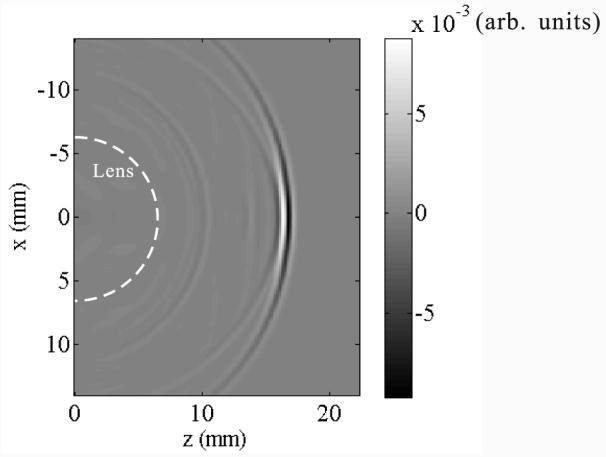
A snapshot of the acoustic wave, a plane wave pulse after passing through the negative lens. The negative lens boundary is marked by the white dashed line. x is parallel to the flat transducer surface, whereas z is along the transducer axis.
Due to the property of the experimental system response, the recorded acoustic signal corresponds to combinations of the original acoustic pressure and its temporal derivative as described in [13]. Thus, the reconstruction in following experiments simply used the recorded signals, instead of (p − t∂p/∂t), in Eqs. (3) and (4).
III. EXPERIMENTS
A. Phantom Experiments
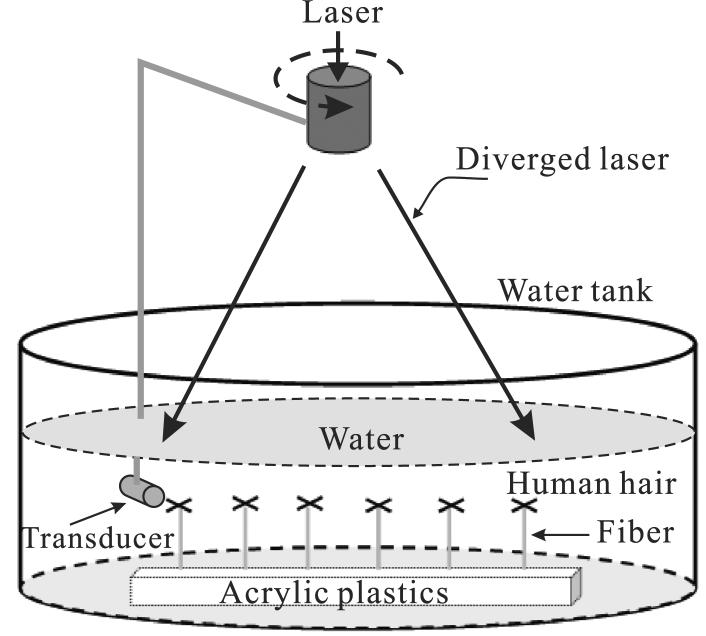
Phantoms were imaged by PAT to demonstrate the power of the negative lens concept. As shown in Fig. 6, the PA source contained six black human hair crosses glued on top of optical fibers, and the interval between the hair samples was about 2 cm. A Nd:YAG laser (LOTIS TII model LS-2137/2) generated 10-15 ns 532 nm laser pulses with a repetition rate of 10 Hz, which were diverged by a combination of a concave lens and a ground glass, so that all six hair crosses were illuminated. Two identical transducers with a 2.25 MHz central frequency and a 6.35 mm diameter active area (Krautkramer 113-822-300, ISS 2.25 × 0.25NF) were used sequentially. One transducer had a negative lens as shown in Fig. 4. Both the phantom and the transducer were immersed in a tank filled with water. The transducer evenly scanned the object along a horizontal circle with a radius of 8.0 cm, stopping at 240 points. PA signals were recorded by a Gage card (Gage Applied, Inc., CS14100), and were then used for image reconstruction.
FIG. 6.
Experimental setup. The phantom contains six human hair crosses, which were glued to the top of optical fibers of the same length. The fibers were vertically fixed on an acrylic plastic base, and both the fiber and the acrylic base do not absorb laser light. Transducers, with or without a negative lens, scan the hair phantom along a circular path and at the same depth as the hair. Both the phantom and transducers were immersed in a tank filled with water. The laser beam is diverged so that all six hair crosses can be illuminated.
Two experiments were done: one used a flat transducer without a negative lens, and the other used one with a negative lens. The reconstructed images, based on Eqs. (3) and (4), are shown in Fig. 7.
FIG. 7.
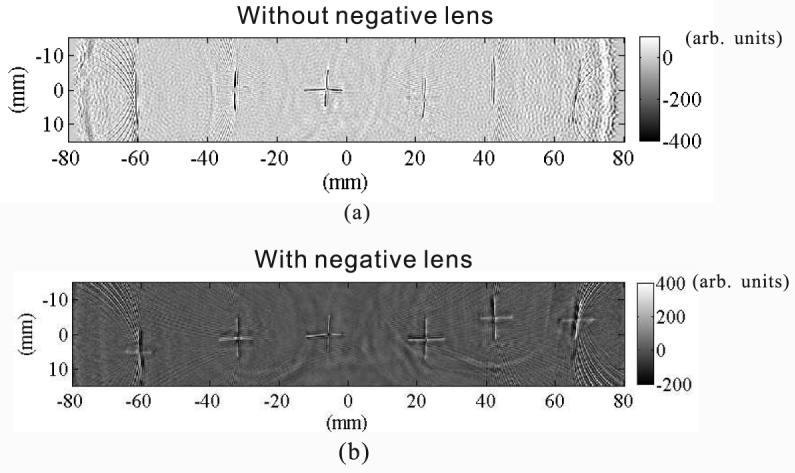
Reconstructed PAT images from two experiments. (a) From data gathered with a flat transducer without a negative lens. (b) From data gathered with another identical that transducer with a negative lens.
Significant differences exist between the two results. Without the negative lens, as shown in Fig. 7(a), only the hair sample close to the scanning center is correctly reconstructed, and for the other five hair crosses, only vertical hairs are prominently reconstructed. In comparison, in Fig. 7(b), where the data were gathered by an identical transducer with a negative lens, the geometry of all six hair crosses are successfully reconstructed. Therefore, the negative lens greatly improved the quality of the PAT images.
B. Discussions of the Result
The results can be explained by the differences in FOV between those two experiments. Because the generated PA signals prevalently propagate perpendicularly to the boundary of the target hair crosses [14], PA signals generated from crossing hairs primarily propagate in two directions: the vertical direction (ŷ) and the horizontal direction (x̂). As illustrated in Fig. 8, two hairs with vertical and horizontal alignments, respectively, are placed off the center. The PA signals from these two hairs are marked as short arrows. Because the signals from the vertical hair (the right one) propagate along the x̂ direction, that transducers, whether with or without a negative lens, can always detect them at positions around “1” and “2”. However, the left horizonal hair generates PA signals propagating along the ŷ direction, and the incident angle θ on the transducer is determined by the location of the hair, so the closer the hair is to the scanning center, the less the angle. When the horizontal hair moves away from the center so that the incident angle is greater than the acceptance angle of the flat transducer, the flat transducer can no longer detect the signals, and thus the horizonal hair at that position cannot be reconstructed. In other words, the hair has moved out of the FOV of the flat transducer. However, the larger acceptance angle of the transducer with a negative lens allows signals from horizontal hairs to be detected over a wider area, and so the images of horizontal hairs can be reconstructed. Therefore, the negative lens significantly increases the FOV.
FIG. 8.
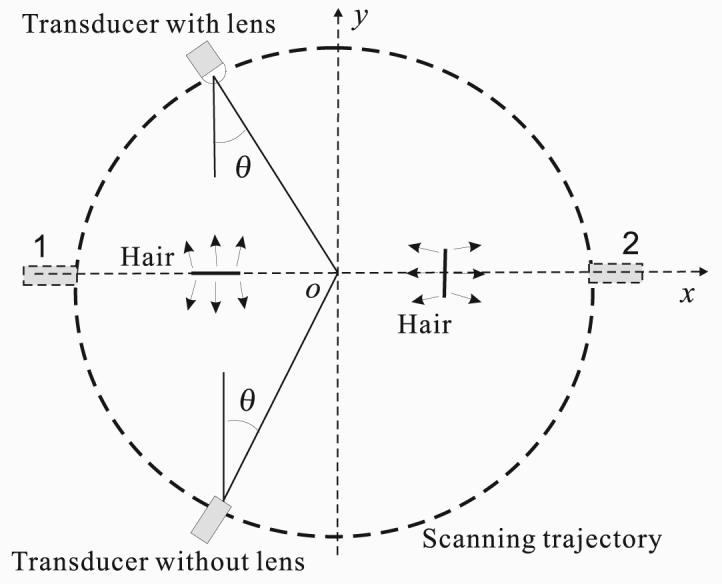
Two hairs with one vertically aligned and the other horizontally aligned are placed along the x-axis. PA signals generated by these two hairs travel perpendicularly to the corresponding hair boundaries. Transducers, with or without a negative lens, face the center and scan the region along a circular path. θ represents the incident angle of the PA signals on the transducer from the left horizontal hair.
Although the boundaries of phantoms were succesffuly reconstructed, values of images in Fig. 7 were not quantitatively accurate due to limited scanning geometry and approximations used in the reconstruction algorithm. However, amplitudes of PA signals pro-portionally depend on the EM energy absorption. Thus, differences in the reconstructed values are closely related to the differences in the EM energy absorption. The quantitative study requires further theoretical and experimental research works.
IV. CONCLUSIONS
Both theoretical analysis and phantom experiments demonstrate that the negative lens is a significant improvement over a flat transducer in PAT. The acceptance angle is significantly increased, allowing target features can be reconstructed over a larger area around the detection center. Although experiments in this paper used laser as a source, this idea can also be used in microwave-induced thermoacoustic tomography (TAT), where the laser is replaced with a microwave source.
Acknowledgment
This project was sponsored in part by National Institutes of Health Grant Nos. R01 NS46214 and R01 EB000712.
References
- 1.Xu MH, Wang LHV. Review of Scientific Instruments. 2006;77:041101–041122. [Google Scholar]
- 2.Wang LV, Wu H.-i. Biomedical Optics : Principles and Imaging. Wiley; Hoboken, N.J.: 2007. [Google Scholar]
- 3.Hoelen CGA, de Mul FFM, Pongers R, Dekker A. Optics Letters. 1998;23:648. doi: 10.1364/ol.23.000648. [DOI] [PubMed] [Google Scholar]
- 4.Wang XD, Pang YJ, Ku G, Xie XY, Stoica G, Wang LHV. Nature Biotechnology. 2003;21:803. doi: 10.1038/nbt839. [DOI] [PubMed] [Google Scholar]
- 5.Siphanto RI, Thumma KK, Kolkman RGM, van Leeuwen TG, de Mul FFM, van Neck JW, van Adrichem LNA, Steenbergen W. Opt. Express. 2005;13:89. doi: 10.1364/opex.13.000089. [DOI] [PubMed] [Google Scholar]
- 6.Wygant IO, Zhuang X, Kuo PS, Yeh DT, Oralkan O, Khuri-Yakub BT. In: Ultrasonics Symposium, 2005 IEEE. Yuhas MP, editor. Vol. 4. IEEE; Piscataway, NJ: 2005. pp. 1921–1924. [Google Scholar]
- 7.Niederhauser JJ, Jaeger M, Lemor R, Weber P, Frenz M. IEEE Transactions on Medical Imaging. 2005;24:436. doi: 10.1109/tmi.2004.843199. [DOI] [PubMed] [Google Scholar]
- 8.Beard PC, Perennes F, Mills TN. IEEE Transactions on Ultrasonics Ferroelectrics and Frequency Control. 1999;46:1575. doi: 10.1109/58.808883. [DOI] [PubMed] [Google Scholar]
- 9.Wang X, Chamberland DL, Jamadar DA. Opt. Lett. 2007;32:3002. doi: 10.1364/ol.32.003002. [DOI] [PubMed] [Google Scholar]
- 10.Pierce AD. Acoustics: An Introduction to Its Physical Principles and Applications. 1989th ed. Acoustical Society of America; New York: 1989. [Google Scholar]
- 11.Xu MH, Wang LHV. Physical Review E. 2005;71(part 2):016706. doi: 10.1103/PhysRevE.71.016706. [DOI] [PubMed] [Google Scholar]
- 12.Liu QH. IEEE Transactions on Geoscience and Remote Sensing. 1999;37(part 2):917. [Google Scholar]
- 13.Xu MH, Wang LHV. Medical Physics. 2002;29:1661. doi: 10.1118/1.1493778. times Cited: 8. [DOI] [PubMed] [Google Scholar]
- 14.Xu Y, Wang LV, Ambartsoumian G, Kuchment P. Medical Physics. 2004;31:724. doi: 10.1118/1.1644531. [DOI] [PubMed] [Google Scholar]


