SYNOPSIS
Objectives
This study used a Cox proportional hazards model to determine whether neighborhood characteristics are associated with risk of readmission for childhood asthma independently of individual characteristics.
Methods
Rhode Island Hospital Discharge Data from 2001 to 2005 were used to identify children younger than 19 years of age at the time of the index (i.e., first) asthma admission, defined as a primary diagnosis of asthma or a primary diagnosis of respiratory illness with a secondary or tertiary diagnosis of asthma (n=2,919). Hazard ratios of repeat hospitalizations for childhood asthma from 2001 to 2005 were estimated, controlling for individual- and neighborhood-level variables.
Results
During the study period, 15% of the sample was readmitted for asthma (n=451). In the unadjusted cumulative hazard curves, children residing in the census tracts with the highest proportion of crowded housing conditions, racial minority residents, or neighborhood-level poverty had higher cumulative hospital readmission rates as compared with children who resided in less disadvantaged neighborhoods. In the fully adjusted models, children insured by Medicaid at the time of their index admission had readmission rates that were 33% higher than children who were privately insured.
Conclusion
Our findings suggest that differences in health-care coverage are associated with higher readmission rates for pediatric asthma, but the relationship between neighborhood inequality and repeat hospitalizations for pediatric asthma requires further exploration. Social indicators such as minority race, Medicaid health insurance, and neighborhood markers of economic disadvantage are tightly interwoven in the U.S. and teasing these relationships apart is important in asthma disparities research.
Asthma, the most common chronic disease of childhood in the U.S., affects about 14% of the nation's children.1 In 2004, 198,000 children were hospitalized for asthma,2 which is the second most common reason for hospitalization in U.S. children. Hospitalizations for pediatric asthma have been increasing in the U.S. during the past decade but have recently plateaued at historically high levels.3 Despite this plateau, the prevention of pediatric asthma hospitalizations is an important public health goal, given evidence that hospitalizations for childhood asthma in recent years may represent more severe exacerbations compared with earlier years,2 coupled with substantial associated health-care costs. In 2004, pediatric asthma hospitalizations in the U.S. were responsible for $330 million in charges.4 Identifying children at high risk for an asthma-related hospitalization is particularly challenging because less than 10% of children with asthma will have an asthma-related hospitalization during a given year.
Various approaches have been used to identify children at high risk for an asthma-related hospitalization, including multivariate analyses of hospital discharge data,5–8 computer-based modeling of administrative claims data,9 spatial analysis of asthma hospitalization rates,10–15 and literature reviews.16,17 Asthma hospitalization rates for U.S. children are significantly higher among African American,2,5,7,18–22 Hispanic,5,7,23 Medicaid-enrolled,24–27 and urban poor individuals, especially children living in close proximity to environmental pollutants.5,7,10–15,25,28–31 The relative importance of each factor in identifying children with the highest asthma hospitalization rates, however, is not consistent across U.S. studies and remains controversial. For example, U.S. studies have documented asthma hospitalization rates 2.0 to 4.0 times higher for black children than for white children.3,20,32 Other studies that have modeled racial/ethnic variation in pediatric asthma hospitalization rates have found that racial/ethnic differences in hospitalization rates were attenuated after adjusting for age and gender,6 income and insurance status,25 or neighborhood-level poverty and residential racial segregation.7
In asthma surveillance systems it is important to differentiate between new and repeat hospitalizations for childhood asthma. Children with repeat hospitalizations for asthma may be qualitatively different from children with a single admission for asthma with respect to severity of disease, access to preventive care, or exposure to environmental pollutants. Therefore, distinguishing between the two types of admission patterns has merit.33 Readmission rates have varied from 12% among children readmitted for asthma within 180 days of their initial asthma discharge,33 to rates of 30% to 59% among pediatric patients hospitalized during a 10-year period who had at least one readmission within that interval.34 Cofactors associated with increased risk of readmission for childhood asthma have been well summarized elsewhere,34 although at present there is no comprehensive agreement about the factors related to asthma readmissions among children. Factors associated with pediatric asthma admissions in general appear to be the same factors that make risk for readmission more likely, including African American race, Medicaid insurance, and poverty, all of which are highly correlated.32–40 During an interval of 10 years, Bloomberg and colleagues reported that African American children with Medicaid health insurance were 1.3 times as likely to be readmitted for asthma than were African American children with commercial insurance or white children regardless of insurance type.34 The evidence is less clear that living in a disadvantaged neighborhood increases the probability of repeat admissions for asthma, after race,32,35 insurance type,35 or median family income40 have been taken into account.
The absence of consistent evidence that repeat hospitalizations for childhood asthma vary by race/ethnicity, payer type, or neighborhood characteristics is not surprising. Race and socioeconomic status are closely linked in the U.S. and both factors affect the health of U.S. populations in complex ways.41,42 Additionally, within poverty neighborhoods, certain racial/ethnic and socioeconomic groups may be more severely affected by asthma than others.42 Research conducted in the U.S. has shown that substandard housing is associated with a higher likelihood of exposure to asthma allergens,17 and poor housing quality is disproportionately found in low-income, minority, urban neighborhoods.12,17 With a few exceptions, however, the relative importance of individual- and neighborhood-level factors in predicting repeat admissions for childhood asthma has rarely been studied.32,40
In this study, a Cox proportional hazards model was used to determine whether characteristics of neighborhoods (i.e., poverty, racial/ethnic minority concentration) were associated with risk of readmission for childhood asthma independently of a child's race and other individual characteristics. A previous study of hospital admissions for asthma in Rhode Island found substantial differences in hospitalization rates by age, gender, and race,43 but did not consider whether hospitalizations for asthma were in part influenced by the social environment within which patients live.17 Our premise is that asthma disparities research must examine and address both the sociodemographic characteristics of children hospitalized for asthma and the neighborhoods in which these children live.
METHODS
Data and sample
Records of hospital admissions (1999–2005) from the Rhode Island Department of Health's Hospital Discharge Data44 were matched with census tract-level variables from the U.S. Census 2000 Summary File 3 (SF 3)—Sample Data.45 In Rhode Island, all acute-care general hospitals are required to report discharge data to the state health department.44 Rhode Island's Hospital Discharge Data are event-level files that include demographic information, clinical data coded to the International Classification of Diseases, Ninth Revision, Clinical Modification (ICD-9-CM) and summaries of hospital utilization and charges. Census tract-level information was chosen as the unit of geographical analysis because it was the smallest available geographical unit in both datasets. Census tracts are small, relatively homogeneous statistical subdivisions of a county, which usually has 2,500 to 8,000 people.46
We created a longitudinal patient-specific file from the event-level file using two patient identifiers: date of birth and a unique medical record number for tracking patients over time. Rhode Island is one of a few states with an asthma surveillance system that can differentiate between the number of individuals hospitalized and the number of admissions, the latter of which can be numerous during an individual's lifetime.33
A pediatric asthma hospitalization was defined as a primary diagnosis of asthma (ICD-9-CM code 493) or a primary diagnosis of respiratory illness (ICD-9-CM codes 460–496) with a secondary or tertiary diagnosis of asthma.36 Most surveillance systems define an asthma hospitalization as one for which there is a primary diagnosis of asthma. However, respiratory illnesses often coexist with a diagnosis of asthma, especially in children younger than 1 year of age, where a diagnosis of asthma may be difficult to make.47 Therefore, our case definition of an asthma hospitalization was designed to capture all potentially preventable asthma-related hospitalizations, beginning with the index (i.e., first) hospitalization.
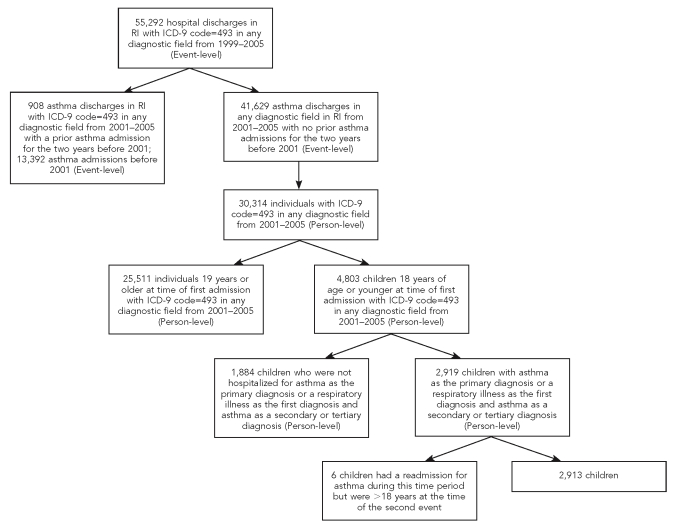
The sampling frame included all 55,929 hospital discharges from 1999 to 2005 with a diagnosis of asthma in any diagnostic field (Figure 1). Seventy-five percent of these discharges (n=41,629) had no admission for asthma in the two years preceding the index hospitalization for asthma in 2001 (event-level file). To identify patients with multiple hospital discharges for asthma, we created a person-level file using a unique medical number and date of birth. At the person-level, there were 30,314 individuals with a diagnosis of asthma in any field who had no asthma admissions for the two years before 2001. Sixteen percent of asthma patients were children aged 0 to 18 years (n=4,803). Of the children with a diagnosis of asthma in any field, 61% were admitted to the hospital with asthma as the primary diagnosis or a respiratory illness as the first diagnosis and asthma as a secondary or tertiary diagnosis (n=2,919). By excluding hospitalizations with a primary diagnosis of asthma in the two years prior to 2001, we ensured, as did Ash and Brandt,35 that the index hospitalization was an indicator of active asthma and not a repeat hospitalization because of poor asthma management following discharge.
Figure 1. Sample selection of hospital discharges in Rhode Island from 1999 to 2005 with a diagnosis of asthma in any diagnostic field.
RI = Rhode Island
ICD-9 = International Classification of Diseases, Ninth Revision
Criteria for inclusion in our study were (1) a primary diagnosis of asthma or a primary diagnosis of respiratory illness with asthma as a secondary or tertiary diagnosis, (2) being aged 0 to 18 years at the time of the index hospitalization, (3) having no admissions where asthma was the primary diagnosis in the two years before the index admission (2001), and (4) having at least one hospitalization for asthma from 2001 to 2005. Almost two-thirds of the valid observations for children met our study criteria (n=2,919; 61%), which included six children who had a readmission for asthma during the study period but were older than 18 years of age at the time of the second hospitalization for asthma.
Measures
The outcome variable was time to readmission between the index hospitalization for asthma and a subsequent hospitalization for asthma during a five-year period. We chose to examine time to readmission rather than a count of readmissions. There is some evidence that an early asthma readmission (i.e., within 30 days of discharge) may be a marker for emergency department visits for asthma in the past 12 months because of disease severity, comorbidities, or use of the emergency room as a primary source of care.48 Longer time periods between an initial and repeat hospitalization for asthma more likely reflect modifiable factors such as asthma management upon discharge.33
Variables related to time to readmission drew on the ecological framework proposed by Wright and Subramanian for modeling disparities in asthma,17 as well as factors shown in the literature to be associated with repeat hospitalizations for pediatric asthma.34 Individual-level characteristics included sex, age (0 to 4 years, 5 to 10 years, 11 to 18 years), race (white, black, Hispanic/other), payer type (commercial insurance, public insurance, unknown), lives in the same zip code as a hospital emergency room (yes/no), season of index admission for asthma (winter, spring, summer, fall), year of index admission for asthma (2001 to 2005), and length of stay of index admission for asthma (one, two, or three or more days).
Age was coded categorically because the profile of children hospitalized for asthma changes as a child gets older, with children younger than 5 years of age more likely to be hospitalized for asthma than older children.2 Public insurance included Medicaid, Medicare, and RIteCare. The latter is Rhode Island's Medicaid Managed Care Program for eligible children in families with incomes up to 250% of the federal poverty level (FPL),49 and is a proxy for access to care and an indicator of economic resources.50 Living in the same zip code as a hospital emergency room also was used as a marker for access to hospital care, as the decision to seek asthma treatment in an inpatient rather than an outpatient setting may be related to the proximity of a child's residence to a hospital emergency room. The 16 Rhode Island hospitals with emergency rooms were used to create this variable; three specialty hospitals (naval, psychiatric, and rehabilitation) were not used. Season of the index admission was considered a potential independent predictor of repeat admissions for asthma because asthma may be exacerbated by seasonal increases in specific aeroallergens. Length of stay for the index admission was used as a clinical indicator of the severity of asthma and/or possible comorbidities.
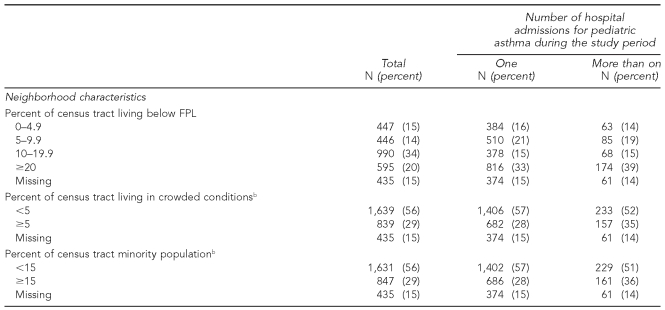
Three census tract variables provided the best available measures of neighborhood-level social and economic disadvantage. Poverty was defined as the percentage of residents below FPL, a threshold that depends on family size and age of children (0%–4.9%, 5%–9.9%, 10%–19.9%, 20% or more, missing). Residential racial/ethnic minority concentration was defined as the percentage of residents that were nonwhite (<15%, ≥15%, missing). Crowding was defined as the percentage of households with more than one person per room (<5%, ≥5%, missing). All variables were coded empirically to identify appropriate categories and ensure sufficient sample size. Approximately 15% (n=436) of the person-level records had missing (n=369) or incorrect (n=67) census tract information. To these person-level records in the analysis we created a separate missing category for all census tract variables.
Statistical analysis
The cumulative probability of being readmitted for asthma throughout the subsequent follow-up period was estimated by unadjusted Nelson-Aalen cumulative hazard curves. With respect to our study, we wanted to observe if the proportion of children readmitted for asthma in neighborhoods characterized by high poverty, high racial/ethnic minority concentration, or high household crowding was greater than the proportion of children readmitted for asthma in neighborhoods characterized by low poverty, low racial/ethnic minority concentration, or low household crowding. The hazard functions assumption is that the difference in risk of readmission between high and low groups will be time-invariant.
We estimated a series of random-effects Cox proportional hazards models to identify the possible covariates for time to readmission. The time axis was defined as time since the discharge from the index hospitalization. The event was defined as readmission for pediatric asthma. A record was considered censored if a child never experienced another asthma hospitalization during this time period, if s/he turned 19 before having another asthma hospitalization in Rhode Island, or if s/he turned 19 before the end of the study period. A survival time was described as censored when the event had not yet occurred or was not known to have occurred during the follow-up time covered in the study period.
The Cox regression models the effects of covariates on the hazard ratio. The hazard rate is a measure of the likelihood for a readmission for asthma as a function of time, estimating relative rather than absolute risk.51 Thus, in our study, the hazard ratio indicates the relative likelihood of readmission in population subgroups (e.g., Medicaid-insured children) vs. the reference group (e.g., children with commercial health insurance) at any given point in time. Variations among children, such as unobserved exposures to environmental pollutants, were modeled in terms of an individual-level random component (called “frailty term” in survival analysis). The frailty term allows for the incorporation of unmeasured random effects into the analysis of censored traits,52 and, in our study, controlled for any possible correlation between children residing in the same census tract.
Analysis was performed in five steps. First, race/ethnicity was entered into the baseline model (Model 1: Unadjusted). Second, all other individual-level variables were added with the purpose of determining whether there were changes in racial/ethnic differences after adjustment for payer type (Model 2: Adjusted). Finally, neighborhood variables were added to the model adjusting simultaneously for individual-level variables (Models 3–5: Adjusted). Each neighborhood characteristic was entered into a separate model because of extreme multicollinearity among the neighborhood variables.
RESULTS
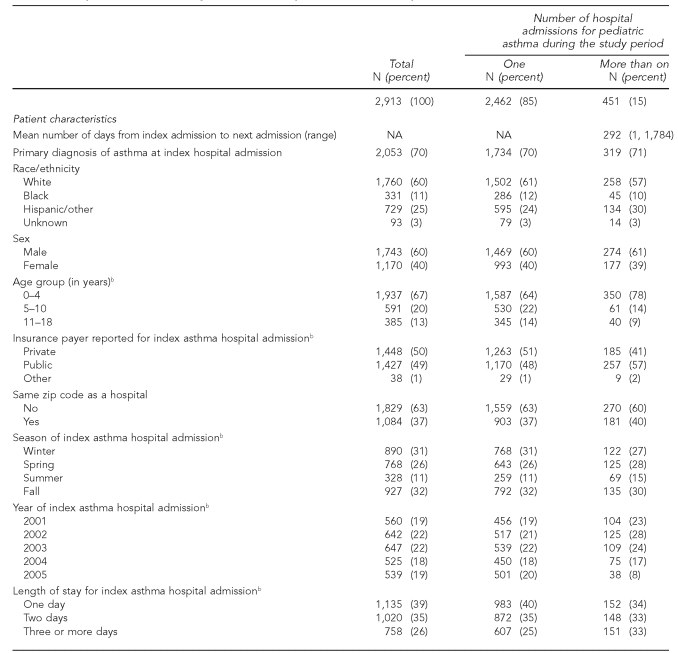
Between 2001 and 2005, there were 2,919 children who had at least one admission for asthma and met our study inclusion criteria. As shown in Table 1, during this five-year period, 85% of children were admitted only once (n=2,462), and 451 children (15%) were admitted more than once. The number of readmission events (subsequent admissions after the index hospitalization) represented 19% of all pediatric asthma discharges during the five-year study interval (data not shown). The mean time between discharge date of the index admission to the next hospital admission for asthma was less than a year (mean=292, range 1, 1,784 days). Of children with a repeat hospitalization, 29% (n=132) had a readmission more than one year after the initial asthma hospitalization (data not shown). The mean length of stay at the time of the index hospitalization was two days for those with a single hospitalization for asthma and for those readmitted for asthma (standard deviation = two days; data not shown).
Table 1. Sample characteristics by number of hospital admissions for pediatric asthma, 2001–2005a.
aSix individuals had a readmission for asthma during this time period but were >18 years of age at the time of the second event.
bp-value for Chi-square test <0.05
FPL = federal poverty level
NA = not applicable
Among all patients admitted for asthma during the study period, 1,743 (60%) were male, 1,937 (67%) were between the ages of 0 and 4, 1,760 were white (60%), and 2,053 (70%) presented with a primary diagnosis of asthma. In our sample, a higher proportion of children with hospital readmissions as compared with those with only one admission had an index hospital admission of three days or more (33% vs. 25%), were Hispanic (30% vs. 24%), had public health insurance (57% vs. 48%), lived in predominantly minority neighborhoods (36% vs. 28%), and resided in neighborhoods with crowded housing conditions (35% vs. 28%).
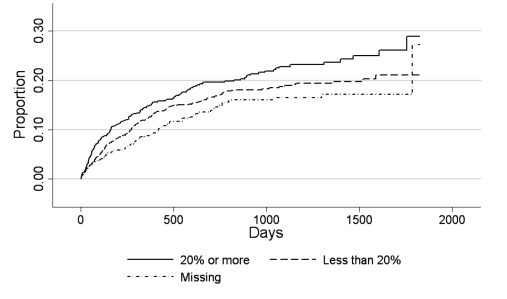
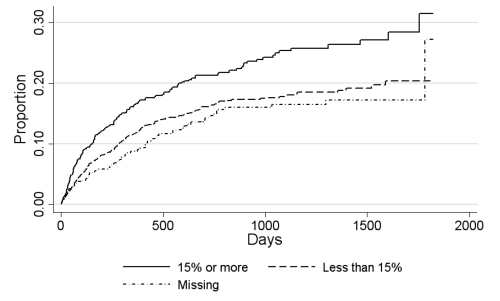
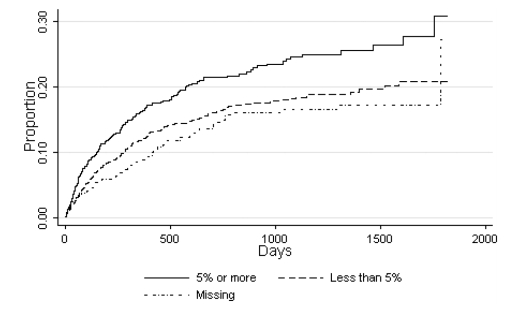
Figures 2, 3, and 4 illustrate the cumulative incidence rate of hospital readmission by neighborhood socioeconomic characteristics. All three neighborhood-level variables showed a consistent pattern in the unadjusted survival curves. Children residing in the census tracts with the highest proportion of neighborhood-level poverty (Figure 2), the highest concentration of racial/ethnic minority residents (Figure 3), or the highest proportion of crowded housing conditions (Figure 4) had the highest hospital readmission rates over time.
Figure 2. Cumulative proportion of children readmitted for asthma according to area-level poverty.
Figure 3. Cumulative proportion of children readmitted for asthma according to area-level minority population.
Figure 4. Cumulative proportion of children readmitted for asthma according to area-level crowded housing conditions.
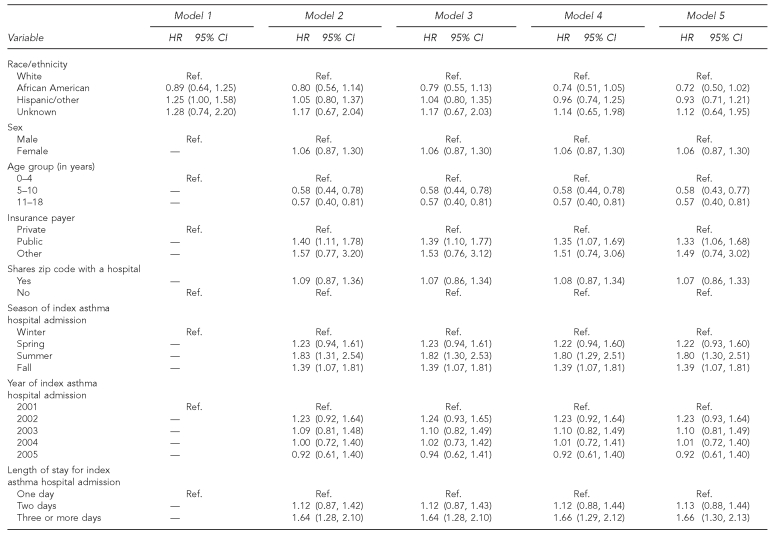
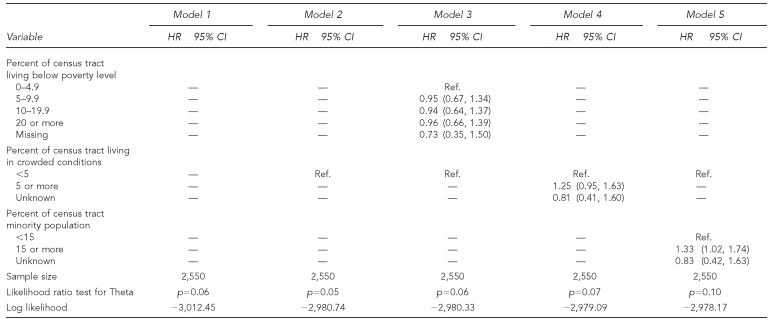
In the unadjusted Cox proportional hazards model, the hospital readmission rate for pediatric asthma was 25% higher for Hispanic children than for non-Hispanic white children (Table 2, Model 1). After adjustment for all individual-level variables, children insured by Medicaid at the time of the index admission had a 40% higher readmission rate as compared with privately insured children (Table 2, Model 2). When we controlled for payer type, Hispanic-white differences in readmission rates for pediatric asthma were attenuated. Older age at the time of the index admission had a protective effect against rate of readmission for childhood asthma. The pediatric asthma readmission rate for children admitted for asthma in the summer months, or who had lengths of stay of three days or longer, was 1.83 and 1.64 times higher than that of their respective reference groups (Table 2, Model 2). When we included neighborhood-level variables in the model, residence in an area with a high proportion of minority residents was associated with higher readmission rates (Table 2, Model 5). No other neighborhood-level variable was associated with an increased rate of readmission (Table 2, Models 3 and 4). After adjustment for all covariates, Medicaid-insured children were significantly more likely to have a repeat admission for asthma than children whose hospital stay was reimbursed by their private insurance carrier (Table 2, Models 3–5).
Table 2. Cox regression models of time to the next pediatric asthma hospitalization restricted to non-missing census tracts, Rhode Island, 2001–2005.
HR = hospital readmission
CI = confidence interval
Ref. = reference group
Additional multivariate Cox regression analyses revealed that the hazard ratios shown in Table 2 were nearly identical in a model restricted to children with available census tract information (data not shown). Children with public insurance at the index hospitalization had a significantly and consistently higher rate of readmission as compared with children who were privately insured (hazard ratio [HR] = 1.30, 95% confidence interval [CI] = 1.03, 1.64). We also restricted our sample to children who were 3 years of age and older at the time of the index admission because a definitive diagnosis of asthma is often difficult to make in younger children. In the models for children older than age 2, areas with 15% or more racial/ethnic minority residents had higher pediatric asthma readmission rates as compared with areas with fewer racial/ethnic minority residents (HR=1.75, 95% CI 1.16, 2.63).
To determine whether neighborhood characteristics might explain risk of readmission when only one marker for economic disadvantage was in the model, we conducted additional analyses without payer type in the models (data not presented). The neighborhood relationships in the fully adjusted models became stronger, whereas there was no significant effect for race/ethnicity (HR for African Americans = 0.76 [95% CI 0.53, 1.08], and HR for Hispanic/other = 0.99 [95% CI 0.76, 1.29], as compared with white non-Hispanic children). Living in census tracts with crowded housing conditions was associated with a 34% higher readmission rate as compared with living in census tracts where less than 5% of the population lived in crowded housing conditions (HR=1.34 [95% CI 1.03, 1.74]). The readmission rate for children living in predominantly minority neighborhoods was 43% higher than that of children living in predominantly white communities (HR=1.43 [95% CI 1.10, 1.85]).
DISCUSSION
Readmissions for pediatric asthma are a significant public health problem. Asthma admissions consume a large proportion of pediatric health-care resources and account for a substantial amount of health-care expenditures.53 Identifying children at high risk of adverse asthma outcomes may significantly reduce repeat hospitalizations for childhood asthma.
This study extends the findings of previous literature that have examined repeat hospitalizations for childhood asthma. We sought to determine whether the neighborhood context in which children live was associated with readmissions for pediatric asthma independently of individual-level characteristics. The importance of applying a multilevel framework for understanding disparities in asthma etiology has been well summarized elsewhere.17,42 Far less attention has focused on whether neighborhood-level contextual factors may contribute independently to adverse asthma-related outcomes, after socioeconomic characteristics have been taken into account. The analyses described in this article are an important step toward understanding how social and economic disadvantage, at both the individual and neighborhood levels, may increase the risk of repeat admissions for pediatric asthma.
A main strength of this study was our ability to differentiate between the number of individuals hospitalized for asthma and the number of hospital events. This distinction is important as the total number of admissions for childhood asthma may overstate the number of individual children with asthma severe enough to require hospitalization.33 Additionally, the random-effects Cox proportional hazards model used in this study offered significant advantages as compared with multivariate regression analysis used in previous studies of readmission for pediatric asthma. First, the analyses not only took individual- and neighborhood-level risk factors in relation to readmissions for childhood asthma into consideration, but also time to readmission. In this study of asthma admissions and readmissions in Rhode Island, we identified 15% of pediatric patients who had at least one readmission. The overall readmission rate showed that almost one in every six hospitalizations for asthma was a repeat hospitalization. The mean time between the index admission for asthma and next admission for asthma was 292 days. Within the group of Rhode Island children with at least one readmission for asthma, 71% had a repeat hospitalization within one year. A time interval of six months to two years is often deemed an appropriate window for clinical follow-up of a chronic condition and therefore can be used as a measure for evaluating asthma management.33–35 Second, our analysis of readmissions for childhood asthma took a more nuanced approach than did previous studies of childhood asthma hospitalization rates by accounting for whether individual-level risk factors were randomly distributed across neighborhoods or clustered by census tract.
Our research identified new as well as previously known predictors of repeat hospitalizations for childhood asthma. Specifically, the data from this study support the conclusion that children with Medicaid insurance are at significantly higher risk of readmission for asthma than children with private health insurance. The multivariate analysis showed that the risk for readmission for Medicaid-insured children was 33% higher than for privately insured patients, even after we controlled for race/ethnicity and neighborhood contextual factors.
The present findings are generally consistent with the one U.S. study that examined the joint effect of race/ethnicity, insurance type, and neighborhood context on risk of readmission for childhood asthma. Lin et al.32 observed that Medicaid-insured children were nearly twice as likely to be readmitted for asthma as were privately insured children. Other studies of readmission rates for asthma among U.S. children and youth also found that insurance status (e.g., having Medicaid) was a reasonably effective way to identify children at risk for multiple hospitalizations for asthma,32,34,38,39 although a single variable such as health insurance is not sufficient to identify all children likely to experience a hospitalization for asthma.32–34,36–40,48
Given that racial minorities are more likely to be poor than their white counterparts, an important question is whether race and ethnicity are independent risk factors for repeat admissions for childhood asthma or confounders for persistent social and economic inequalities between racial/ethnic minorities and white children in the U.S. We did not find, as did others,32,24,38 black-white disparities in repeat hospitalizations for childhood asthma. In our baseline model with race/ethnicity (unadjusted model), the readmission hazard ratio was higher for Hispanic children than for non-Hispanic white children, but as reviewed previously, when we controlled for race/ethnicity and payer type, the hazard ratio for Hispanic children lost statistical significance. We had expected that non-Hispanic black children would have a higher readmission rate than non-Hispanic white children, but our hypothesis was proved wrong.
In Rhode Island, as in the U.S., race and socioeconomic status are tightly interwoven, making the effects of the two factors difficult to separate.17,41 Like many other states, Rhode Island provides health insurance to income-eligible children. RIte Care covers children until age 19 in families with incomes up to 250% of the FPL.49 Of the children younger than age 19 enrolled in Rhode Island's 2004–2005 Medicaid/RIteCare Program, 71% were Hispanic, 68% were black non-Hispanic, and 42% were white non-Hispanic.54 As previously noted, the high degree of overlap of racial and socioeconomic status in the U.S. makes it difficult to determine if it is “race and social class” or “race or social class” that produces disparities in health status and health outcomes.55 Additionally, the mechanisms by which race/ethnicity and Medicaid insurance contribute to disparities in pediatric readmission rates either directly or indirectly are complex. For instance, asthma is common in children eligible for Medicaid and the high use of inpatient and emergency department care for asthma management among Medicaid-insured children has been attributed to the complex interactions among biological, psychosocial, and environmental risk factors, compounded by poverty and intermittent access to primary health care.56
The findings from this longitudinal analysis of Rhode Island Hospital Discharge Data raise interesting conceptual and methodological issues about how individual- and neighborhood-level indicators of economic well-being may affect health and health-care use. As discussed previously, Medicaid insurance was correlated with race/ethnicity, but insurance status also was associated with neighborhood markers of economic disadvantage. Among children hospitalized at least once for asthma in our study, 75% of children who lived in predominantly racial/ethnic minority neighborhoods had public insurance as compared with 40% of children who lived in less racially diverse neighborhoods (Chi-square p≤0.01, data not shown). Similarly, 76% of children who lived in neighborhoods with crowded housing conditions had public insurance as compared with 40% of children who lived in neighborhoods with less than 5% of the population in crowded housing conditions (Chi-square p-value≤0.01, data not shown). Our results suggest that Medicaid health insurance may be capturing some of the physical and social characteristics of neighborhoods frequently associated with a hospitalization for asthma,10–14 although we cannot test this hypothesis with available data.
Neighborhood data for exploring contextual factors related to asthma outcomes would profit from refinement. As reviewed previously, many of the suspected contributors to the development of asthma and its exacerbation are linked to the environment. For instance, living in substandard and crowded housing conditions increases a child's exposure to indoor pollutants known to trigger both the onset of asthma and the exacerbation of asthma once someone has the disease.12 Poor and minority communities have higher exposure to environmental hazards, such as air traffic pollution, that contribute to asthma.12 The location of facilities that emit a significant amount of pollution are available from the Environmental Protection Agency, which can be linked to hospitalization discharge data at the census tract or zip code levels. Knowing the location of air- and land-polluting facilities does not tell you whether, or to what degree, the public has been exposed to specific pollutants.57
One other result merits discussion. Children with a hospital stay of three days or longer during the index admission had a 66% higher asthma readmission rate than children with a shorter hospital stay during their first admission for asthma. In comparing pediatric admissions for asthma in New York and in Pennsylvania, Silber et al.53 found that children with a hospitalization for asthma that was four days or longer were substantially more likely to be readmitted for asthma than children with shorter admissions when first hospitalized for asthma. Length of stay may be a marker for more severe disease, complications from comoribities, or gaps in the health-care system, such as inadequate management of patients with complications, or less adequate outpatient management for children with asthma. Whatever the reason, a prolonged length of stay for an asthma-related admission is a sign of a system failure, either inside or outside of the hospital.38,53
Limitations
Limitations of our study included inconsistencies across providers and across years, as evidenced by missing or incomplete census tract information from records in the earlier years covered in our study (2001–2003), which may have led to biased estimates. Another limitation of the study was the inability to characterize an asthma-related hospitalization in greater detail. The Rhode Island Hospital Discharge Data include a limited number of variables for each hospitalization record. No data were available on clinical markers that may vary by race/ethnicity, such as age at onset of asthma, severity of asthma, adequacy of asthma treatment, or family history of asthma. Finally, we may have undercounted the number of repeat hospitalizations for childhood asthma, as medical record numbers are specific to a hospital and do not follow the patient if s/he is admitted to another hospital. On the other hand, there have been few studies of repeat hospitalizations for childhood asthma that used datasets with comprehensive longitudinal patient data.
CONCLUSION
The relative importance of social indicators such as minority race, Medicaid health insurance, and neighborhood context in relation to risk of readmission for childhood asthma is a new area in asthma epidemiology. We believe that health researchers can further our understanding of disparities in repeat hospitalizations for childhood asthma by examining neighborhood conditions independent of individual- and family-level characteristics. A conceptual framework that takes into account the importance of individual-level risk factors and the neighborhood context in which children live is likely to improve our ability to identify children at highest risk of repeat hospitalizations for asthma.
Still, a family's economic resources, as measured by insurance payer type, may be more effective in identifying children who are at highest risk of readmission for asthma—and more efficient in screening out those at lowest risk—than a child's race/ethnicity or neighborhood contextual factors. Put simply, if health insurance is a marker for risk of readmission for asthma, then we need to consider whether adequate follow-up for children with asthma is happening as often for children who have Medicaid-paid asthma hospitalizations as compared with privately insured children admitted for asthma.
Acknowledgments
The authors thank Jay S. Buechner, PhD, Chief, Center for Health Data and Analysis, Rhode Island Department of Health, for his critical reading of earlier drafts of this article; Janice Fontes, MA, Principal Systems Analyst and Data Manager, Center for Health Data and Statistics, for preparing the Rhode Island Hospital Discharge Data for analysis and providing thoughtful guidance in response to questions about the data; and Nancy Sutton, RD, MS, and Dona Goldman, RN, MPH, from the Rhode Island Department of Health for their ongoing support and excellent leadership in the field of chronic disease management.
Footnotes
Funding from the Agency for Healthcare Research and Quality (AHRQ) through a grant awarded to the Rhode Island Department of Health's Asthma Control Program provided support to Sze Yan Liu for preliminary analysis of the Hospital Discharge Data.
This article was supported in part by Grant Cooperative Agreement Number IU59EH000199-01 from the Centers for Disease Control and Prevention (CDC). The contents of this article are solely the responsibility of the authors and do not necessarily represent the official views of CDC or AHRQ.
REFERENCES
- 1.Bloom B, Cohen RA National Center for Health Statistics. Summary health statistics for U.S. children: National Health Interview Survey, 2006. Vital Health Stat 10. 2007;234 [PubMed] [Google Scholar]
- 2.Akinbami LJ. The state of childhood asthma, United States, 1980–2005. Adv Data. 2006;381:1–24. [PubMed] [Google Scholar]
- 3.Akinbami LJ, Schoendorf KC. Trends in childhood asthma: prevalence, health care utilization, and mortality. Pediatrics. 2002;110(2 Pt 1):315–22. doi: 10.1542/peds.110.2.315. [DOI] [PubMed] [Google Scholar]
- 4.Russo A, Jiang J, Barrett M. Rockville (MD): Agency for Healthcare Research and Quality (US); 2007. [cited 2008 Aug 7]. Trends in potentially preventable hospitalizations among adults and children, 1997–2004. H-CUP Statistical Brief #36. Also available from: URL: http://www.hcup-us.ahrq.gov/reports/statbriefs/sb36.pdf. [PubMed] [Google Scholar]
- 5.Goodman DC, Stukel TA, Chang CH. Trends in pediatric asthma hospitalization rates: regional and socioeconomic differences. Pediatrics. 1998;101:208–13. doi: 10.1542/peds.101.2.208. [DOI] [PubMed] [Google Scholar]
- 6.Lieu TA, Lozano P, Finkelstein JA, Chi FW, Jensvold NG, Capra AM, et al. Racial/ethnic variation in asthma status and management practices among children in managed Medicaid. Pediatrics. 2002;109:857–65. doi: 10.1542/peds.109.5.857. [DOI] [PubMed] [Google Scholar]
- 7.Ray NF, Thamer M, Fadillioglu B, Gergen PJ. Race, income, urbanicity, and asthma hospitalization in California: a small area analysis. Chest. 1998;113:1277–84. doi: 10.1378/chest.113.5.1277. [DOI] [PubMed] [Google Scholar]
- 8.Schatz M, Nakahiro R, Jones CH, Roth RM, Joshua A, Petitti D. Asthma population management: development and validation of a practical 3-level risk stratification scheme. Am J Manag Care. 2004;10:25–32. [PubMed] [Google Scholar]
- 9.Lieu TA, Quesenberry CP, Sorel ME, Mendoza GR, Leong AB. Computer-based models to identify high-risk children with asthma. Am J Respir Crit Care Med. 1998;157(4 Pt 1):1173–80. doi: 10.1164/ajrccm.157.4.9708124. [DOI] [PubMed] [Google Scholar]
- 10.Carr W, Zeitel L, Weiss K. Variations in asthma hospitalizations and deaths in New York City. Am J Public Health. 1992;82:59–65. doi: 10.2105/ajph.82.1.59. [DOI] [PMC free article] [PubMed] [Google Scholar]
- 11.Claudio L, Tulton L, Doucette J, Landrigan PJ. Socioeconomic factors and asthma hospitalization rates in New York City. J Asthma. 1999;36:343–50. doi: 10.3109/02770909909068227. [DOI] [PubMed] [Google Scholar]
- 12.Corburn J, Osleeb J, Porter M. Urban asthma and the neighborhood environment in New York City. Health Place. 2006;12:167–79. doi: 10.1016/j.healthplace.2004.11.002. [DOI] [PubMed] [Google Scholar]
- 13.Oyana TJ, Rivers PA. Geographic variations of childhood asthma hospitalization and outpatient visits and proximity to ambient pollution sources at a U.S.-Canada border crossing. Int J Health Geogr. 2005;4:14. doi: 10.1186/1476-072X-4-14. [DOI] [PMC free article] [PubMed] [Google Scholar]
- 14.Oyana TJ, Lwebuga-Mukasa JS. Spatial relationships among asthma prevalence, health care utilization, and pollution sources in neighborhoods of Buffalo, New York. J Environ Health. 2004;66:25-37–44. [PubMed] [Google Scholar]
- 15.Roberts EM, English PB, Wong M, Wolff C, Valdez S, Van den Eiden SK, et al. Progress in pediatric asthma surveillance II: geospatial patterns of asthma in Alameda County, California. Prev Chronic Dis. 2006;3:A92. [PMC free article] [PubMed] [Google Scholar]
- 16.Gold DR, Wright R. Population disparities in asthma. Annu Rev Public Health. 2005;26:89–113. doi: 10.1146/annurev.publhealth.26.021304.144528. [DOI] [PubMed] [Google Scholar]
- 17.Wright RJ, Subramanian SV. Advancing a multilevel framework for epidemiologic research on asthma disparities. Chest. 2007;132(5 Suppl):S757–69. doi: 10.1378/chest.07-1904. [DOI] [PubMed] [Google Scholar]
- 18.Crater DD, Heise S, Perzanowski M, Herbert R, Morse CG, Hulsey TC, et al. Asthma hospitalization trends in Charleston, South Carolina, 1956 to 1997: twenty-fold increase among black children during a 30-year period. Pediatrics. 2001;108:E97. doi: 10.1542/peds.108.6.e97. [DOI] [PubMed] [Google Scholar]
- 19.Getahun D, Demissie K, Rhoads GG. Recent trends in asthma hospitalization and mortality in the United States. J Asthma. 2005;42:373–8. doi: 10.1081/JAS-62995. [DOI] [PubMed] [Google Scholar]
- 20.Gupta RS, Carrion-Carire V, Weiss KB. The widening black/white gap in asthma hospitalizations and mortality. J Allergy Clin Immunol. 2006;117:351–8. doi: 10.1016/j.jaci.2005.11.047. [DOI] [PubMed] [Google Scholar]
- 21.Lin S, Kielb C, Chen C, Hwang SA. Childhood asthma hospitalization rates, childhood asthma prevalence, and their relationships in Eric County, New York. J Asthma. 2005;42:653–8. doi: 10.1080/02770900500264846. [DOI] [PubMed] [Google Scholar]
- 22.Shields AE, Comstock C, Weiss KB. Variations in asthma care by race/ethnicity among children enrolled in a state Medicaid program. Pediatrics. 2004;113:496–504. doi: 10.1542/peds.113.3.496. [DOI] [PubMed] [Google Scholar]
- 23.Cohen RT, Canino GJ, Bird HR, Shen S, Rosner BA, Celedon JC. Area of residence, birthplace, and asthma in Puerto Rican children. Chest. 2007;131:1331–8. doi: 10.1378/chest.06-1917. [DOI] [PubMed] [Google Scholar]
- 24.Friedman B, Basu J. Health insurance, primary care, and preventable hospitalization of children in a large state. Am J Manag Care. 2001;7:473–81. [PubMed] [Google Scholar]
- 25.Miller JE. The effects of race/ethnicity and income on early childhood asthma prevalence and health care use. Am J Public Health. 2000;90:428–30. doi: 10.2105/ajph.90.3.428. [DOI] [PMC free article] [PubMed] [Google Scholar]
- 26.Todd J, Armon C, Griggs A, Poole S, Berman S. Increased rates of morbidity, mortality, and charges for hospitalized children with public or no health insurance as compared with children with private insurance in Colorado and the United States. Pediatrics. 2006;118:577–85. doi: 10.1542/peds.2006-0162. [DOI] [PubMed] [Google Scholar]
- 27.Weissman JS, Gatsonis C, Epstein AM. Rates of avoidable hospitalization by insurance status in Massachusetts and Maryland. JAMA. 1992;268:2388–94. [PubMed] [Google Scholar]
- 28.Castro M, Schechtman KB, Halstead J, Bloomberg G. Risk factors for asthma morbidity and mortality in a large metropolitan city. J Asthma. 2001;38:625–35. doi: 10.1081/jas-100107540. [DOI] [PubMed] [Google Scholar]
- 29.Stevenson L, Garg R, Leighton J. Asthma hospitalization in New York City 1988–1997. J Urban Health. 2000;77:137–9. doi: 10.1007/BF02350969. [DOI] [PMC free article] [PubMed] [Google Scholar]
- 30.Wissow LS, Gittelsohn AM, Szklo M, Starfield B, Mussman M. Poverty, race, and hospitalization for childhood asthma. Am J Public Health. 1988;78:777–82. doi: 10.2105/ajph.78.7.777. [DOI] [PMC free article] [PubMed] [Google Scholar]
- 31.Lin S, Hwang SA, Pantea C, Kielb C, Fitzgerald E. Childhood asthma hospitalizations and ambient air sulfur dioxide concentrations in Bronx County, New York. Arch Environ Health. 2004;59:266–75. doi: 10.3200/AEOH.59.5.266-275. [DOI] [PubMed] [Google Scholar]
- 32.Lin RY, Pitt TJ, Lou W, Yi Q. Asthma hospitalization patterns in young children relating to admission age, infection presence, sex, and race. Ann Allergy Asthma Immunol. 2007;98:139–45. doi: 10.1016/S1081-1206(10)60686-2. [DOI] [PubMed] [Google Scholar]
- 33.Wallace JC, Denk CE, Kruse LK. Pediatric hospitalizations for asthma: use of a linked file to separate person-level risk and readmission. Prev Chronic Dis. 2004;1:A07. [PMC free article] [PubMed] [Google Scholar]
- 34.Bloomberg GR, Trinkaus KM, Fisher EB, Jr, Musick JR, Strunck RC. Hospital readmissions for childhood asthma: a 10-year metropolitan study. Am J Respir Crit Care Med. 2003;167:1068–76. doi: 10.1164/rccm.2201015. [DOI] [PubMed] [Google Scholar]
- 35.Ash M, Brandt S. Disparities in asthma hospitalization in Massachusetts. Am J Public Health. 2006;96:358–62. doi: 10.2105/AJPH.2004.050203. [DOI] [PMC free article] [PubMed] [Google Scholar]
- 36.Asthma hospitalizations and readmissions among children and young adults—Wisconsin, 1991–1995. MMWR Morb Mortal Wkly Rep. 1997;46(31):726–9. [PubMed] [Google Scholar]
- 37.Chabra A, Chavez GF, Adams EJ, Taylor D. Characteristics of children having multiple Medicaid-paid asthma hospitalizations. Matern Child Health J. 1998;2:223–9. doi: 10.1023/a:1022307423236. [DOI] [PubMed] [Google Scholar]
- 38.Fisher-Owens SA, Turenne WM, Chavanu K, Slonim AD. Racial disparities in children hospitalized with asthma at academic children's hospitals. Pediatric Asthma, Allergy & Immunology. 2006;19:162–71. [Google Scholar]
- 39.Minkovitz CS, Andrews JS, Serwint JR. Rehospitalization of children with asthma. Arch Pediatr Adolesc Med. 1999;153:727–30. doi: 10.1001/archpedi.153.7.727. [DOI] [PubMed] [Google Scholar]
- 40.Chen E, Bloomberg GR, Fisher EB, Jr, Strunk RC. Predictors of repeat hospitalizations in children with asthma: the role of psychosocial and socioenvironmental factors. Health Psychol. 2003;22:12–8. doi: 10.1037//0278-6133.22.1.12. [DOI] [PubMed] [Google Scholar]
- 41.Williams DR. The health of U.S. racial and ethnic populations. J Gerontol B Psychol Sci Soc Sci. 2005;60(Spec No 2):53–62. doi: 10.1093/geronb/60.special_issue_2.s53. [DOI] [PubMed] [Google Scholar]
- 42.Mangan JM, Wittich AR, Gerald LB. The potential for reducing asthma disparities through improved family and social function and modified health behaviors. Chest. 2007;132(5 Suppl):S789–801. doi: 10.1378/chest.07-1908. [DOI] [PubMed] [Google Scholar]
- 43.Tinajero AM, Donnelly EF. Trends in asthma hospitalizations in Rhode Island. Med Health R I. 2001;84:212–4. [PubMed] [Google Scholar]
- 44.Rhode Island Department of Health, Center for Health Data and Analysis. Hospital Discharge Data. [cited 2008 Aug 7]. Available from: URL: http://www.health.ri.gov/chic/statistics/hdd.php.
- 45.Census Bureau (US). American community survey. Census 2000 Summary File 3 (SF 3)—sample data. [cited 2008 Aug 7]. Available from: URL: http://factfinder.census.gov/servlet/DatasetMainPageServlet.
- 46.Census Bureau (US) Census tracts and block numbering areas. [cited 2008 Aug 7]. Available from: URL: http://www.census.gov/geo/www/cen_tract.html.
- 47.Bundy DG. Hospitalizations with primary versus secondary discharge diagnoses of asthma: implications for pediatric asthma surveillance. J Pediatr. 2007;150:446–9. doi: 10.1016/j.jpeds.2007.01.040. [DOI] [PubMed] [Google Scholar]
- 48.Reznik M, Hailpern SM, Ozuah P. Predictors of early hospital readmission for asthma among inner-city children. J Asthma. 2006;43:37–40. doi: 10.1080/02770900500446997. [DOI] [PubMed] [Google Scholar]
- 49.Rhode Island Department of Human Services. RIte Care, Rhode Island's Medicaid Managed Care Program. [cited 2008 Aug 7]. Available from: URL: http://www.dhs.state.ri.us/dhs/famchild/shcare.htm.
- 50.Federal Interagency Forum on Child and Family Statistics (US) America's children in brief: key national indicators of well-being 2005. Washington: U.S. Government Printing Office; 2005. Jul, [Google Scholar]
- 51.Hosmer DW, Jr, Lemeshow S. Applied survival analysis: regression modeling of time to event data. New York: John Wiley & Sons, Inc.; 1999. [Google Scholar]
- 52.Pankratz VS, de Andrade M, Therneau TM. Random-effects Cox proportional hazards model: general variance components methods for time-to-event data. Genetic Epidemiol. 2004;28:97–109. doi: 10.1002/gepi.20043. [DOI] [PubMed] [Google Scholar]
- 53.Silber JH, Rosenbaum PR, Even-Shoshan O, Shabbout M, Zhang X, Bradlow ET, et al. Length of stay, conditional length of stay, and prolonged stay in pediatric asthma. Health Serv Res. 2003;38:867–86. doi: 10.1111/1475-6773.00150. [DOI] [PMC free article] [PubMed] [Google Scholar]
- 54.The Kaiser Commission on Medicaid and the Uninsured. Insurance coverage of children by race/ethnicity and poverty level, 2005: national and state level estimates. [cited 2008 Aug 7]. Available from: URL: http://www.kff.org/medicaid/upload/kcmu051706oth.pdf.
- 55.LaViest TA. Disentangling race and socioeconomic status: a key to understanding health inequalities. J Urban Health. 2005;82(3 Suppl 3):iii26–34. doi: 10.1093/jurban/jti061. [DOI] [PMC free article] [PubMed] [Google Scholar]
- 56.Strunk RC, Ford JG, Taggart V. Reducing disparities in asthma care: priorities for research—National Heart, Lung, and Blood Institute workshop report. J Allergy Clin Immunol. 2002;109:229–37. doi: 10.1067/mai.2002.120950. [DOI] [PubMed] [Google Scholar]
- 57.Environmental Protection Agency (US). Toxics Release Inventory (TRI) program. 2002 Toxics Release Inventory data release questions and answers. [cited 2008 Aug 8]. Available from: URL: http://www.epa.gov/tri/tridata/tri02/index.htm.


