Abstract
Motivation
Profile searches of sequence databases are a sensitive way to detect sequence relationships. Sophisticated profile-profile comparison algorithms that have been recently introduced increase search sensitivity even further.
Results
In this article, a simpler approach than profile-profile comparison is presented that has a comparable performance to state-of-the-art tools such as COMPASS, HHsearch and PRC. This approach is called SCOOP (Simple Comparison Of Outputs Program), and is shown to find known relationships between families in the Pfam database as well as detect novel distant relationships between families. Several novel discoveries are presented including the discovery that a domain of unknown function (DUF283) found in Dicer proteins is related to double-stranded RNA-binding domains.
Availability
SCOOP is freely available under a GNU GPL license from http://www.sanger.ac.uk/Users/agb/SCOOP/
1 INTRODUCTION
Identifying similarity between proteins remains one of the key methods for the annotation of sequences from new genomes. For the most distant relationships, protein structure comparison is often used to identify evolutionary ancestry. Unfortunately we still lack a representative structure for most proteins. Therefore, it is important to be able to identify these distant relationships by sequence comparison alone. Profile-based search methods for proteins, such as PSI-BLAST (Altschul et al., 1997) and SAM (Krogh et al., 1994) can detect weak similarities between proteins with high sensitivity and specificity (Park et al., 1998). Databases of protein families (Letunic et al., 2004; Finn et al., 2006) provide collections of profiles for automated annotation of new genomes. A new generation of tools for the direct comparison of profiles have been developed including HHsearch (Soding, 2005) and PRC (http://supfam.mrc-lmb.cam.ac.uk/PRC/). Profile-profile comparisons are beginning to rival structural comparisons in sensitivity, in part due to the vast collections of sequences available.
Conceptually there is a second way to compare profiles: by searching each against a given sequence database and looking at the search outputs to see if they share any sequence regions in common. If we find that the two outputs contain significant scoring matches to the same regions of proteins then we can be confident the profiles are related. This kind of comparison is routinely carried out during sequence analysis projects and is equivalent to asking if two groups of sequences have any overlap. But it is possible to extend this idea further and compare not just significant scoring matches, but also those that might be considered non-significant. When comparing a single sequence against a database, one rarely gets a clean separation of true matches from presumably false matches. This means that there are many truly related proteins that do not score significantly. Experts at sequence analysis have become adept at investigating these insignificant matches and finding additional supporting evidence for relationships between protein families. If two profiles search outputs share many matches in common, even if they are not significantly scoring to either profile, they may be related. This work investigates to what extent the information from nonsignificant scoring matches can be used.
2 METHODS
A new strategy is presented to identify distant relationships between protein families. Rather than directly comparing profiles, this method compares the database search outputs that result from searching a sequence database with the profiles. The method presented in this article attempts to utilize these false-negative matches to find when two sequence families are related to each other.
2.1 SCOOP scoring function
The procedure presented is called SCOOP (Simple Comparison Of Outputs Program). The method compares the output of profile searches and asks whether there are more sequences found in common between the two outputs than expected by chance. For highly related query profiles, there will be a large number of sequences in common. For unrelated queries, the outputs will only share sequence regions in common due to chance. The following scoring function was developed to model this, called the ‘raw score’. This provides a measure for a match between families A and B:
where Obs is the observed number of overlapping regions between two search outputs. NA, NB are the total number of matches in the search output for family A and B, respectively.
Examination of all-against-all comparisons (see below) using this scoring function found that some families consistently scored higher than others. For example, some families of membrane proteins would score more highly against other membrane proteins probably due to biases in sequence composition. Therefore, for each pairwise comparison of search outputs, the following normalization is carried out to give the ‘normalized score’:
where SA is calculated as:
where N is the number of outputs matched.
This normalization reduces the score of any pair of profiles when either or both of them tends to score highly against a large number of other profiles.
2.2 Databases and software
To evaluate the SCOOP method, we used the search outputs of all the HMMER profile-HMM models in Pfam version 18.0 to find relationships. The search output files were constructed by searching all Pfam profile-HMMs against the Pfam sequence database that is based on Uniprot (Swiss-Prot 47.0 and SP-TrEMBL 30.0) (Wu et al., 2006). The HMMER software was used in ls mode with a gathering E-value of 1000. To benchmark the performance of the method, we compared it with the following profile-profile comparison tools: COMPASS (Sadreyev and Grishin, 2003), HHsearch (Soding, 2005), PRC (Martin Madera, unpublished data, http://supfam.mrc-lmb.cam.ac.uk/PRC/). We considered using the COACH software (Edgar and Sjolander 2004), but it is designed for alignment of families rather than scoring their similarity (Robert Edgar, personal communication). For each of these software tools we carried out an all-against-all comparison of Pfam release 18.0. For PRC, we used the version 1.5.2 using local-local mode with Viterbi alignments. For COMPASS, we used version 2.332 and for HHsearch version 1.2.0 was used, both with default options.
2.3 Implementation
The SCOOP method was implemented in Perl and requires a flatfile of matches from all search output files ordered by protein matched. The accuracy of the SCOOP method increases when there are a large number of regions matched to get enough statistics. Performance is degraded as the number of sequences in the underlying sequence database is reduced (data not shown). The use of normalization results in a significant performance increase but requires a large (>1000) set of profile-HMM outputs. The program performance was optimized to be run with the data from a large number of search outputs on an underlying sequence database, >1 000 000 sequences. Therefore, a complete database comparison is the recommended usage.
3 RESULTS AND DISCUSSION
3.1 Evaluation of SCOOP for protein family matching
To calculate how well the method performed in finding distant similarities between protein families, we used Pfam clans as the definition of true family relationships (Finn et al., 2006). Pfam clans are curated groups of Pfam families that have evolved from a common ancestor. Pfam release 18.0 contains 1181 families grouped into 172 clans. We used two different definitions of false matches: (i) when the two families are in different clans, called the conservative definition and shown in Figure 1a; (ii) when the two families are not in the same clan, called the liberal definition, shown in Figure 1c.
Fig. 1.
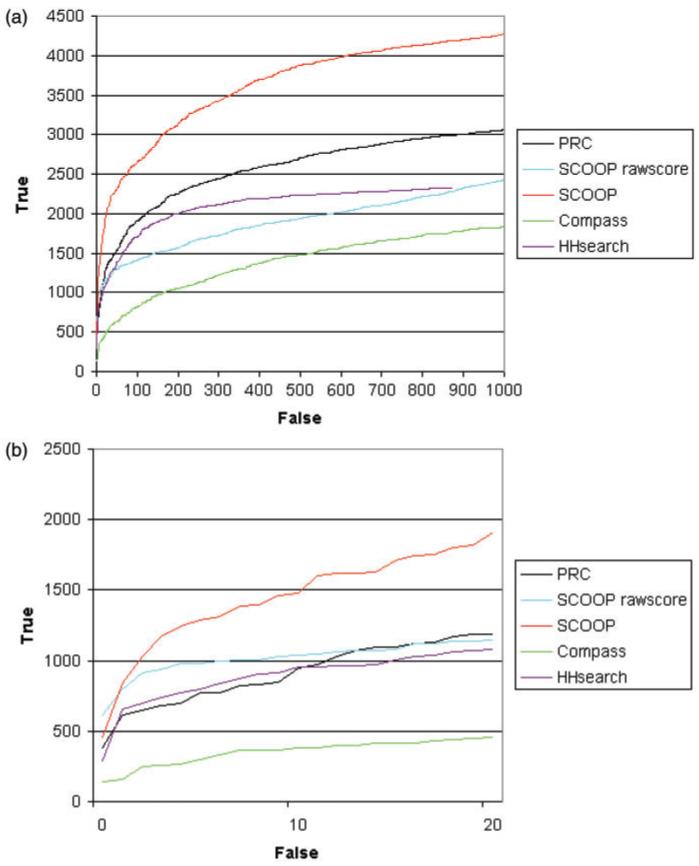
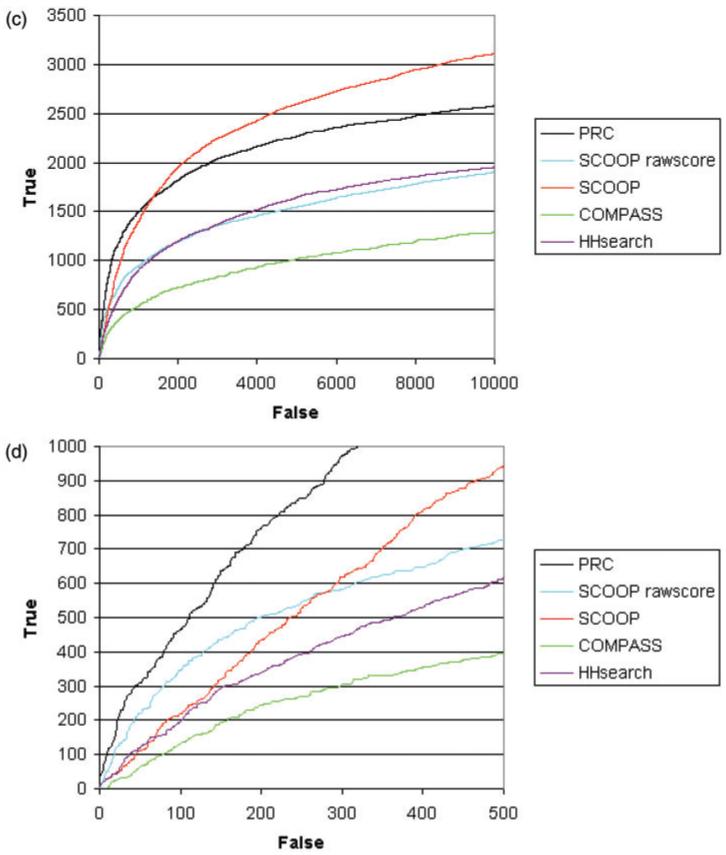
Roc curves comparing scoop to profile-profile comparison tools. The graph shows the cumulative number of true family relationships that are found with increasing number of false relationships. (a and b) using the conservative definition at high and low numbers of false positives; (c and d) using the liberal definition at high and low numbers of false positives.
Figure 1 shows an ROC curve demonstrating the performance of SCOOP compared to other methods using the conservative definition of false positives. Figure 1a shows the curves for a large number of false matches, whereas Figure 1b focuses on the region of the curves with few false matches. In both ranges, the normalized SCOOP scores achieve significantly better results than PRC, COMPASS and HHsearch. PRC and HHsearch outperform the SCOOP raw scores significantly when the number of false matches is >50. However, SCOOP reports high scores between other families that are not in a clan. These are effectively ignored by the conservative definition. If we assume that all pairs that are not known to be related by Pfam clans are unrelated, then we have many more true negatives and false positives. This leads to the liberal definition of false positives. Using this measure, Figure 1c and d shows that PRC outperforms SCOOP raw scores or normalized scores. Somewhat surprisingly, the raw scores outperform the normalized scores, which could suggest a specificity issue with the SCOOP method as discussed in Section 4.1. Based on the two measures above, SCOOP and PRC have a comparable level of performance and seem to perform better overall than COMPASS and HHsearch.
It should be noted that a number of different methods have been used in Pfam to define which families are related and placed into the same clan. The authors are also curators of the Pfam database. The SCOOP method was not used for curation of Pfam clans until after release 18.0. However, the PRC software has been used extensively to help find relationships between families in Pfam clans. This is likely to bias the results in favour of the PRC software.
The inclusion threshold set for profile searches with the HMMER package was set to an E-value of 1000. It is tempting to speculate that the power of the SCOOP method comes not from these insignificant matches but only from closely related matches. To test this, the SCOOP analysis was repeated but only considering matches with an E-value of 0.1 or less, 1 or less, 10 or less and 100 or less. These results are shown in Figure 2. The best results come from including matches up to an E-value of 1000. So, the insignificant matches are important for the SCOOP method, and the more matches the better.
Fig. 2.
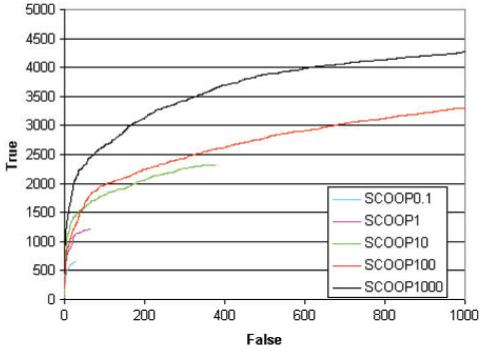
ROC curves comparing SCOOP including matches using different E-value thresholds. All curves use the conservative definition of false positives.
3.2 What is a significant SCOOP score?
For practical use of the SCOOP software, we need to know what threshold should be set and what the likely rate of false positives is at that score. Table 1 shows the ratio of true matches compared to false matches above any given score. Above a score of 30, 95% of the defined relationships are true, i.e. the positive predictive value. Above a score of 60, 99% of relationships that are found are true. A SCOOP score of over 100 appears reliable, but scores above 30 are also very likely to be true. Consideration of other functional and structural data would help us verify the relationship between families with lower scores.
Table 1.
Fraction of true matches found according to SCOOP normalized score (positive predictive value)
| Score | Fraction of true matches above scores |
|---|---|
| 0 | 0.044 |
| 10 | 0.754 |
| 20 | 0.924 |
| 30 | 0.959 |
| 40 | 0.982 |
| 50 | 0.989 |
| 60 | 0.992 |
| 70 | 0.994 |
| 80 | 0.997 |
| 90 | 0.997 |
| 100 | 0.998 |
| 110 | 0.999 |
| 130 | 0.998 |
| 140 | 0.998 |
This is calculated as true positives/(true positives+false positives).
For SCOOP scores over 100, about two-thirds of the relationships identified are within a Pfam clan, see Figure 3. This is strong support for the accuracy of the method. However, it also suggests that the method finds a large number of relationships that were not included in Pfam clans in release 18.0. By inspection, most of these represent true matches as judged from membership of known superfamilies. As with any sequence comparison method, false-positive matches with a significant score can occur. One of the highest scoring matches generated by SCOOP is between the WW domains and the MHC II alpha chain (score 263). These are clearly not related but an alignment of the two profiles shows that they do contain a region of similarity shown in Figure 4. These cases are rare, and the majority of matches are apparently novel and most likely true observations.
Fig. 3.
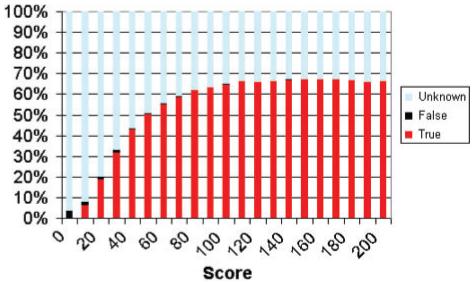
The fraction of matches above a given SCOOP score that are known to be true or false, or are unknown.
Fig. 4.
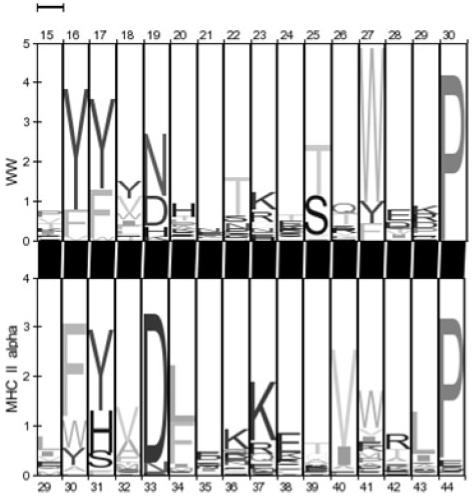
A pairwise HMM logo (Schuster-Bockler et al., 2005) of the highest scoring false match from the SCOOP results, between the WW domain and the MHC II alpha domain.
3.3 Novel protein family relationships
The results of the all-against-all comparison of Pfam 18.0 identify a large number of high-scoring matches between families that were previously unknown to be related. For example, the DM-associated domain (Ottolenghi et al., 2000) is found to be similar to the CUE domain (Score 43.6). The CUE domain is known to be a ubiquitin-binding domain (Shih et al., 2003), and the amino terminal FP motif has been demonstrated to be important for this interaction. We propose that the DMA domain also binds to ubiquitin via its conserved FP motif. A pairwise HMM-logo (Schuster-Bockler and Bateman, 2005) of the CUE and DMA domains is shown in Figure 5. For this example, the search outputs for CUE and DMA contain 818 and 828 matches, respectively, and they share 48 matches in common.
Fig. 5.
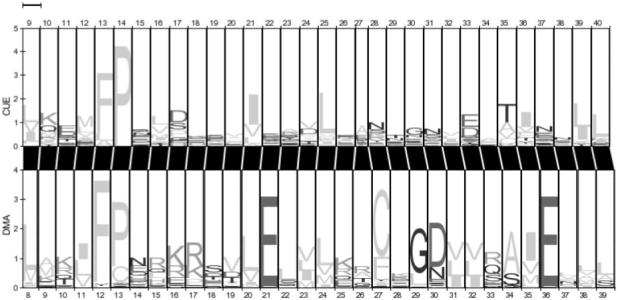
A pairwise HMM logo (Schuster-Bockler et al., 2005) of the CUE and DMA domains.
A domain of unknown function called DUF442 in Pfam scores 62 against the dual-specificity phosphatase (DSPc) family and 31 against the tyrosine phosphatase family (Y_phosphatase). An alignment of the DUF442 family (data not shown) shows conservation of the active site cysteine found in this phosphatase superfamily. We propose that DUF442 is a novel bacterial phosphatase family. In the majority of proteins, this domain appears alone. However, in many proteins, it is adjacent to other domains that are enzymatic, suggesting that this family regulates a variety of processes.
SCOOP also finds many relationships that are supported by structural databases such as CATH (Pearl et al., 2005) and SCOP (Andreeva et al., 2004) and those found in the literature. For example, this method strongly supports the published relationship between MazG and HisE (Moroz et al., 2005) with a score of 246.
A final example is a more weakly scoring match (10.73) between the domain of unknown function DUF283 found in the Dicer protein and the DSRM family of double-stranded RNA-binding domains. Dicer plays a key role in the synthesis of microRNAs and the RNAi pathway. Although this score is unconvincing, after improvement of the DSRM profile by iterative searching, the pair scores 29.15. Dicer domains are known to contain two C-terminal DSRM domains. However, it seems likely that dicer proteins have a third double-stranded RNA-binding domain between their helicase and PAZ domains.
4 CONCLUSIONS
The SCOOP method is a remarkably simple way to compare protein families. In some respects, it is surprising that it performs as well as it does. One can envisage many ways in which to develop this technique further. However, this would likely be at the cost of efficiency and elegance.
We have demonstrated that matches that are mostly discarded as noise are a rich source of information for finding superfamily relationships. However, because the SCOOP method is quite different from PRC and HHsearch, it reports a quite different set of matches to those methods (Figure 6). Therefore, it would seem that these methods are complementary and that the best results will be achieved with a combination of methods.
Fig. 6.
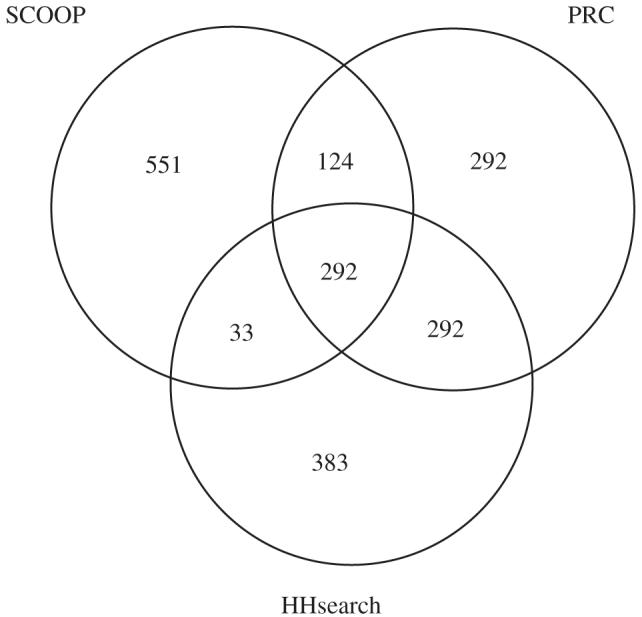
A venn diagram showing the degree of overlap between the top 1000 matches of SCOOP, PRC and HHsearch.
4.1 Limitations
The current implementation has two major limitations. First, the method assumes that the sequence databases are nonredundant. Many of the highest scoring false positives are due to cases where there are many identical sequences available within one family. If a second family also matches this sequence, it will look like the two families share many sequences in common. This will give the two families a high score. Fortunately, there are very few cases like this in the database.
A second shortcoming of this method is that when one domain is nested within a second domain by the overlap criteria used in SCOOP, they will appear to be related. For example, the CBS domain scores 93 against the IMPDH domain because a CBS domain is inserted within a loop of the IMPDH domain. However, there are only 50 examples of nested domains in Pfam release 18.0.
4.2 Extensions
Within this work, the SCOOP method has been used to compare the output of protein profile searches with the HMMER software. There is no reason why a similar strategy could not be applied to other types of sequence-comparison outputs. For example, one could compare BLAST or PSI-BLAST(Altschul et al., 1997) output files or sequence searches using DNA or RNA. Currently there is no practical way to compare profile-stochastic context-free grammars (or covariance models), and this would seem to provide one possible way to do that.
ACKNOWLEDGEMENTS
A.B. and R.D.F. are funded by the Wellcome Trust. A.B. would like to thank Sach Mukherjee for inspiration for the method as well as discussion of the implementation. The authors would also like to thank Anton Enright for fruitful discussions and Sam Griffiths-Jones for critically reading the manuscript. Funding to pay the Open Access publication charges was provided by The Wellcome Trust.
Footnotes
Conflict of Interest: none declared.
Supplementary information: Supplementary data are available at Bioinformatics online.
Publisher's Disclaimer: This is an Open Access article distributed under the terms of the Creative Commons Attribution Non-Commercial License (http://creativecommons.org/licenses/by-nc/2.0/uk/) which permits unrestricted non-commercial use, distribution, and reproduction in any medium, provided the original work is properly cited.
REFERENCES
- Altschul SF, et al. Gapped BLAST and PSI-BLAST: a new generation of protein database search programs. Nucleic Acids Res. 1997;25:3389–3402. doi: 10.1093/nar/25.17.3389. [DOI] [PMC free article] [PubMed] [Google Scholar]
- Andreeva A, et al. SCOP database in 2004: refinements integrate structure and sequence family data. Nucleic Acids Res. 2004;32:D226–D229. doi: 10.1093/nar/gkh039. [DOI] [PMC free article] [PubMed] [Google Scholar]
- Edgar RC, Sjolander K. COACH: profile-profile alignment of protein families using hidden Markov models. Bioinformatics. 2004;20:1309–1318. doi: 10.1093/bioinformatics/bth091. [DOI] [PubMed] [Google Scholar]
- Finn RD, et al. Pfam: clans, web tools and services. Nucleic Acids Res. 2006;34:D247–D251. doi: 10.1093/nar/gkj149. [DOI] [PMC free article] [PubMed] [Google Scholar]
- Krogh A, et al. Hidden Markov models in computational biology. J. Mol. Biol. 1994;235:1501–1531. doi: 10.1006/jmbi.1994.1104. [DOI] [PubMed] [Google Scholar]
- Letunic I, et al. SMART 4.0: towards genomic data integration. Nucleic Acids Res. 2004;32:D142–D144. doi: 10.1093/nar/gkh088. [DOI] [PMC free article] [PubMed] [Google Scholar]
- Moroz OV, et al. Dimeric dUTPases, HisE, and MazG belong to a new superfamily of all-alpha NTP pyrophosphohydrolases with potential “house-cleaning” functions. J. Mol. Biol. 2005;347:243–255. doi: 10.1016/j.jmb.2005.01.030. [DOI] [PubMed] [Google Scholar]
- Ottolenghi C, et al. The region on 9p associated with 46,XY sex reversal contains several transcripts expressed in the urogenital system and a novel double-sex-related domain. Genomics. 2000;64:170–178. doi: 10.1006/geno.2000.6121. [DOI] [PubMed] [Google Scholar]
- Park J, et al. Sequence comparisons using multiple sequences detect three times as many remote homologues as pairwise methods. J. Mol. Biol. 1998;284:1201–1210. doi: 10.1006/jmbi.1998.2221. [DOI] [PubMed] [Google Scholar]
- Pearl F, et al. The CATH Domain Structure Database and related resources Gene3D and DHS provide comprehensive domain family information for genome analysis. Nucleic Acids Res. 2005;33:D247–D251. doi: 10.1093/nar/gki024. [DOI] [PMC free article] [PubMed] [Google Scholar]
- Sadreyev R, Grishin N. COMPASS: a tool for comparison of multiple protein alignments with assessment of statistical significance. J. Mol. Biol. 2003;326:317–336. doi: 10.1016/s0022-2836(02)01371-2. [DOI] [PubMed] [Google Scholar]
- Schuster-Bockler B, Bateman A. Visualizing profile-profile alignment: pairwise HMM logos. Bioinformatics. 2005;21:2912–2913. doi: 10.1093/bioinformatics/bti434. [DOI] [PubMed] [Google Scholar]
- Shih SC, et al. A ubiquitin-binding motif required for intramolecular monoubiquitylation, the CUE domain. EMBO J. 2003;22:1273–1281. doi: 10.1093/emboj/cdg140. [DOI] [PMC free article] [PubMed] [Google Scholar]
- Soding J. Protein homology detection by HMM-HMM comparison. Bioinformatics. 2005;21:951–960. doi: 10.1093/bioinformatics/bti125. [DOI] [PubMed] [Google Scholar]
- Wu CH, et al. The Universal Protein Resource (UniProt): an expanding universe of protein information. Nucleic Acids Res. 2006;34:D187–D191. doi: 10.1093/nar/gkj161. [DOI] [PMC free article] [PubMed] [Google Scholar]


